R&D Investment in New Product Development
within the Technology Sector
João Tiago Coelho de Almeida
Master of Science
in Marketing
Orientador:
Prof. Paulo Rita, ISCTE Business School, Marketing Department
Co-Orientadora:
Prof. Sofia Ramos, ISCTE Business School, Finance Department
“I believe in innovation and that the way you get innovation is you fund
research and you learn the basic facts.”
Acknowledgments
Despite being an individual thesis, there were several people that in one way or another were unconditional important. Consequently, I would like to express my true gratitude. First of all, I would like to thank my parents for their guidance and friendship. A special gratitude to my brother for being patient and an amazing friend.
To my supervisors Dr Sofia Ramos and Dr Paulo Rita, both from ISCTE Business School (Portugal), for all the advices they gave me and all the time they invested to guide me.
To my fantastic friends for accepting me with all my faults and virtues. I carry you all in my heart. And a special note to my good friend Diogo Moreira for his help.
Abstract
Through the fast growing globalization, the consumption of technology is showing a massive increase year after year. Since the beginning of this millennium, the number of people using all kinds of technology products is being spreading through all around the world. The consumers unsustainable needs for new and better technology products are the reason to the product life cycle decrease. In order to have a competitive product, companies have to focus their resources to new product development process by investing in research and development.
This dissertation was made with the purpose to understand the technology companies growth when investing in research and development. There are different technology sectors where the companies growth effects are different when they invest in research and development. Also, depending on the companies profitability, the research and development investment may have more or less effect in their growth. Consequently, the propose of this dissertation is to understand how the research and development investment has effect in the technology companies growth. In order to accomplish equitable results, we analyzed a few financial variables such as the asset growth, the return on assets and the return on equity.
To achieve accomplish the study results, it was conducted a linear regression model and a quantile regression model to analyze the variables relations.
This study shows which type of companies can accomplish higher results when investing in research and development. It also estimate a general positive effect from the research and development investment.
Resumo
Através do rápido crescimento da globalização, o consumo da tecnologia tem apresentado ano após ano um forte crescimento. Desde o início do milénio, que o número de pessoas a utilizarem produtos tecnológicos tem vindo a aumentar por todo o mundo. A insustentável necessidade por novos e melhores produtos tecnológicos tem originado uma redução do ciclo de vida do produto. Com o objectivo de possuírem um produto competitivo, é crucial às empresas focarem os recursos no processo de desenvolvimento de novos produtos através do investimento em pesquisa e desenvolvimento.
Esta dissertação foi elaborado com o propósito de perceber o crescimento das empresas tecnológicas quando estas investem em pesquisa e desenvolvimento. Dependendo dos vários sectores tecnológicos, o crescimento das empresas varia quando estas investem em pesquisa e desenvolvimento. Além disso, o efeito apresentado no crescimento das empresas quando investem em pesquisa e desenvolvimento depende da sua rentabilidade. Consequentemente, esta dissertação tem como objectivo perceber o efeito do investimento em pesquisa e desenvolvimento no crescimento nas empresas tecnológicas. Afim de atingir resultados fiáveis, analisámos algumas variáveis financeiras nomeadamente o crescimento dos activos, o retorno sobre os activos e o retorno sobre o património.
Para atingir os resultados pretendidos, foi executado o modelo de regressão linear e o modelo de regressão de quantílica com o propósito de analisar a relação entre as variáveis.
Este estudo apresenta que tipo de empresas conseguem atingir melhores resultados dependendo no investimento efectuado em pesquisa e desenvolvimento. Além disso, estima ainda que no geral existe um efeito positivo quando se investe em pesquisa e desenvolvimento.
Palavras-chave: Tecnologia, Pesquisa e Desenvolvimento, Desenvolvimento de Novos Produtos, Inovação
Table of Contents
1) Introduction………..………..………..………..………..…………. 1
2) LITERATURE REVIEW…..………..………..……..……..………..……..… 3 2.1) Introduction…..……..……..……..……..……..……..……..……….……….… 3 2.2) New Product Development…..……..……..……..……..……..……..……..……..… 3 2.3) Product Life Cycle…..……..……..……….………..……..……..……..……..…….. 4 2.4) Research and Development….….….….….….….….….….….….….….….….….…. 4
3) Methodology….….….….….….….….….….….….….….….….….….….….….….….………. 8 3.1) Regressions models….….….….….….….….….….….….….….….….….….….….… 8 3.1.1) Linear Regression….….….….….….….….….….….….….….….….….….. 8 3.1.2) Quantile Regression….….….….….….….….….….….….….….….….…… 9 4) Method……..….…..….….….….….….….….….….….….….….….….….….….….….….…. 10 4.1) Time Period.….….….….….….….….….….….….….….….….….….….…….….…. 10 4.2) Filter….….….….….….….….….….….….….….….….….….….….….….….…….. 10 4.3) Sectors….….….….….….….….….….….….….….….….….….….….….….….…… 10 4.4) Variables….….….….….….….….….….….….….….….….….….….….….….….…. 11 4.5) Sample Segmentation….….….….….….….….….….….….….….….….….….….…. 12 4.5.1) Variables by Sector….….….….….….….….….….….….….….….….….… 12 4.5.1.1) Research and Development Ratio by Sector….….….….….…….. 13 4.5.1.2) Asset Growth by Sector….….….….….….….….….….….……… 13 4.5.1.3) Return on Assets by Sector….….….….….….….….….….….….. 14 4.5.2) Research and Development ratio and Return on Assets by Country……….. 15 4.5.3) Research and Development ratio and Return on Assets by Years….….…… 17 4.5.4) Sample Segmentation main Conclusions….….….….….….….….….….….. 18
5.1.3) Research and Development Ratio, Return on Assets and Return on Equity by Sector in Different Markets.….….….….….….…….…….………… 22 5.2) Quantile Regression Model….….….….….….….….….….….….….….….………… 24
5.2.1) Research and Development Ratio and the Asset Growth by Sector….…….. 24 5.2.2) Research and Development Ratio and the Return on Assets by Sector…….. 26 5.2.3) Research and Development Ratio, Return on Assets and Return on Equity by Sector in Different Markets….….….….….….….….….….….….…. 27
6) Main Conclusions….….….….….….….….….….….….….….….….….….….….….….….…. 30 6.1) Relation between R&D with the asset growth, the return on assets
and the return on equity.….….….….….….….….….….….….….….….….….….…..…… 30 6.2) Regressions performances….….….….….….….….….….….….….….….….….…… 33 6.3) Implications and Main Limitations….….….…..….….….….….….….….….….…… 36 6.4) Next steps….….….…..….…..…..….…..…..….……..….….….….….….….….…… 36
7) References….….….….….….….….….….….….….….….….….….….….….….….….….…. 37 7.1) Scientific Papers….….….….….….….….….….….….….….….….….….….….….. 37 7.2) Web Bibliography….….….….….….….….….….….….….….….….….….….…….. 40 7.3) Books….….….….….….….….….….….….….….….….….….….….….….….……. 40
Index of Tables
Table 1: Percentage of the total observations in each sector……….……….………… 11
Table 2: Variables……….……….……….……….……….………….. 12
Table 3: R&D Ratio Statistics by Sector……….……….……….………. 13
Table 4: Asset Growth Statistics by Sector……….……….……….……….. 14
Table 5: Return on Assets Statistics by Sector……….……….……….. 14
Table 6: R&D ratio and Return on Assets Statistics by Country……….………..… 16
Table 7: R&D ratio and Return on Assets Statistics by Years……….………..……. 17
Table 8: R&D Ratio and the Asset Growth of all Technology Companies……….………..…… 19
Table 9: R&D Ratio and the Asset Growth positive effect by Sector……….……… 20
Table 10: R&D Ratio and the Return on Assets of all Technology Companies……….………… 21
Table 11: R&D Ratio and the Return on Assets positive effect by sector……….………. 21
Table 12: R&D Ratio, Return on Assets and Return on Equity of all Technology Companies from the ROFW and the U.S.……….……….……….……….. 22
Table 13: R&D Ratio, Return on Assets and Return on Equity positive effect by sector from the ROTW and the U.S.……….……….……….……… 24
Table 14: R&D Ratio and the Asset Growth positive effect by sector……….………. 25
Table 15: R&D Ratio and the Return on Assets positive effect by sectors……….……….. 27
Table 16: R&D Ratio, Return on Assets and Return on Equity positive effect by sector from the ROTW and the U.S.……….……….……….……… 29
Table 17: Linear Regressions main conclusions……….……….……….. 31
Table 18: Quantile Regressions main conclusions……….……….……….. 32
Table 19: Models Comparison between the R&D Ratio and the Asset Growth……….…………34
Table 20: Models Comparison between the R&D Ratio and the Return on Assets……….…….. 34
Table 22: Models Comparison between the R&D Ratio, the Return on Assets and the Return on Equity from the ROFW and the U.S.……….……….……… 35
Index of Figures
Figure 1: R&D Ratio Mean……….……….……….……… 17
Figure 2: Return on Assets Mean……….……….……….……….. 18
Figure 3: R&D Ratio and Return on Assets……….……….……….….. 23
Figure 4: R&D Ratio and Return on Equity……….……….……….….. 23
Figure 5: R&D Ratio and the Asset Growth from all Technology Companies……… 25
Figure 6: R&D Ratio and the Return on Assets for all Technology Companies………. 26
Figure 7: R&D Ratio, Return on Assets and Return on Equity of all Technology Companies from the ROTW……… 28
Figure 8: R&D Ratio, Return on Assets and Return on Equity of all Technology Companies in the U.S.……….. 28
Index of Equations Equation 1: Equation in the Linear Regression……….……….……….……… 8
Executive Summary
The main goal of this research is to understand how does the research and development (R&D) investment has influence in technology companies’ growth by studying the return on assets, return on equity and the asset growth. In this present economic environment where technological advances happen very quickly and products life cycle is cut short, companies need a strategy for new product development (NPD), but also need to know the factors that determine the market success of new products (Roehrich, 2004). NPD is one of the most crucial aspects in companies, particularly in the technology industry where companies must invest in R&D in order to achieve competitive success.
This study reports the R&D effect in technology companies depending on which sector they belong to. Therefore it was analyzed five different sectors: Telecommunication and Equipment, Computer Hardware, Internet, Semiconductors and the Software. It was also integrated an analysis to each sector by two different markets the United States (U.S.) and the rest of the World (ROFW) market.
From the vast research that was made to previous studies about R&D, it was not found any study about this specific topic. Never the less, several authors have studied the R&D effect. In Eberhart, Maxwell and Siddique (2002), Miltersen and Schwartz (2004) and Damianova (2005) studies and also, with different approaches, Fain, Kline and Duhovnik (2011) and Meyer (2011) studies, by analyzing numerous companies, the authors perceived a positive effect in the companies’ growth when investing in R&D. More skeptical studies Chan, Lakonishok and Sougiannis (2001) Jaruzelski, Dehoff, and Bordia, (2005) and Cryan and Theriault, (2012) suggest no link between the R&D investment and the companies’ growth.
To collect the entire essential financial data from the technology companies relevant for the study, it was used the Datastream software. To perform this analysis, it was decided that we would study the years between 2003 and 2013. After collecting all the data, it was chosen to
By performing the descriptive statistics analyses, it was concluded that there was a strong relation between the R&D ratio and the financial variables chosen to study, being those variables: the asset growth and the return on assets. There were also two other conclusions, first it would make sense to study each sector separately, secondly, due to higher number of observations on the U.S. market compared to any other country, it would be interesting to compare it with the ROTW.
Considering the aim of this study, it was conducted a linear regression model with three different analyses. In the first it was studied the relation between the R&D investment and the asset growth for each sector. In this analysis, it was noticed a general positive relation between both variables. The second analyses consisted in studying the relation between the R&D ratio and the return on assets for each sector. In a first approach it was noticed that there were no statistical significance level, therefore it was decided to eliminate all the observations where the return on assets were negative, this restriction was used in all the dissertation which have produced more accurate results. The results showed also a positive effect of the R&D investment. The third analysis was focused on study the relation between the R&D, the return on assets and the return on equity, a variable introduced here, to study each sector.
Consequently it was used a quantile regression model to perform the same three analysis. By using this model, it was decided to divide the companies into three different groups. The first group consists of companies with low profitability and is showed by the 10th quantile while the second group consists of companies with average profitability and is showed by the 50th quantile or the median and the last group consists of companies with high profitability and is showed by the 90th quantile.
Finally, after perform booth models, an analysis has been made inside each model to conclude which sector have shown the highest growth when investing in R&D. In the quantile regression model, it was compared the companies’ profitability with their
Considering all the analyses that were conducted, it was concluded that the computer hardware sector had the highest results when investing in R&D and, in general, the Internet sector showed the lowest results. It was also noticed that companies with higher profitability from certain sectors showed higher performances, but the lowest performance were also shown from companies with higher profitability but from different sectors. The results that were obtained in this study show conformity with previous studies.
The results obtained exceeded our perspectives. The main reason for these positive results is, probably, the fact that this study is an analysis to a fast growing industry with a low product life cycle. R&D spending has higher impact in technology and science-oriented firms, which from their studies represent 17 percent of sales and two times earnings (Eberhart, Maxwell and Siddique 2007). Several authors Hof (1992), Verity (1992) and Steffens (1994) concluded that the products’ life cycle is shrinking in all kinds of industries but especially in the technologic ones. To be more competitive, companies have to increase their investments in R&D, in order to create new products. Consequently, the results obtained show how this industry is affected by R&D investment.
1) Introduction
To maintain their competitive position, technology companies rapidly innovate in order to introduce new products by investing in R&D. It is estimate that in the beginning of 2000, 5% of the world population had access to the internet, fourteen years later the percentage of population with access to the internet have increased to 41% (source: Internet World Stats). This shows the massive increase of technology in people lives.
A large empirical literature has studied the R&D impact in all types of industries. With the goal of being more competitive, companies align their strategies to meet consumer’s needs. This thesis investigates the effect of R&D investment on company’s growth. R&D investments contribute directly to the development of new products and support indirectly the successful adoption of technologies developed outside the firm. In particular, R&D investments aim to improve the profitability of the firm (Damianova 2005). The decision to invest in R&D can be difficult to managers, especially not only because there is an uncertainty affected by the market unpredictability but also because the R&D investment may take long time to show returns. R&D investment projects typically take a long time to complete and since there is a learning process about the R&D project as investments proceed, there is large uncertainty about the investment costs required for the R&D project (Miltersen and Schwartz, 2004).
After collecting and analyzing all the available data, it was necessary to ignore some companies due the lack of data, therefore this study focus in five different sectors:
Telecommunication and Equipment Computer Hardware
Internet
Semiconductors Software
Because this is a fast growing industry, the importance to innovate and create new products is a crucial aspect in order to be competitive. Faster technological development, shorter product life cycle, and more intense global competition have transformed the current competitive environment for the most firms (Cassiman, Guardo and Valentini, 2006).
consumer forms his preferences for a specific technology by evaluating technologies with respect to his perceptions of all available technologies that may fulfill his needs (Hauser, 1984). So, to survive to this fast growing market and to be more profitable, companies have to innovate by creating new products with new features, but profits come from sales and sales come from products that fill consumer’s needs.
This research has the purpose of unveil how the investment in R&D has impact in the technology companies’ growth. To understand the relation between the R&D investment and the technology growth, some variables such as the asset growth, the return on assets (ROA) and the return on equity (ROE) will be used. To analyze the technology market, we have used the Datastream software to collect data from companies with more than five years on stock market, from all stock markets in the world. As result of the large number of variables, it was necessary to use the Stata software to analyze it. Regarding the Datastream data, the technology market was divided by sectors in order to allow the study of each sector and to understand the R&D effect. It was also divided into two different markets, the United States (U.S.) and the rest of the World (ROFW) market. By conducting a study to those five technology sectors, by choosing those three variables in order to understand the relation with the R&D and by differentiating the U.S. market from the ROTW we hope to fill an existent gap of the R&D studies.
2) Literature Review
2.1) Introduction
Companies that establish the required organizational structures and processes in order to be more productive in creating new products are more likely to respond to what costumers need. Without a substantial investment in R&D, companies may fail in the new product development process. In several studies, authors tried to evaluate companies’ financial performances when investing in R&D. The objective of this study is also to evaluate how R&D affects companies’ financial performances by analyzing a specific type of industry. It is known that technology and healthcare industries invest more in R&D that any other industry. In Eberhart, Maxwell and Siddique (2008) studies, concluded that R&D spending has higher impact in technology and science-oriented firms, which from their studies represent 17 percent of sales and two times earnings. Having this in mind, this study conducts an analysis to the R&D investment in the technology industry. To link the importance of this study, this literature review has three main pillars: the NPD, the product life cycle and the R&D importance.
2.2) New Product Development
“When we create stuff, we do it because we listen to the customer, get their inputs and
also throw in what we’d like to see, too. We cook up new products.” (by Steve Jobs. Beahm, 2011).
Creating new products is a critical factor in business activity where companies struggle to compete in a high level. As Patrick (1997) suggest, new products help maintaining growth and thereby protect the interests of investors, employees and suppliers of the organization. The R&D and marketing combination are considered to be a crucial factor within NPD. The måore innovative the NPD projects are, the greater is the needed to integrate marketing and R&D functions within the company (Fain, Kline and Duhovnik 2011). An accurate representation of cross-functional relationships in NPD must include all three functional perspectives: R&D, marketing and manufacturing (Song 1997). R&D and marketing are
main determinant at the product development effort. Do not expect to have a high-impact effort if management is not prepared to commit the R&D dollars as a percentage of sales (Cooper and Kleinschmidt 2007). NPD process has direct impact in companies’ competitiveness, but depending on the type of industry the new products may have higher or lower life cycle.
2.3) Product Life Cycle
The life cycle refers to the period from the product’s first launch into the market until its final withdrawal and it is split in phases (Komninos, 2001). The fast technology development and the global competitiveness have decreased the product life cycle. This unbroken change is forcing companies to a continuous innovation by investing in R&D. Consequently, knowledge has become an important aspect in companies strategic management. Several authors state that product life cycle is getting shorter over time. I can’t document it, but every industry we look at seems to be undergoing shorter life cycles (Fraker, 1984), marketing consultants say product life cycles are shortening every year (Alsop, 1986). Most technology companies are experiencing highly volatile markets with increasingly shortening product life cycle due the rapid technological innovation and market competition (Aytac and Wu, 2013). The product life cycle decreasing, in the technology industry, is perceived by several authors such as Steffens (1994) NS Verity (1992). By noticing the life cycle decreases, companies had to develop and implement new strategies in order to accelerate the innovation and NPD process, consequently to became more competitive. Shrinking product life cycle brings critical changes in industries such as “increase in the percentage of revenues that should be spent on R&D and new product development” (Pierz,1995). To summarize, the fast creation of new products to replace older ones is shrinking products’ life cycle. In industries where high competitive awareness is a critical factor to survive, the NPD process has a crucial importance in companies’ success and therefore it is crucial to invest in R&D.
The main purpose of this thesis is to focus in the R&D investment and understand how it contributes to technology companies’ financial growth. With the conduct a relevant study, it was important to analyze previous research.
In order to grow and proliferate, companies must innovate by creating new products. Companies ‘growth comes from sales and sales come from products that are, according to costumers needs. According with Utterback (1974), where the author studied over 2000 products and 100 industries and concluded that 60% to 80% of the successful innovations is drive by the perception and recognition of the consumers needs. The recognition of those needs, will simplify the effectiveness of the R&D processo to fulfill the consumers expectations. The R&D task was to refine the technology to increase consumer acceptance (…) R&D can focus on knowing physical characteristics or adapt, adopt, or invent new physical characteristics in order to deliver the consumers’ benefits (Hauser, 1984). Struggling to survive in the market, companies must understand what people need and how can they deliver a product to answer to those needs.
Product competition during the marketing phase has a major importance for the R&D investment decision during the developing phase considering also that the competing products have to go through a similar development phase (Miltersen and Schwartz, 2002). Low competition between companies in the same market makes a more passive innovation and lower costs with R&D. Specially in “bad” times they (managers) are likely to protect their markets rather than expand their markets through innovative products (Geroski and Gleeg, 1997). Which means, when the market has a higher competition, there is more pressure through innovation and so companies will spend more with R&D so they can compete in the market. Specially, when we are talking about technology markets where the product life cycle is continuously shrinking. Markets like these are made by trends that are always evolving. According to Lee (2009) study, where the author analyzed 1021 firms in several countries, he notice that the response of companies to the competitive market pressure is related with the company level of technology competence, when a company has a high level of technological competence it will increase their R&D effort but when a
that “easy substitution is negatively correlated with innovation activities, the constant arrival of competing products is positively associated with R&D or products innovation, and, that quick obsolescence of products is positively related to R&D and product innovation, but negatively to acquisition of technology and process innovation”. Kukuk and Standler (2005) studied, based on a cross-section of 2.775 German companies where they analyzed the effects of relationships on innovation, by using two types of competition measures: a rivalry measure on a five points Likert Scale of the intensity of technology and the second one the market power as measured by the quantity of competitors. They concluded that technology competition boosts the innovative effort, but the effect of market power showed to be ambiguous.
Uncertainty is the key word between companies and the decisions to invest. Investing in R&D is not only an important aspect for companies to be updated with the new trends as also to improve the consumer’s perception and confidence. But there is several factors that can influence the investment decisions. The impact of R&D investments on the future economic performance of the firm is highly unpredictable since it is affected by market and technology uncertainty but also by firm’s ability to exploit emerging opportunities created buy the uncertain environment (Damianova, 2005). Based on articles from Porter (1992), Hall (1993) and Hall and Hall (1993), they state that investors have short-term view and so they do not forecast future returns from long term investments such as R&D. Companies have opportunities to boost their R&D expenditures but they strangle with it because of the negative impact in short-term earnings per share (Cryan and Theriault, 2012).
There are several authors that analyze the R&D effect in companies by using a few financial data. A few studies concluded that the R&D investment has no effect in companies’ performance, Cryan and Theriault (2012) studied the 250 largest U.S. non financial companies, and concluded that just by increasing the R&D expenditures of a company, will not consequently lead to increase long-term value. Chan, Lakonishok and Sougiannis (2001) concluded, based on their analyses, that there is no direct link between R&D spending and future stock returns. For firms engaged in R&D, the evidence on an association between R&D intensity measured relative to sales and future returns is not strong (Chan, Lakonishok
sales growth, profits, market capitalization, or yield. It is also important to mention how difficult it is to perceive the R&D impact in the stock market. Returns to innovation are mostly earned by embodying it in a tangible good or service, which is then sold or traded for other information that can be embodied (Pakes, 1984). Consequently, it is very difficult to understand the direct impact of innovation, it is not like sales variables or costs variables. Different results were obtained from several authors, such as Eberhart, Maxwell and Siddique (2002) where they studied 8.313 companies and concluded that between the five-year period following companies R&D increases, there was consistently strong evidences that firms experience significantly positive abnormal operating performance. They also concluded that investors continually underrate the benefit and importance of an R&D increase. From others studies, we notice that there is a link between R&D investment and the market value, companies that report positive profits receive a higher market evaluation for their R&D activities than companies with negative profits. Miltersen and Schwartz (2004) used a model to show that competition in R&D in most cases not only increases production and reduces prices, but also shortens the time of developing the product and increases the probability of a successful development. The empirical evidence reported in this study confirms that there is a certain direct link between R&D investments and the market value of the firm, as reported in previous studies (Damianova 2005). Some other studies are also relevant to this research, such as the Fain, Kline and Duhovnik (2011) study that concludes by performing a questionnaire survey that people perceive the R&D effort in new products. Meyer (2011) studied the R&D in a global vision and concluded “Countries with high R&D elasticity also experience much faster technological progress with corresponding productivity gains”.
Several authors have studied the importance of R&D in several markets and industries leaving some gaps to being study. A large empirical literature suggests the importance of the R&D in the NPD particularly in industries where the product life cycle is shrinking. Therefore an analysis to the R&D effect into the technology industry could potentially offer knowledge to better understand this subject.
3) Methodology
Technology companies are growing year after year not only in number but also in profit. The main aim of this analysis is to understand how the investment in R&D affects the technology market.
To conduct the thesis study, we had to collect the technology companies’ financial data from the Datastream Professional. After gathering all the technology companies’ financial data, we used the Stata software to perform the analysis.
3.1) Regression Models
3.1.1) Linear Regression
In order to achieve the best results, this study starts by doing a linear regression. Linear regression is a statistical tool for modeling the relationship between a dependent variable and one or more independent variables (Klein & Amos, 1999). When performing a linear regression model, the dependent variable is a linear function of one or more independent variables and it is given by the following equation:
y=β
0+
∑
β
iX
i
The linear regression is a model that analyzes the past period helping to forecast. Practitioners have been found to be very familiar with linear regression and to employ it as a forecasting tool in tasks such as sales prediction (Mentzer and Cox, 1984 Sanders, 1994). By using the Linear Regression we made three different analyses:
1. A linear regression to study the relation between the Asset Growth and the Research
and Development ratio for each sector.
2. A linear regression to study the relation between the Return on Assets and the
Research and Development ratio for each sector. Equation 1: Equation in the Linear Regression
3.1.2) Quantile Regression
After performing the linear regression, it was decided to perform a quantile regression. The quantile regression is a model that divides the population provides a convenient way to introduce a type of heterogeneous treatment effect (e.g. Abramovitch 1979, Doksum 1974, Koenker 2005). By using this model it was possible to divide the population in three different quantile:
1. Technology companies with lower profitability are shown in quantile10.
2. Technology companies with average profitability are shown in quantile50, which
also represent the median.
3. Technology companies with highest profitability are shown in quantile90.
The analysis of those three quantiles it will give some conclusions of how the investment in R&D affects the technology companies depending on their profitability.
4) Method
This study registered a total of 376 technology companies within six different sectors. Of those companies, a total of 30 were considered invalid because they had been in the stock market less than five years, which displays a lack of data. Therefore this study was conducted with a total of 346 valid technology companies, representing 92% of all technology companies in the stock market from all around the world.
4.1) Time Period
While collecting the financial data it was decided to study a specific period of time, following that decision it was chosen to used the years between 2003 until 2013. It was determined to study this period of time because of three things, it is the most recent years that we have, secondly it give us an understanding of the beginning of the century through the great crisis of 2009 and finally it was decided to exclude the period of the dot.com bubble because there was a high speculation about the technology companies which makes it irrelevant to study.
4.2) Filter
According to the previous studies that were analyzed from some authors, it was decided to impose a filler on our sample. All the technology companies in this study have been in the exchange market for more than five years. There are two reasons that made us suppress all the technology companies who entered the market exchange in the past five years, firstly because it would have some companies with lack of results to study, secondly because this way we have more mature technology companies. With this restriction we have more consolidate results. Of the 376 technology companies listed in all stock markets around the world, it will be studied a total of 336.
4.3) Sectors
Each technology companies that were collected from Datastream belong to a specific industry sector inside the technology market. The 336 technology companies are divided by six different industry sectors, as it is show in table 1.
Through the differentiation of the technology companies by each sector, it is possible to analyze the different R&D effects depending on the technology sector. Therefore, this study will show in which sector the R&D investment has more impact in the companies’ growth.
4.4) Variables
The main purpose of this study is to understand how technology companies’ growth is being affected when it is invested in R&D. According to that, it was necessary to collect some data from each company to study their financial performance. Table 2 shows the variables that were used in this study.
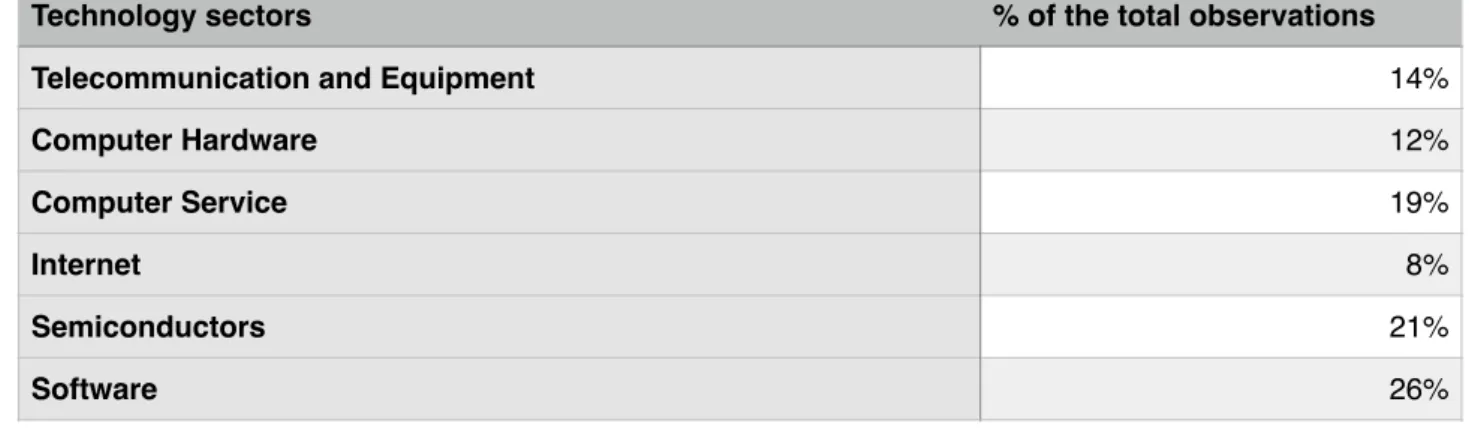
Table 1: Percentage of the total observations in each sector
Technology sectors % of the total observations
Telecommunication and Equipment 14%
Computer Hardware 12%
Computer Service 19%
Internet 8%
Semiconductors 21%
While studying our sample, it was found some missing values of some companies’ financial data, therefore we had to eliminate the outliers when performing the analysis in Stata by using the command winsorize.
4.5) Sample Segmentation
Like other researches, this first phase will segment all the data that was collected from the Datastream network through a descriptive statistic analysis.
4.5.1) Variables by Sector
Following the main goals of this research, it is mandatory to start the descriptive statistics by analyzing the three most important variables by sector, consequently, the subsequent tables will show the mean, standard deviation, the median and the observations number of each variable by each sector
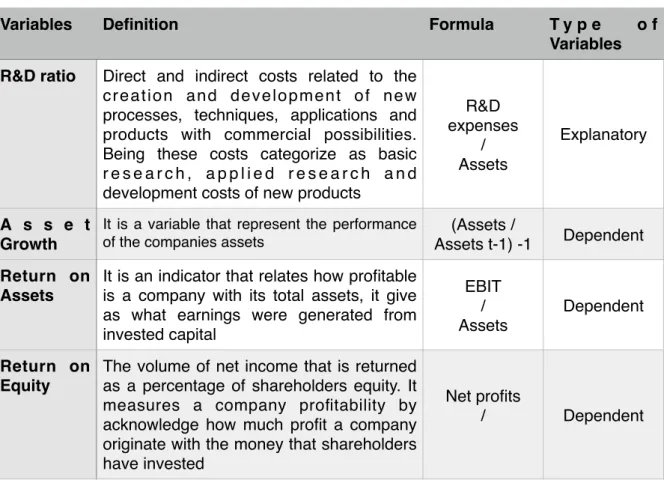
Table 2: Variables
Variables Definition Formula T y p e o f
Variables R&D ratio Direct and indirect costs related to the
creation and development of new processes, techniques, applications and products with commercial possibilities. Being these costs categorize as basic r e s e a r c h , a p p l i e d r e s e a r c h a n d development costs of new products
R&D expenses / Assets Explanatory A s s e t Growth
It is a variable that represent the performance of the companies assets
(Assets /
Assets t-1) -1 Dependent Return on
Assets
It is an indicator that relates how profitable is a company with its total assets, it give as what earnings were generated from invested capital EBIT / Assets Dependent Return on Equity
The volume of net income that is returned as a percentage of shareholders equity. It measures a company profitability by acknowledge how much profit a company originate with the money that shareholders have invested
Net profits
4.5.1.1) Research and Development Ratio by Sector
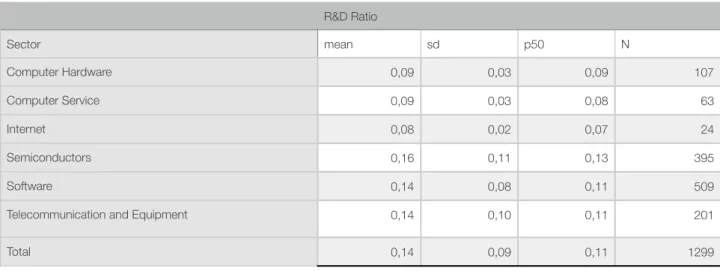
Table 3 shows the R&D ratio variable by sector where it is possible to verify a total of 1299 observations. By measuring the mean with the median, p50, it is notable that there is a central tendency, which indicates symmetry of the R&D ratio data. It is possible to verify the low number of Computer Service observations comparing to the fact that this sector represents 19% of the total companies. The Semiconductor registered the highest mean from all the sectors followed by the Software and the Telecommunication sector. The Software sector accounts for 39% of all the R&D ratio observations.
*** p<0.01, ** p<0.05, * p<0.1
4.5.1.2) Asset Growth by Sector
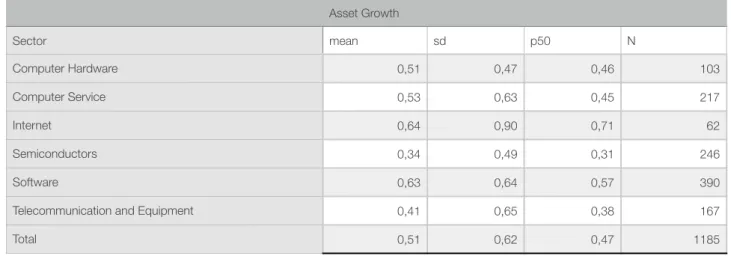
From the descriptive statistics analysis displayed in the table below, the Internet sector shows the highest mean with 5,2% of the observations followed by the Software sector accounting for 32,9% of the total observations. The Internet sector median is higher than the mean which implies the existence of extreme lower values that are farther from the mean than the extreme higher values. The asset growth variable accounts for 1185 observations, which shows a decrease of 114 observations comparing to the R&D ratio variable. With the Computer Hardware exception, all the sectors show a higher standard deviation compared to the mean, those results can be the consequence of the outliers’ existence.
Table 3: R&D Ratio Statistics by Sector
R&D Ratio Sector mean sd p50 N Computer Hardware 0,09 0,03 0,09 107 Computer Service 0,09 0,03 0,08 63 Internet 0,08 0,02 0,07 24 Semiconductors 0,16 0,11 0,13 395 Software 0,14 0,08 0,11 509
Telecommunication and Equipment 0,14 0,10 0,11 201
*** p<0.01, ** p<0.05, * p<0.1
4.5.1.3) Return on Assets by Sector
The return on assets variable shows the highest number of observations (2092) compared to the previous two. From the table below, it is possible to analyze that the standard deviation values are higher than the media values. The Computer Service, the Internet, the Semiconductors and the Software sector showed a lower mean compared to the median values. The Software sector present the highest mean and accounts for 32,5% of the total number of observations. The Computer Service sector displays the lowest mean and the highest standard deviation.
*** p<0.01, ** p<0.05, * p<0.1
Table 4: Asset Growth Statistics by Sector
Asset Growth Sector mean sd p50 N Computer Hardware 0,51 0,47 0,46 103 Computer Service 0,53 0,63 0,45 217 Internet 0,64 0,90 0,71 62 Semiconductors 0,34 0,49 0,31 246 Software 0,63 0,64 0,57 390
Telecommunication and Equipment 0,41 0,65 0,38 167
Total 0,51 0,62 0,47 1185
Table 5: Return on Assets Statistics by Sector
ROA Sector mean sd p50 N Computer Hardware 7,91 10,39 6,80 183 Computer Service 4,46 23,06 6,29 395 Internet 6,50 18,54 7,46 132 Semiconductors 6,87 13,27 8,47 406 Software 7,00 17,05 8,47 680
Telecommunication and Equipment 6,50 12,18 5,71 296
4.5.2) Research and Development ratio and Return on Assets by Country
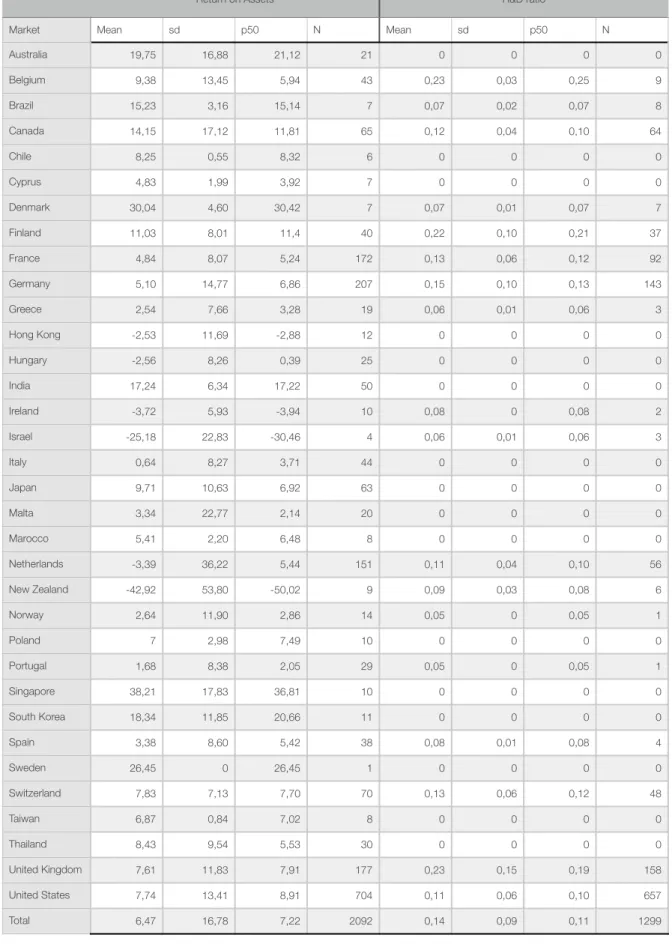
Considering the fact that this study includes companies all over the world, it is imperative to have a descriptive statistical analysis by country. The main propose of the following table is basically to evaluate the total number of observations by each country and to perceive any inconsistent value to determinate if it is pertinent to perform any kind of analysis by country. In a first approach, it is relevant to point out that in 34 countries, the United States accounts for 33,7% of the Return on Assets total observations and 50,6% of the R&D ratio observations. Secondly, there are 16 countries with no R&D ratio observation. With this results, it is essential to perform deeper analyzes. Consequently, it will be conducted an analysis between the United States technology companies and the rest of the World.
Table 6: R&D ratio and Return on Assets Statistics by Country Return on Assets R&D ratio
Market Mean sd p50 N Mean sd p50 N
Australia 19,75 16,88 21,12 21 0 0 0 0 Belgium 9,38 13,45 5,94 43 0,23 0,03 0,25 9 Brazil 15,23 3,16 15,14 7 0,07 0,02 0,07 8 Canada 14,15 17,12 11,81 65 0,12 0,04 0,10 64 Chile 8,25 0,55 8,32 6 0 0 0 0 Cyprus 4,83 1,99 3,92 7 0 0 0 0 Denmark 30,04 4,60 30,42 7 0,07 0,01 0,07 7 Finland 11,03 8,01 11,4 40 0,22 0,10 0,21 37 France 4,84 8,07 5,24 172 0,13 0,06 0,12 92 Germany 5,10 14,77 6,86 207 0,15 0,10 0,13 143 Greece 2,54 7,66 3,28 19 0,06 0,01 0,06 3 Hong Kong -2,53 11,69 -2,88 12 0 0 0 0 Hungary -2,56 8,26 0,39 25 0 0 0 0 India 17,24 6,34 17,22 50 0 0 0 0 Ireland -3,72 5,93 -3,94 10 0,08 0 0,08 2 Israel -25,18 22,83 -30,46 4 0,06 0,01 0,06 3 Italy 0,64 8,27 3,71 44 0 0 0 0 Japan 9,71 10,63 6,92 63 0 0 0 0 Malta 3,34 22,77 2,14 20 0 0 0 0 Marocco 5,41 2,20 6,48 8 0 0 0 0 Netherlands -3,39 36,22 5,44 151 0,11 0,04 0,10 56 New Zealand -42,92 53,80 -50,02 9 0,09 0,03 0,08 6 Norway 2,64 11,90 2,86 14 0,05 0 0,05 1 Poland 7 2,98 7,49 10 0 0 0 0 Portugal 1,68 8,38 2,05 29 0,05 0 0,05 1 Singapore 38,21 17,83 36,81 10 0 0 0 0 South Korea 18,34 11,85 20,66 11 0 0 0 0 Spain 3,38 8,60 5,42 38 0,08 0,01 0,08 4 Sweden 26,45 0 26,45 1 0 0 0 0 Switzerland 7,83 7,13 7,70 70 0,13 0,06 0,12 48 Taiwan 6,87 0,84 7,02 8 0 0 0 0 Thailand 8,43 9,54 5,53 30 0 0 0 0 United Kingdom 7,61 11,83 7,91 177 0,23 0,15 0,19 158 United States 7,74 13,41 8,91 704 0,11 0,06 0,10 657 Total 6,47 16,78 7,22 2092 0,14 0,09 0,11 1299
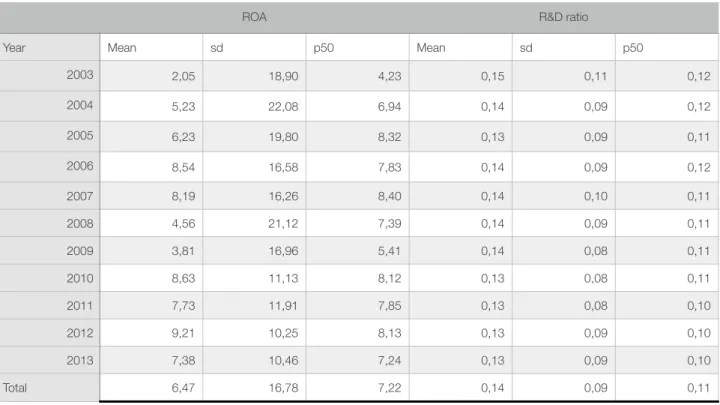
4.5.3) Research and Development ratio and Return on Assets by Years
The table 7 shows the last phase of the descriptive statistical analysis by studying the R&D ratio variable and the Return on Assets in each year from this study time period. The table displays scattered values in the return of assets mean between 2003 and 2013 with not influencing in the R&D ratio variable. Both figures displays both variables mean through time suggesting that there is no relation between them.
*** p<0.01, ** p<0.05, * p<0.1
!
Years Table 7: R&D ratio and Return on Assets Statistics by Years
ROA R&D ratio
Year Mean sd p50 Mean sd p50
2003 2,05 18,90 4,23 0,15 0,11 0,12 2004 5,23 22,08 6,94 0,14 0,09 0,12 2005 6,23 19,80 8,32 0,13 0,09 0,11 2006 8,54 16,58 7,83 0,14 0,09 0,12 2007 8,19 16,26 8,40 0,14 0,10 0,11 2008 4,56 21,12 7,39 0,14 0,09 0,11 2009 3,81 16,96 5,41 0,14 0,08 0,11 2010 8,63 11,13 8,12 0,13 0,08 0,11 2011 7,73 11,91 7,85 0,13 0,08 0,10 2012 9,21 10,25 8,13 0,13 0,09 0,10 2013 7,38 10,46 7,24 0,13 0,09 0,10 Total 6,47 16,78 7,22 0,14 0,09 0,11
Figure 1: R&D Ratio Mean
0,12 0,128 0,135 0,143 0,15 2003 2004 2005 2006 2007 2008 2009 2010 2011 2012 2013 Mean
!
years
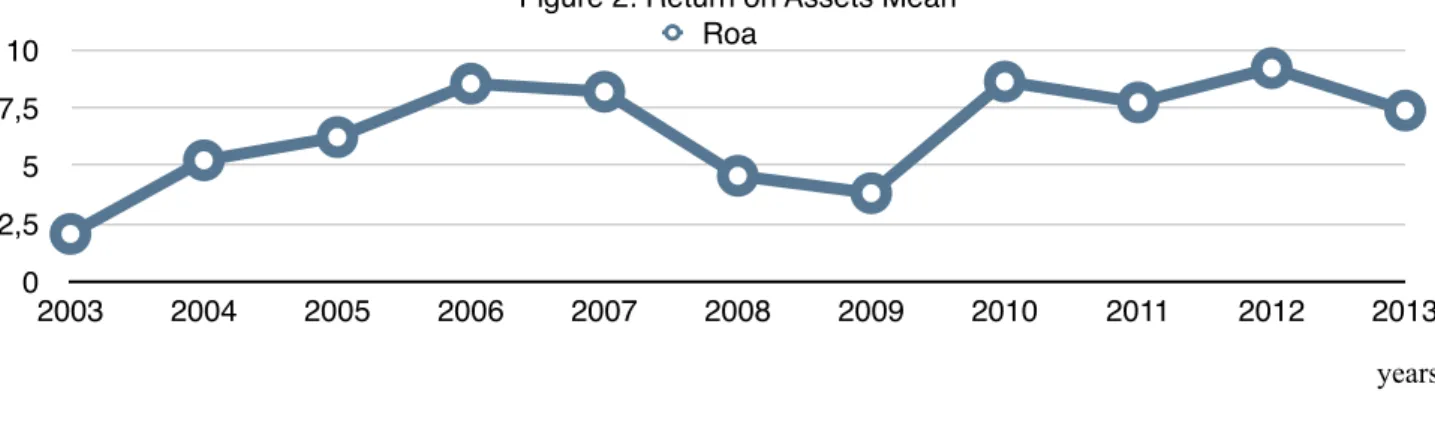
4.5.4) Sample Segmentation Main Conclusions
After conducting this first analysis there are some conclusions to make, when studying the R&D ratio variable by sector, it was pointed out the lack of observations from the Computer Services sector comparing with the fact that this sector accounts for 19% of all the technology companies. Therefore, this absence of data will have a deep influence in the overall study. In order to get accurate results, it was decided to reject this sector. Consequently, from the 346 valid technology companies it will be ignored 72 of them, which makes a total of 274 valid companies. There are some outliers in those 274 companies, which will be eliminated for the next analysis by using the command winsorize in the Stata software. When studying the R&D Ratio and the Return on Assets variables for each country, it was perceived the importance of making a comparison between the United States companies against the rest of the World companies. In the last descriptive statistical analysis, it was noticed that there was no relation between the R&D ratio and the Return on Assets when studying each by year.
Figure 2: Return on Assets Mean
0 2,5 5 7,5 10 2003 2004 2005 2006 2007 2008 2009 2010 2011 2012 2013 Roa
5) Results
5.1) Linear Regression Model
After performing a descriptive statistical analysis to the sample, it is time to conduct a linear regression to the 274 valid technology companies from the five sectors. From this point forward, the R&D ratio variable will be used as lagged variable. Considering the results that were obtained in the previous analysis, it was decided to conduct three different analyses.
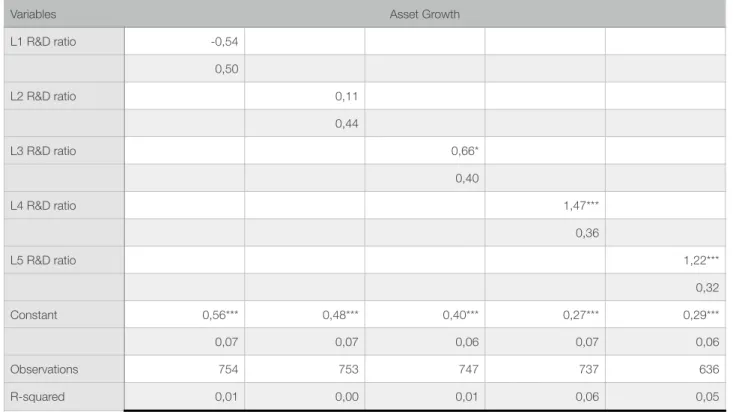
5.1.1) Research and Development Ratio and the Asset Growth by Sector
In order to understand how the investment in R&D has affected the companies asset growth, it was conducted a linear regression to study both variables. The table below displays the results between the two variables for all the technology companies. It is certain that there is a positive effect from the R&D investment into the asset growth between the second period and the last one, shown by L2, L3, L4 and L5. It is possible to verify the existence of statistical significance at the 1% level in the two highest results, L4 and L5. The highest value is displayed by the fourth lagged variable, 1,47, suggesting that the asset growth will increase by 1,47 when the L4 increases by one.
Table 8: R&D Ratio and the Asset Growth of all Technology Companies
Variables Asset Growth
L1 R&D ratio -0,54 0,50 L2 R&D ratio 0,11 0,44 L3 R&D ratio 0,66* 0,40 L4 R&D ratio 1,47*** 0,36 L5 R&D ratio 1,22*** 0,32 Constant 0,56*** 0,48*** 0,40*** 0,27*** 0,29*** 0,07 0,07 0,06 0,07 0,06 Observations 754 753 747 737 636
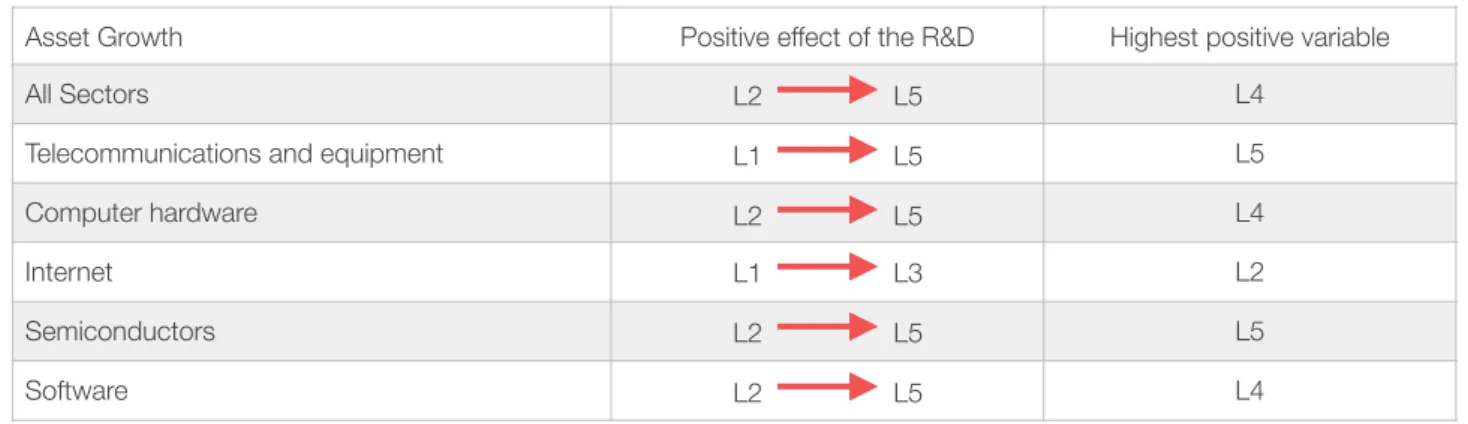
The table below summarizes the most important conclusion of each sector (appendix 1.1) by displaying the intervals where there is a positive effect between the R&D ratio and the asset growth. The table also shows the highest result of each sector so it is possible to perceive when the R&D ration has stronger effect in the asset growth.
When comparing each sector, it is evident that the Internet is the only sector with a negative effect in the last two lagged variables. It is relevant to refer that the Internet sector displays only 15 observations, accounting for 2% of the total observations, suggesting a possible absence of accuracy. All the other sectors displayed highest results between the last two periods, L4 and L5.
5.1.2) Research and Development Ratio and the Return on Assets by Sector
To measure the relation between the investment in R&D and the return on assets, it was conducted a linear regression. After performing the first analysis to the 1196 observations (appendix 1.2), it was concluded that there was a lack of statistical significance level in all the five results that suggested a possible lack of accuracy. It was also noticed a negative influence between both variables in the first two results. So, in order to achieve accurate conclusions, it was decided to conduct the study by adding a new restriction, the entire negative return on assets negative values would be ignored. With this new restriction the total of observations decreased 13,6%, from 1196 to 1034.
Table 9: R&D Ratio and the Asset Growth positive effect by Sector
Asset Growth Positive effect of the R&D Highest positive variable
All Sectors L4
Telecommunications and equipment L5
Computer hardware L4 Internet L2 Semiconductors L5 Software L4 L2 ! L5 L2 ! L5 L2 ! L5 L1 ! L3 L1 ! L5 L2 ! L5
*** p<0.01, ** p<0.05, * p<0.1
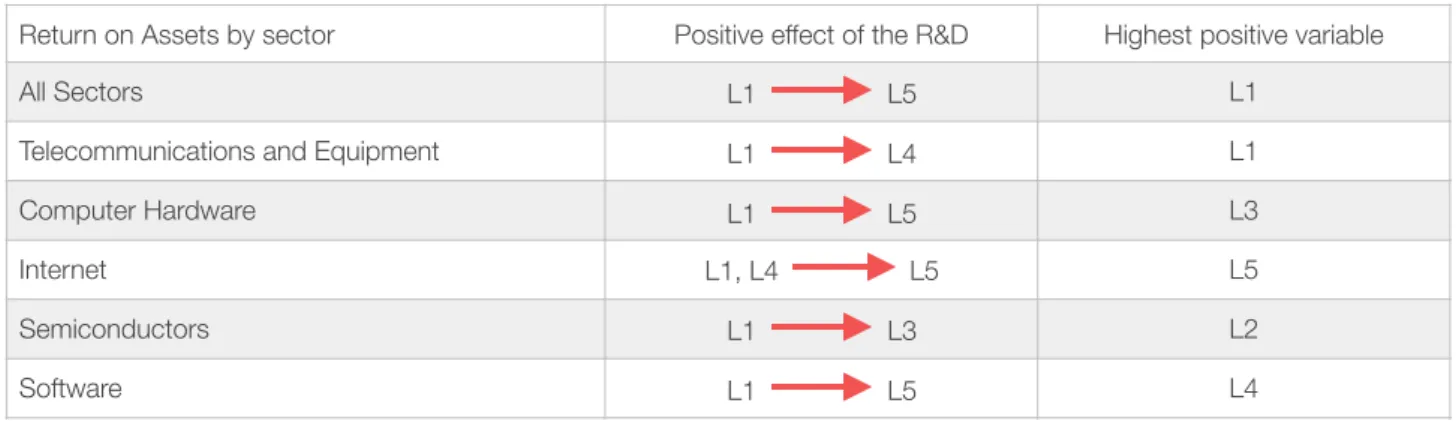
The table above shows the relation between both variables with the restriction. By adding this restriction there is a statistical significance level increase as also a result with positive effect between the variables. As in the previous analysis, the table below shows the performance of the relation between both variables for the five sectors. To achieve the table 11 results, it was essential to perform a linear regression analysis by each sector. The main goal of this investigation is to find out when the investment in R&D has higher effect in the return on assets of the technology companies. Like in the last regression, the Internet sector shows some unusual results compared to the others four sectors.
Table 10: R&D Ratio and the Return on Assets of all Technology Companies
Variables Return on Assets
L1 R&D ratio 12,18*** 4,19 L2 R&D ratio 11,02*** 4,17 L3 R&D ratio 11,44*** 4,11 L4 R&D ratio 8,10** 4,04 L5 R&D ratio 3,82 4,73 Constant 10,04*** 10,21*** 9,96*** 10,26*** 10,78*** 0,74 0,77 0,79 0,83 0,89 Observations 1034 934 825 717 607 R-squared 0,02 0,02 0,02 0,01 0,00
Table 11: R&D Ratio and the Return on Assets positive effect by sector
Return on Assets by sector Positive effect of the R&D Highest positive variable
All Sectors L1
Telecommunications and Equipment L1 Computer Hardware L1 ! L5 L3
L1 ! L5 L1 ! L4
5.1.3) Research and Development Ratio, Return on Assets and Return on Equity by Sector in Different Markets
Like in the previous analysis, the return on assets restriction is also included in this linear regression. It is also important to refer the use of the return on equity as a dependent variable. By interpreting the table below, it is possible to analyze the relation of those three variables by having a differentiation of the technology companies from the rest of the World and against those from the United States. Regarding the higher number of observations of the U.S. compared to the rest of the World, the general relation between the R&D ratio with the return on assets and the relation between the R&D ratio with the return on equity displays lower results from the U.S. companies. The displayed figures present a more perceptive way to interpret the results where it is possible to perceive the highest results in the rest of the World results with just one exception showed by the relation between the R&D ratio and the return on Assets displayed by L4. It is also relevant to mention the presence of a highest statistical significance level showed by the three first results from the relation between the R&D ratio and the return on assets.
Table12: R&D Ratio, Return on Assets and Return on Equity of all Technology Companies from the ROFW and the U.S.
Variables Rest of the World United States
L1 R&D ratio 11,58** 5,88 4,46 6,79 L1 ROE 0,11*** 0,10*** 0,12*** 0,21*** 0,21*** 0,10*** 0,09*** 0,09*** 0,08*** 0,01*** 0,03 0,03 0,02 0,05 0,05 0,02 0,02 0,02 0,02 0,02 L2 R&D ratio 11,25** 5,25 4,86 5,94 L3 R&D ratio 10,90** 4,91 4,17 6,66 L4 R&D ratio 3,94 4,98 3,92 7,02 L5 R&D ratio 1,45 -7,69 4,93 8,00 Constant 8,06*** 8,41*** 7,63*** 7,24*** 7,78*** 8,99*** 9,11*** 9,03*** 8,98*** 10,34*** 1,24 1,22 1,08 1,10 1,22 0,94 0,89 0,93 0,97 1,07
The results obtained shows two different relations that are worth to mention. When comparing the relation between both figures below, it is perceived that the U.S. results present a similar behavior between the R&D ratio relation with the return on assets and the return on equity. In both cases, the results are very uniform until L4 with a strong decrease to L5. In the contrary, the rest of the World results displayed an opposite behavior. While the relation between the R&D ratio with the return on assets decreases between the period, the R&D ratio relation with the return on equity increases through the same period.
!
!
Regarding the linear regression by sector, the table below summarizes the main results obtained from each sector (appendix 1.3). As result of the low observation number displayed by the Internet sector from the rest of the World, it was impossible to perform a linear regression in order to achieve any conclusion. Both Telecommunication and Equipment sector as also Semiconductors sector from the U.S. show a negative influence from the R&D investment into the return on assets.
Figure 3: R&D Ratio and Return on Assets
-9 -6 -3 0 3 6 9 12 L1 L2 L3 L4 L5
Rest of the World United States
Figure 4: R&D Ratio and Return on Equity
0 0,055 0,11 0,165 0,22 L1 L2 L3 L4 L5
5.2) Quantile Regression
In order to study the relation between the R&D investment and the companies growth depending on the company’s profitability, it will be conducted a quantile regression by following the same steps as in the linear regression.
5.2.1) Research and Development Ratio and the Asset Growth by Sector
The following figure shows the relation between the R&D ratio and the asset growth of all the technology companies with 754 observations (appendix 2.1). As it was mentioned before, each quantile accounts for different companies profitability. According to the results that are displayed in the figure below, companies with higher profitability have shown a better performance when investing in R&D comparing to those with lower profitability. Companies with low profitability have shown a negative relation between both variable in the first three periods.
Table 13: R&D Ratio, Return on Assets and Return on Equity positive effect by sector from the ROTW and the U.S.
Positive effect of the R&D Highest positive results Rest of the World - All Sectors L1
U.S. - All Sectors L1
ROTW - Telecommunications and Equipment L1 U.S. - Telecommunications and Equipment None None
ROTW- Computer Hardware L2
U.S. - Computer Hardware L5
ROTW - Internet -
-U.S. - Internet L3
ROTW - Semiconductors L1
U.S. - Semiconductors None None
ROTW - Software L2 U.S. - Software L1 L1 ! L4 L1 ! L5 L1 ! L3 L1 ! L4 L1 ! L4 L2 ! L3, L5 L1 ! L5 L1 ! L3 L1 ! L5
!
The table below summarizes the results obtained from each sector analysis. In general, the higher results are also achieved in a longer period of time. Companies of the Internet sector with low and high profitability and companies of the Telecommunication and Equipment sector with high profitability registered a best performance in the nearest period of time when investing in R&D. According to the results, it is more likely that companies with low profitability show lower performances from the R&D investment.
Figure 5: R&D Ratio and the Asset Growth from all Technology Companies
-1,8 -1,35 -0,9 -0,45 0 0,45 0,9 1,35 1,8 L1 L2 L3 L4 L5
Quantile 10 Quantile 50 Quantile 90
Table 14: R&D Ratio and the Asset Growth positive effect by sector
Positive effect of the
R&D 10Q Highest positive variable 10Q
Positive effect of the
R&D 50Q Highest positive variable 50Q
Positive effect of the
R&D 90Q Highest positive variable 90Q All Sectors L4 L4 L4 Telecommunications and Equipment L5 L5 L5 L1 Computer Hardware L4 L4 L4 Internet L1 L4 L1 Semiconductors L5 L4 L5 Software L4 L4 L4 L1 ! L5 L1 ! L5 L4 ! L5 L3 ! L5 L2 ! L5 L2 ! L5 L2 ! L5 L4 ! L5 L1 ! L5 L1 ! L3 L3 ! L5 L1! L3, L5 L2 ! L5 L1 ! L5 L4 ! L5 L1 ! L5 L2 ! L5
5.2.2) Research and Development Ratio and the Return on Assets by Sector
By analyzing the figure below (appendix 2.2), it is possible to perceive that in the first period of time, companies with higher profitability shown higher performances when investing in R&D, but It was also possible to verify that companies that shown average profitability displayed higher performance of R&D investments in a long period. According to the results, there are 1034 observations in this analysis where there is a positive relation between the R&D ratio and the return on assets.
!
The table below summarizes the results that were obtained by performing the quantile regression analysis. It is evident that there is a general positive effect when companies invest in R&D but, by comparing all the sectors, it is possible to notice a different behavior of the Internet sector. The low number of observations in the Internet sector is the main reason for those scattered results, because in a small sample a few observations can have influential in all the others. It is also possible to analyze that companies with high profitability from the Computer Hardware sector present the best performance from R&D investment (appendix).
Figure 6: R&D Ratio and the Return on Assets for all Technology Companies
-7,5 0 7,5 15 22,5 30 L1 L2 L3 L4 L5
5.2.3) Research and Development Ratio, Return on Assets and Return on Equity by Sector in Different Markets
The last part of this analysis was conducted by performing a quantile regression to study the technology companies of the United States, with 480 observations, and of the rest of the World, accounting for 453 total observations, separately (appendix2.3). The first figure shows the technology companies of the rest of the World analysis and the second one displays the technology U.S. companies. It is notorious that companies with average profitability of the rest of the World show better results when investing in R&D, never the less, there is a general positive effect from the R&D investment in the three quantiles. By analyzing the United States figure, it is possible to see a positive effect in companies with high profitability and a poor effect in the other two quantiles.
Table 15: R&D Ratio and the Return on Assets positive effect by sectors
Positive effect of
the R&D 10Q Highest positive variable 10Q
Positive effect of the
R&D 50Q Highest positive variable 50Q
Positive effect of the
R&D 90Q Highest positive variable 90Q All Sectors L1 L3 L1 Telecommunications and Equipment L1 L3 L1 Computer Hardware L4 L5 L2 Internet L5 L1 L5 L5 Semiconductors L4 L3 L2 Software L2 L4 L2 L1 ! L5 L1 ! L4 L1 ! L5 L1 ! L5 L1 ! L5 L1 ! L5 L1 ! L5 L1 ! L5 L3 ! L5 L1 ! L5 L1, L4 ! L5 L1 ! L5 L1 ! L5 L1 ! L4 L1 ! L5 L1 ! L3 L2 ! L5
!
!
The table below summarizes the analysis to each sector from the United States and the rest of the World separately. Once more, there is no data available to get any conclusions of the Internet sector of the rest of the World. From the results that are displayed in the appendix, each sector shows a different behavior of the R&D investment effect. Clearly, United States companies have shown higher effects as also shown the lowest results. The table below shows the positive effect of the R&D in each sector and when these effects are higher.
Figure 7: R&D Ratio, Return on Assets and Return on Equity of all Technology Companies from the ROTW -5 0 5 10 15 20 L1 L2 L3 L4 L5
Quantile 10 Quantile 50 Quantile 90
Figure 8: R&D Ratio, Return on Assets and Return on Equity of all Technology Companies in the U.S.
-25 -12,5 0 12,5 25 37,5 50 L1 L2 L3 L4 L5
Table 16: R&D Ratio, Return on Assets and Return on Equity positive effect by sector from the ROTW and the U.S.
Outside and inside
the U.S. Positive effect of the R&D 10Q Highest positive variable 10Q
Positive effect of the
R&D 50Q Highest positive variable 50Q
Positive effect of the
R&D 90Q Highest positive variable 90Q
ROTW - All Sectors L1 L2 L1
U.S. - All Sectors none none L4 L1 ROTW - Telecommunications and Equipment L1 L2 L1 U.S. - Telecommunications and Equipment
L5 none none none none
ROTW - Computer
Hardware none none L3, L5 L5 L2
U.S. - Computer Hardware L5 L1 L3 ROTW - Internet - - - -U.S. - Internet L5 L2 L5 ROTW - Semiconductors L1 L2 L1 U.S. -
Semiconductors L4 none none L1
ROTW - Software L5 L2 none none
U.S. - Software none none L4 L4 L1 L1 ! L4 L1 ! L5 L2 ! L5 L1 ! L4 L1 ! L5 L1 ! L5 L1 ! L3, L5 L1 ! L3, L5 L3 ! L5 L1 ! L2 L1 ! L5 L1 ! L4 L1 ! L5 L1 ! L2 L1 ! L5 L3 ! L5 L1 ! L3 L1 ! L5 L1 ! L5 L2 ! L4 L4 ! L5 L1 ! L5 L1 ! L2 L1 ! L5
6) Conclusions
This last chapter is going to summarize all the conclusions that were reached on the present study. It was conducted a deep analysis to the technology industry by focusing in each sector. Therefore, there are several conclusions to display. In order to be easier to explain and understand, in each part it will be shown a table to summarize the conclusions. The results that were obtained show a relation between the R&D investment and the technology companies’ growth. Despite the several studies where the authors did not found any support to conclude a link between the R&D investment and the companies’ growth, like it was mention in the literature review, this analysis will support all the other studies where it was found a relation between the R&D investment and the companies’ growth.
6.1) Relation between R&D with the asset growth, the return on assets and the return on equity.
By analyzing each sector individually, it was possible to conclude that, depending on the sector, investment in R&D will have higher or lower effect in the companies’ growth. We have used three different dependent variables to evaluate the R&D investment and consequently there are differences between them. A common conclusion that can be drawn from the relation between the R&D investment, the asset growth and the return on assets is the continued presence of the computer hardware sector as the sector with the highest results. When the analysis is directed to the relation between the R&D and the return on equity, the computer hardware sector have shown higher results in the ROTW than in the U.S, the internet sector have shown highest results in the U.S. market and the telecommunication and equipment sector accounted for the lowest scores in the ROFW. From the relation between the R&D and the asset growth, the internet sector has shown the lowest results. Through the relation between the R&D and the return on assets, the semiconductors sector displayed the lowest results. From the R&D effect into return on assets, the telecommunication and equipment sector and the internet sector have shown the lowest results in the U.S. and the ROTW markets correspondingly.
growth and return on assets, in general, internet companies with low profitability displayed higher performances when investing in R&D. For the same variables, Computer hardware companies with average and higher profitability show stronger effects when compared to all the other sectors. By performing the analysis on the relation between R&D and the return on equity, the conclusions are completely different. In the ROFW market, the software sector shows the best results in all three different profitability groups and the telecommunication and equipment sector shows the lowest results also in all three groups. When analyzing the U.S. market, the low and high profitability companies displayed the highest results in the telecommunication and equipment sector. The Internet companies with average profitability show stronger performances. The lowest results in the U.S. market were shown in all three groups by the computer hardware sector. To summarize the results that were obtained by performing the quantile regression, the table 18 displays all the conclusions from this model.
Icons Reading:
! Telecommunication and Equipment sector ! Semiconductors Sector
Table 17: Linear Regressions main conclusions Sector where there is the
highest R&D investment effect
Sector where there is the lowest R&D investment effect
Sector where there is the highest statistical significance level
Asset Growth ROA by sector ROA from the ROFW ROA from the U.S.
ROA from the ROFW VS the U.S.
ROE from the ROFW ROE from the U.S.
ROE from the ROFW VS the
U.S. INSIDE U.S.
INSIDE U.S. INSIDE U.S. INSIDE U.S. INSIDE U.S. INSIDE U.S.
Table 18: Quantile Regressions main conclusions
Asset Growth ROA by sector Sectors from the ROFW
Sectors from the U.S.
Sectors from the ROFW VS the U.S.
Sector with the highest R&D effect 10Q (ROA)
Sector with the lowest R&D effect 10Q (ROA)
Higher statistical significance 10Q (ROA)
Sector with the highest R&D effect 50Q (ROA)
Sector with the lowest R&D effect 50Q (ROA)
Higher statistical significance 50Q (ROA)
Sector with the highest R&D effect 90Q (ROA)
Sector with the lowest R&D effect 90Q (ROA)
Higher statistical significance 90Q (ROA)
Sector with the highest R&D effect of all (ROA)
Sector with the lowest R&D effect of all (ROA)
Sector with the highest R&D effect 10Q (ROE)
-
-Sector with the lowest R&D effect 10Q (ROE)
-
-Higher statistical significance 10Q (ROE)
-
-ALL EQUAL
Sector with the highest R&D effect 50Q (ROE)
-
-Sector with the lowest R&D effect 50Q (ROE)
-
-Higher statistical significance 50Q (ROE)
-
-ALL EQUAL
Sector with the highest R&D effect 90Q (ROE)
-
-Sector with the lowest R&D effect 90Q (ROE)
-
-Higher statistical significance 90Q (ROE)
-
-from the U.S. from the U.S.
90Q
90Q
from the U.S. from the U.S.
50Q
from the U.S. from the U.S.
90Q
from the U.S.
90Q
90Q
from the U.S. from the ROFW
90Q
from the ROFW from the ROFW
from the U.S.
from the U.S.
90Q from the U.S. from the U.S.
from the ROFW 90Q from the U.S.
from the ROFW