Effect of recurrent selection on the variability of
the UENF-14 popcorn population
Rodrigo Moreira Ribeiro
1*, Antônio Teixeira do Amaral Júnior
1,
Guilherme Ferreira Pena
1, Marcelo Vivas
1, Railan Nascimento
Kurosawa
1and Leandro Simões Azeredo Gonçalves
2Abstract: This study aimed to evaluate the effect of recurrent selection on the genetic variability of UENF-14 population after six selections. Two hundred and ten half-sib families were evaluated in two environments in the state of Rio de Janeiro, using incomplete randomized blocks design with treatments arranged in replication within “Sets”. There was significant effect for Families within the “Set” (F)/S, proving that there is enough genetic variability to be exploited in the popcorn breeding program of UENF. The significance for the source of variation Environment (E) shows that the environments were distinct enough to promote differences between the evaluated characteristics. It was found that for both characteristics of greatest interest, GY and PE, the magnitude of the additive variance remains with close values in advanced cycles of UENF-14 population, indicating that variability remains, with no evidence of decreases in advanced cycles. This is concluded by the longevity of UENF breeding program.
Key words:Zea mays, half-sib families, recurrent selection, genetic variability.
Crop Breeding and Applied Biotechnology 16: 123-131, 2016 Brazilian Society of Plant Breeding. Printed in Brazil http://dx.doi.org/10.1590/1984-70332016v16n2a19
ARTICLE
*Corresponding author:
E-mail: [email protected]
Received: 12 February 2015 Accepted: 14 September 2015
1 Universidade Estadual do Norte Flumin
-ense Darcy Ribeiro (UENF), Centro de Ciências e Tecnologia Agropecuária, Av. Alberto Lamego, 2000, Parque Califórnia, 28.013-602, Campos dos Goytacazes, RJ, Brazil
2 Universidade Estadual de Londrina (UEL),
Departamento de agronomia, Rodovia Celso Garcia Cid, km 380, 86.051-900, Londrina, PR, Brazil INTRODUCTION
Popcorn (Zeamays L. ssp. Mays) is a special type of maize. It has hard and
small grains, and its main characteristic is that when it is heated to approximately 180 °C, the grain internal moisture exerts pressure on the pericarp, until it breaks, forming the popcorn. This fact may multiply the grain volume up to 40 times, resulting in a tasty food (Zinsly and Machado 1987, Silva et al. 1993, Sawazaki 2001, Paes 2006). In Brazil, for popcorn culture, in 2013, it was cultivated 43,379 hectares, and it is expected to produce 171,111 tons of grains. Compared with the previous year, the planted area expanded 64.58%, and the harvested volume increased 67.39%. In 2012, 26,356, hectares were occupied with popcorn, and 102,221 million tons were harvested, according to GCEA/IBGE (2013).
recurrent selection program in 11th cycle with broad genotypic variation and with heritability estimates ranging from 33 to 73%, proving to be promising for the achievement of new selection cycles (Berilli et al. 2013). However, the success of any recurrent selection program necessarily depends on the genetic variability of the population. Genetic variability is the primary source of genetic studies and it is not possible to obtain adaptations and evolution in species without it, nor genetic improvement. Variability is generated by mutation, and it is enhanced by genetic recombination. In this context, there are several examples, which state the narrow genetic base of this special type of maize. According to Kantety et al. (1995), reduced genetic base of the culture is due to the flint form of common maize. Results obtained by Oliveira et al. (2010) corroborate this statement. The authors found narrow genetic base in this culture. In the evaluation of the genetic diversity of 34 popcorn accessions of UENF, they obtained the formation of five groups by the UPGMA method, using ISSR markers. It should be highlighted that five of seven genotypes recommended for different regions in Brazil were clustered in only one group. Thus, it is necessary to take care in order avoid genetic narrowing in breeding programs, especially in advanced generation of recurrent selection (Ribeiro et al. 2012).
In relation to recurrent selection, Vilela et al. (2008) evaluated the initial cycles (C0, C1 and C2) of UNB-2U (currently UENF-14) and found that genetic gains in the different cycles did not interfere with the genetic narrowing of the studied population. In further studies, Oliveira et al. (2010) used ISSR markers to investigate the genetic variability among C0, C1,
C2, C3 and C4 cycles of UENF-14, and concluded that C0 and C1 were more genetically distant from C2, C3 and C4, denoting
that the distinction of cycles may be attributed to the fact that the advance of cycles (C1 to C2) through S1 families provided the most significant predicted gains, favoring greater differentiation in genetic variability compared to the previous generation for the main evaluated characteristics.
Considering that the Popcorn Improvement Program of UENF started from different breeding strategies (Mass Selection for C0 cycle; Selection of Full-sib families from C0 cycle for C1 cycle; Selection of S1 families from C1 cycle for C2 cycle; Selection of half-sib families from C2 cycle for C3 cycle; and Selection of full-sib families for the other cycles), and considering the link between the different strategies, the varied responses of gain with selection - noted in the works of Oliveira et al. (2010) and Freitas et al. (2014), it is evident the doubt in relation to the genetic bottleneck in UENF-14 population after seven cycles (C0 a C6) of recurrent selection.
Thus, a condition for the longevity of the recurrent selection strategy is to combine genetic gains with the maintenance of variability in different cycles. In this context, this study aimed to investigate the effective gains and the impact on the genetic variability of UENF-14 population after seven cycles of recurrent selection of the Popcorn Breeding Program of UENF.
MATERIAL AND METHODS
Nevertheless, the different strategies adopted for selective gains made it impossible to reliably compare the genetic gains in successive cycles, generating an additional impediment to appropriate confronted analysis of the response to selection. This is because the components of dominance variance, which are intrinsic to genetic gains in structures of full-sib families, are not considered in the gains between half-sib families and S1 families.
Thus, for the evaluation of the real variability and of the gains between UENF-14 cycles, it is necessary to have populations with the same genetic structure. An option is to constitute half-sib populations with a common male tester. In this case, desirable progeny tester is constituted by the less advanced cycle (C0), so that the actual differences between the cycles are evident.
Plant Material
To obtain the half-sib families, it was used ten lines of each cycle (C0 to C6), intercalated with 10 lines of the tester cycle (C0), of UENF-14 population, so that the half-sib families were obtained from crosses of recurrent selection cycles with the tester (C0). It was used spacing of 0.20 m between plants and 0.90 m between rows, and 5.0 m rows. Three seeds were planted per hole, at a depth of 0.05 m. At 21 days after emergence, thinning was carried out, leaving one plant per hole.
from the C0 x C0 crosses, it was obtained 30 families; from the C0 x C1 crosses, 30 other families were obtained, and so on, until it reached 30 families of the C0 x C6 crosses. Afterwards, these 210 half-sib families were evaluated in trials, in Campos dos Goytacazes and in Itaocara, north and northwest regions of the state of Rio de Janeiro.
Experimental design
The design was a randomized block with replications within “Sets”. It was used three “Sets” with three replications, and each “Set” contained 73 treatments, i.e., 70 half-sib families and three controls. For the composition of each “Set”, families from each cycle were numbered from 1 to 30. In “Set” 1, families from 1 to 10 and one control were clustered and randomly selected; in “Set” two, families from 11 to 20 and one control were clustered and randomly selected; and “Set” 3, families from 21 to 30 and one control were clustered and randomly selected.
The design consisted of 2.40 m rows, spaced 0.90 m, with 13 plants spaced 0.20 m apart, with three seeds per hole, at a depth of 0.05 m. At 21 days after emergence, it was carried out thinning, leaving one plant per hole, totaling a population of 60,185 plants per hectare. Fertilization during the planting was carried out according to the soil analysis. Topdressing was carried out about 30 days after planting. Cultural treatments were carried out according to the crop’s needs (Sawazaki 2001).
The off-season plantation was carried out on April 18th, 2013, in Campos dos Goytacazes (State College of Agriculture
Anthony Sarlo), and on April 30th, 2013, in Itaocara (Experimental Station PESAGRO-RIO, in Ilha Barra do Pomba). The
experiments were again repeated in the season, and planting was carried out in Campos dos Goytacazes (State College of Agriculture Anthony Sarlo), on September 4th, 2013, and in Itaocara (Experimental Station PESAGRO-RIO, in Ilha Barra
do Pomba), on September 18th, 2013.
Evaluated characteristics
The following characteristics were evaluated: mean plant height (PH) in cm; first ear mean height (EH) in cm; grain yield (GY), in kg ha-1; mean number of days to flowering (DF); and popping expansion (PE), in mL g-1.
For mean plant height, it was measured (in cm) the distance from the ground level to the insertion of the flag leaf, just after tasseling, of six competitive plants. For the first ear mean height, it was carried out the quantification of the distance, in cm, from the ground level to the base of insertions of first ear of six competitive plants. Grain yield was determined by weighing the grain after eliminating the cob, and it was expressed in kg ha-1. The mean number of days
to flowering was measured by quantifying the period between the planting and the release of silks of 50% of plants in the rows. Popping expansion was determined in the laboratory using a 31 L, 1000W microwave oven, with 2.5 minutes popping for each plot.
Genetic x Statistical analysis
Analysis of variance of the data of the characteristics was carried out according to the statistical model Yijkl = μ + Ai + Sj + ASij + R/ ASijk + F/ Sjl + AF/ Sijl + eijkl, in which μ is the mean; Ai is the fixed effect of the ith environment; Sj is the effect of the jth “Set”; ASij is the effect of the interaction between environments and “Sets”; R/ ASijk is the effect of the kth replication within the interaction between the ith environment and the jth “Set”; F/ Sjl is the random effect of the ith family within the j-th “Set” (NID, 0, σ2
F/S; AF/ Sijl is the effect of the interaction between environments x families within the j-th “Set”; and eijkl is the experimental error (NID, 0, σ2). Based on the proposed model, data of the characteristics
were used for analysis of variance, using the SAS software (SAS 1985).
It was obtained the genetic, phenotypic and environmental components, where: σˆ 2G =QMF/S–QMR
ar is the estimator of the genotypic variance among families; σˆ 2F =QMF/S
ar is the estimator of the phenotypic variance among families; σˆ 2R = QMR
ar is the estimator of the mean residual variance; σˆ 2GA =
QM(AxF)/ S–QMR
r ,
a–1
a is the estimator of the variance of genotype x environment interaction; hˆ 2
x =
σˆ 2G
σˆ 2F =
QMF/ S–QMR
QMF/ S . 100 is the percentage heritability based on the family means; ˆI
v =
CVˆg
CVˆe is the estimator of the variation index, in which CV
variation; and CVˆe is the coefficient of experimental variation.
Genetic gain was obtained through the expression Δg = DSxh2
X0 , in which Δg = genetic gain; DS = selection differential;
h2 = narrow sense heritability; and X0= mean of the original population.
In order to evaluate the evolution of mean popping expansion and grain yield over the cycle, it was carried out regression analysis using a linear regression equation between dependent variable (X) cycles, ranging C0 x C0 to C0 x C6, popping expansion and grain yield, mean of progenies in each selection cycle, dependent variable (Y).
RESULTS AND DISCUSSION
Impact on variability
By the analysis of variance, significant differences were observed for the source of variation Environment in all the evaluated characteristics (Table 1). The significance for this source of variation shows that the environments were distinct enough to promote differences between the evaluated characteristics. In relation to the source of variation “Set”, mean squares were significant at 1% probability level for popping expansion (PE) and mean number of days to flowering (DF). Grain yield (GY), first ear mean height (EH), and mean plant height (PH) were not significant at 5% probability level. According to Rangel et al. (2011), the significance for characteristics of economic value is strong indicator of the need for using a randomized block design with arrangement of treatments within “Sets”, and the absence of such source of variation would produce changes that could result in the loss of experimental accuracy.
Regarding the Environment x “Set” interaction, there was lack of significance only for the first ear mean height (HE) (Table 1). The other characteristics were significant at 1% probability, confirming that families were randomly distributed
Table 1. Estimates of mean squares, means and percentages coefficients of experimental variation of five characteristics evaluated in 210 half-sib families of UENF-14 popcorn population
Source of variation df Mean Squares
1
GY PE PH HE DF
Environment (E) 3 324446393.5** 2698.36** 36.62** 11.76** 418.85**
Set (S) 2 143478.7 115.49** 0.006 0.002 83.7**
E x S 6 2542754.5** 50.98* 0.1** 0.016 36.09**
Replication (R)/ExS 24 3609424.1** 92.77** 0.29** 0.25** 92.0**
Families (F)/ S 207 16745569.6** 102.47** 0.07** 0.05** 27.95**
C0 27 731223.13 135.82** 0.07** 0.04** 24.52**
C1 27 1169927.3* 91.4** 0.08** 0.05** 41.2**
C2 27 955266.5 40.26** 0.08** 0.05** 21.48**
C3 27 1730843.8** 88.07** 0.04* 0.03* 21.49**
C4 27 1136925.1** 95.57** 0.07** 0.06** 20.52**
C5 27 1087569.5** 95.31** 0.09** 0.06** 20.01**
C6 27 1201874.02* 83.87** 0.08** 0.05** 17.0**
(E x F)/ S 621 865190.0** 22.44* 0.03** 0.02* 6.31
C0 81 559266.12 18.03 0.02 0.01 7.08
C1 81 652629.8 23.41 0.05** 0.02* 6.89
C2 81 1042610.3* 18.88 0.04 0.02 4.8
C3 81 605095.2 17.78 0.03 0.01 4.09
C4 81 855634.9* 19.28 0.03 0.01 5.87
C5 81 737565.3* 27.13 0.04 0.01 6.51
C6 81 508647.23 24.18 0.03 0.01 4.27
Errors 1618 615876.0 19.78 0.02 0.01 5.79
Mean 3070.05 26.43 1.75 0.99 63.1
CVe (%) 25.56 16.82 9.58 12.25 3.81
1 GY = grain yield, in kg ha-1; PE = popping expansion, in mL g-1; PH = mean plant height, in cm; and EH = first ear mean height, in cm.
in the “Sets” and that they presented phenotypic changes caused by environmental soil and climatic changes. Regarding the source of variation Families within the “Set” (F/S), it was found that all of the evaluated characteristics presented significance (p <0.01), proving that there is enough genetic variability to be exploited in the popcorn breeding program of UENF in the next cycles. The same is observed in the unfolding of the half-sib families within the “Set”, whose most characteristics presented significance at 1% probability, except for GY in the C1 and C6 cycles, which were significant at 5% probability, and the same occurred for PH and EH in the C3 cycle.
For the source of variation Environment x Families within the “Set” (EXF)/S, there was significance at 1% probability for grain yield (GY) and mean plant height (PH). Significance at 5% probability was obtained for popping expansion (PE) and first ear mean height (EH). There was lack of significance at 5% probability only for mean number of days to flowering (DF). Significance regarding (ExF)/S indicates that the evaluated families behaved distinctly in all the four evaluated environments. However, being the significance a probability question, with greater degree of freedom, there is also more sensitivity, which allows detecting significant differences. Regarding the unfolding per cycle, the “Set” of treatments in each cycle is much smaller, which reduces the ability of detecting differences, since it would require greater interaction values to detect significance. Thus, greater attention should be given to unfoldings, since they allow verifying whether it occurred or not significance of the main effects and of the interactions within each level. Thus, it was not observed significances for most characteristics in the unfoldings.
Of the evaluated characteristics, popping expansion (PE) and grain yield (GY) are of greatest concern in a popcorn breeding program, and this is the reason for further study on interactions. When observing the unfoldings for these two characteristics, it is noted that for PE there was no significance at 5% probability, and for GY, only three of the seven cycles expressed significance of 5% probability. Similar results were obtained on the seventh recurrent selection cycle with full-sib families, in which Freitas et al. (2014) identified significance of 1% probability for GY and no significance for PE.
Genetic parameters
Table 2 shows that popping expansion expressed high values for heritability and for variation index. These results are in accordance with those obtained by Pereira and Amaral Júnior (2001), who employed the Design I (Comstock and Robinson 1948) in the initial studies of UENF-14. The high heritability estimates favors the hypothesis that the characteristic is oligogenic (Alexander and Creech 1977, Zanette 1989, Pacheco et al. 1998, Coimbra et al. 2001, Pereira and Amaral Júnior 2001, Miranda et al. 2008). Except for the second cycle, in which there was reduction in the heritability estimate, there is a balance regarding the magnitude of values, confirming the predominance of additive genetic effects on the expression of the popping expansion (Scapim et al. 2002, Simon et al. 2004, Freitas Júnior et al. 2009).
In relation to yield, it is observed something similar to that observed for popping expansion. In C3 cycle, there was a recovery in heritability magnitude (65.11%) after the narrowing of C2 cycle, whose magnitude was 27.10%. In cycles C4,
C
5 and C6, heritability remained the same (45.97%, 51.94% and 45.04%, respectively). C0 cycle had the lowest heritability
value, 18.59%, although it was a high value. However, the stability of magnitudes of heritability in the superior cycles corroborate the findings of Pereira and Amaral Júnior (2001), who estimated magnitude of 44.88% for heritability in full-sib families.
Higher magnitude of heritability for PE in relation to GY was expected in the UENF-14 popcorn population, as demonstrated by Pereira and Amaral Júnior (2001). Results like these, in which estimates of heritability for popping expansion are higher when compared to yield, are confirmed by other authors in studies with other populations (Pacheco et al. 1998).
In relation to DF, PH and HE, since they present high magnitudes of heritability, genetic progress is very promising, even by means of simple breeding methods. Family means in the cycles varied for DF, from the lowest to the highest value, between 62.56 and 64.43 days. In relation to PH, family means ranged from 1.71 to 1.80 m. In relation to EH, family means ranged between 0.96 and 1.03 m. These results reaffirm the importance of the use of recurrent selection and breeding methods to obtain desirable gains in UENF-14 population.
By analyzing the additive variances for PE (Table 2), it is clearly noted when it was used S1 inbred families as a breeding strategy in UENF-14 population. This is because σ2
among the cycles, with sharp increase in the subsequent cycle, with σ2
a value equal to 24.00, keeping the value in
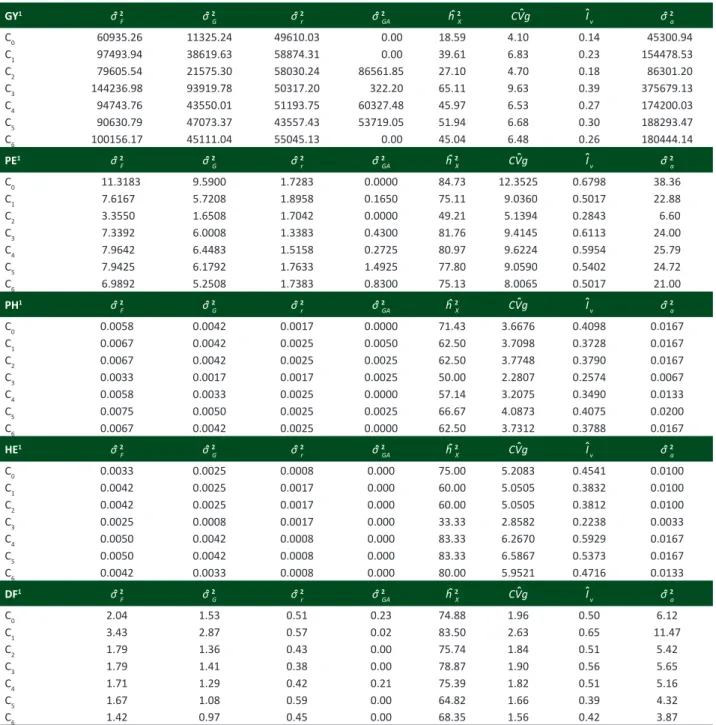
subsequent cycles, 25.79, 24.72 and 21.00, for the cycles C4, C5 and C6, respectively. With these results, it is confirmed that if there had been continuity in the use of selection strategy through inbred families (S1) for more generations, the genetic progress of UENF-14 population would have been compromised, due to the maintenance of additive variance at low levels. This is a concern for the success of a recurrent selection program, whose intention is to obtain long-term gains. Table 2. Estimates of phenotypic variance (σˆ 2F), genotypic variance (σˆ 2G); residual variance (σˆ 2r); variance of genotype x environment interaction (σˆ 2GA); heritability based on the families means (hˆ 2
X), coefficient of genetic variation (CVˆg), variation index (ˆIv), and of ad-ditive variance (σˆ 2
a) for five characteristics evaluated in 210 families of UENF-14 popcorn population
GY1 σˆ 2
F σˆ 2G σˆ 2r σˆ 2GA hˆ 2X CV
ˆg Iˆ
v σˆ
2
a C0 60935.26 11325.24 49610.03 0.00 18.59 4.10 0.14 45300.94 C1 97493.94 38619.63 58874.31 0.00 39.61 6.83 0.23 154478.53 C2 79605.54 21575.30 58030.24 86561.85 27.10 4.70 0.18 86301.20 C3 144236.98 93919.78 50317.20 322.20 65.11 9.63 0.39 375679.13 C4 94743.76 43550.01 51193.75 60327.48 45.97 6.53 0.27 174200.03 C5 90630.79 47073.37 43557.43 53719.05 51.94 6.68 0.30 188293.47 C6 100156.17 45111.04 55045.13 0.00 45.04 6.48 0.26 180444.14 PE1 σˆ 2
F σˆ 2G σˆ 2r σˆ 2GA hˆ 2X CV
ˆg Iˆ
v σˆ
2
a C0 11.3183 9.5900 1.7283 0.0000 84.73 12.3525 0.6798 38.36 C1 7.6167 5.7208 1.8958 0.1650 75.11 9.0360 0.5017 22.88 C2 3.3550 1.6508 1.7042 0.0000 49.21 5.1394 0.2843 6.60 C3 7.3392 6.0008 1.3383 0.4300 81.76 9.4145 0.6113 24.00 C4 7.9642 6.4483 1.5158 0.2725 80.97 9.6224 0.5954 25.79 C5 7.9425 6.1792 1.7633 1.4925 77.80 9.0590 0.5402 24.72 C6 6.9892 5.2508 1.7383 0.8300 75.13 8.0065 0.5017 21.00 PH1 σˆ 2
F σˆ 2G σˆ 2r σˆ 2GA hˆ 2X CV
ˆg Iˆ
v σˆ
2
a C0 0.0058 0.0042 0.0017 0.0000 71.43 3.6676 0.4098 0.0167 C1 0.0067 0.0042 0.0025 0.0050 62.50 3.7098 0.3728 0.0167 C2 0.0067 0.0042 0.0025 0.0025 62.50 3.7748 0.3790 0.0167 C3 0.0033 0.0017 0.0017 0.0025 50.00 2.2807 0.2574 0.0067 C4 0.0058 0.0033 0.0025 0.0000 57.14 3.2075 0.3490 0.0133 C5 0.0075 0.0050 0.0025 0.0025 66.67 4.0873 0.4075 0.0200 C6 0.0067 0.0042 0.0025 0.0000 62.50 3.7312 0.3788 0.0167 HE1 σˆ 2
F σˆ 2G σˆ 2r σˆ 2GA hˆ 2X CVˆg Iˆv σˆ
2
a C0 0.0033 0.0025 0.0008 0.000 75.00 5.2083 0.4541 0.0100 C1 0.0042 0.0025 0.0017 0.000 60.00 5.0505 0.3832 0.0100 C2 0.0042 0.0025 0.0017 0.000 60.00 5.0505 0.3812 0.0100 C3 0.0025 0.0008 0.0017 0.000 33.33 2.8582 0.2238 0.0033 C4 0.0050 0.0042 0.0008 0.000 83.33 6.2670 0.5929 0.0167 C5 0.0050 0.0042 0.0008 0.000 83.33 6.5867 0.5373 0.0167 C6 0.0042 0.0033 0.0008 0.000 80.00 5.9521 0.4716 0.0133 DF1 σˆ 2
F σˆ 2G σˆ 2r σˆ 2GA hˆ 2X CV
ˆg Iˆ
v σˆ
2
a
C0 2.04 1.53 0.51 0.23 74.88 1.96 0.50 6.12
C1 3.43 2.87 0.57 0.02 83.50 2.63 0.65 11.47
C2 1.79 1.36 0.43 0.00 75.74 1.84 0.51 5.42
C3 1.79 1.41 0.38 0.00 78.87 1.90 0.56 5.65
C4 1.71 1.29 0.42 0.21 75.39 1.82 0.51 5.16
C5 1.67 1.08 0.59 0.00 64.82 1.66 0.39 4.32
C6 1.42 0.97 0.45 0.00 68.35 1.56 0.42 3.87
For GY, it is observed that C2 also had the lowest σ2
a magnitude, corroborating other results. The strategy used in C2
(S1 families) resulted in the reduction of additive variance in both characteristics of greatest interest in popcorn culture (GY and PE). However, σ2
a was recovered with the recombination of families for the formation of the next cycle. This is
a fact that proved to be essential for further results in UENF-14.
According to the results obtained in this study, it appears that for the two characteristics of greatest interest, GY and PE, the magnitude of additive variance is maintained with close values in the advanced cycles of UENF-14 population, indicating that variability is maintained without evidence of decreases in advanced cycles. This is concluded by the longevity of UENF breeding program.
Genetic gain
The genetic gain for a certain characteristic expresses the advance of the next generation in relation to the original population due to selection. Thus, it is clear that the greatest gains for GY were observed in the first cycles (17.11% gain in C1, and 10.19% gain in the C2) (Table 3). Similar results were obtained by Ribeiro et al. (2012), who found percentage gain per cycle of 37.58 for C1 and of 6.03% for C2. In further cycles, genetic gains were significant for GY, except for the
C
4, in which the gain was only 0.93%. The lowest gains found in more advanced cycles are expected in a population
under selection, given the accumulation of favorable alleles in these generations.
For PE, it was observed genetic gain equal to zero for C2. This result was due to the high magnitude of C1 mean, even surpassing C4 mean. Similar result was obtained by Daros et al. (2004), who studied the genetic progress in the first recurrent selection cycle with full-sib families, and in the second cycle, with S1 families, using UENF 14 population. The authors affirm that, although genetic gains in C1 and C2 have been reported for popping expansion and grain yield,
C2 presented decrease in means of the selected families, when compared with C1. According to Vilela et al. (2008), this
reduction is probably due to inbreeding depression (S1 families).
However, in the remaining cycles, gains were promising and high, with values of 13.31%, 4.78%, 13.03% and 14.14%, for the cycles C3, C4, C5, and C6, respectively, reaffirming that PE is strong and closely influenced by additive variance. By comparing the evolution of the means obtained for PE and GY in cycles C0, C1, C2, C3, C4, C5, and C6, it is observed that there was gradual increase for both PE and GY (Table 3). This gradual increase was also found in C4 (Freitas Júnior et al. 2009), in which even with the change in the strategy of C3 with half-sib families by full-sib families in C4, gains for grain yield and popping expansion continued increasing. Similar results were observed by Santos et al. (2007), who found that with the change of the strategy of inbred families selection, carried out by Daros et al. (2002) for selection between half-sib families (Santos et al. 2007), gains for popping expansion were satisfactory, as well as the increase in grain yield.
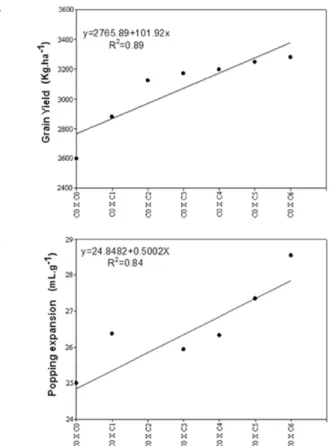
Figure 1A represents the regression line of the evolution of UENF-14 popcorn population in relation to grain yield in seven recurrent selection cycles. It was also verified that R2 estimate was high (0.89), which implies good adjustment
of the regression model. C0 cycle of the population expressed mean yield of 2,597.52 kg ha-1. On the other hand, C 6
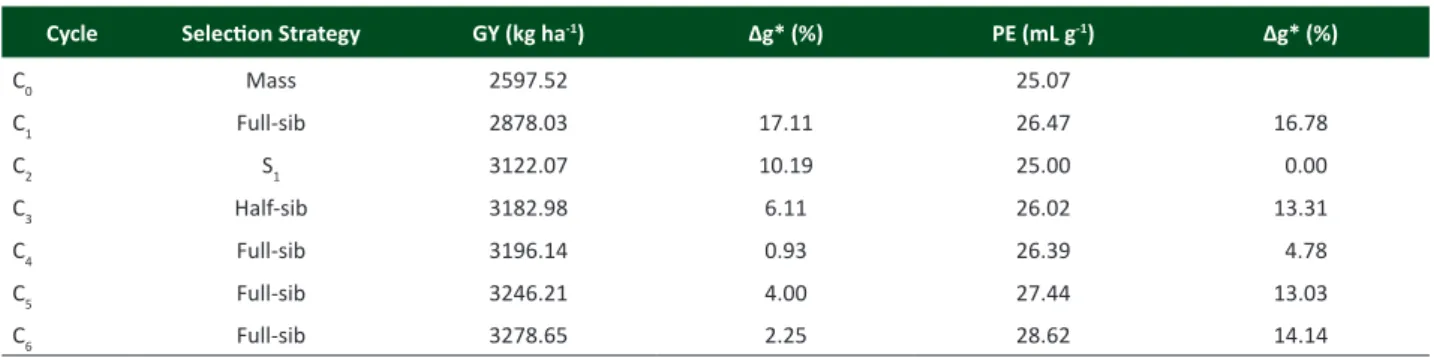
Table 3. Strategies used in the experiment and means of popping expansion (mL g-1) and of grain yield (kg ha-1) obtained for the cycles C0, C1, C2, C3, C4, C5 and C6, of UENF-14 population subjected to intrapopulation recurrent selection
Cycle Selection Strategy GY (kg ha-1) ∆g* (%) PE (mL g-1) ∆g* (%)
C0 Mass 2597.52 25.07
C1 Full-sib 2878.03 17.11 26.47 16.78
C2 S1 3122.07 10.19 25.00 0.00
C3 Half-sib 3182.98 6.11 26.02 13.31
C4 Full-sib 3196.14 0.93 26.39 4.78
C5 Full-sib 3246.21 4.00 27.44 13.03
C6 Full-sib 3278.65 2.25 28.62 14.14
presented yield of 3,278.65 kg ha-1, which represents an
increment of 26.22% in the mean grain yield in seven cycles, confirming that the breeding methods used were efficient in selection responses. Also, Figure 1A shows outstanding yield increment in the first three cycles, followed by a moderate increment from C3 cycle.
Figure 1B presents the excessive gains in UENF-14 popcorn population in relation to popping expansion (PE). It is noted that R2 was high (0.84), indicating that the equation
model for PE was also well adjusted. The same figure shows the progress in intrapopulation recurrent selection cycles, in which the base population (C0) presented popping expansion of 25.07 mL g-1. When comparing C
0 with C6, it
appears that the latter expressed PE of 28.62 mL g-1, i.e.,
there was increment of 14.16% in popping expansion in seven recurrent selection cycles, confirming the premise of the gradual increase in the frequency of favorable alleles in the base population.
C1 cycle proved to be atypical (Figure 1B), as previously
discussed, and it did not correspond to what was expected. However, cycles C2, C3, C4, C5 and C6 presented increment expected in a population subjected to recurrent selection, in which with the advancement of generations over the years, there is the accumulation of favorable alleles in the population under selection, resulting in considerable gains in the advanced cycle, when compared to the previous cycle.
Thus, it can be concluded that in relation to the characteristics of greatest economic value (GY and PE), good results have been achieved, given the good performance of
the population in successive cycles of intrapopulation recurrent selection. The maintenance of the additive variance at high magnitudes in the superior cycles in UENF-14 provides reliable information that the use of inbred S1 families in C2 as a breeding strategy did not cause genetic narrowing in the studied population, evidencing even more the promising future of the program.
ACKNOWLEDGEMENTS
The authors thank the Fundação Carlos Chagas Filho de Amparo à Pesquisa do Estado do Rio de Janeiro (FAPERJ) for the financial support.
Figure 1. Evolution of the means obtained in cycles C0, C1, C2, C3, C4, C5 and C6 for the characteristic (A) grain yield (kg ha-1) and (B) popping expansion (mL g-1).
REFERENCES
Alexander DE and Creech RG (1977) Breeding special industrial and
nutritional types. In Sprague GF and Fuccillo DA (eds) Corn and corn
improvement. American Society of Agronomy, Madison, p. 363-386. (Agronomy, 18).
Berilli APCG, Pereira MG, Trindade RS, Costa FR and Cunha KS (2013) Response to the selection in the 11th cycle of reciprocal recurrent
selection among full-sib families of maize. Acta Scientiarum 35:
435-441.
Coimbra RR, Miranda GV, Viana JMS and Cruz CD (2001) Correlações entre
caracteres na população de milho-pipoca DFT-1 Ribeirão. Revista
Ceres 48: 427-435.
Comstock RE and Robinson HF (1948) The components of genetic variance in populations of biparental progenies and their use in estimating the
average degree of dominance. Biometrics 4: 254-266.
Daros M, Amaral Júnior AT and Pereira MG (2002) Genetic gain for grain yield and popping expansion in flull-sib recurrent selection
in popcorn. Crop Breeding and Applied Biotechnology 2: 339-344.
características agronômicas em dois ciclos de seleção recorrente em
milho pipoca. Ciência Rural 34: 1389-1394.
Freitas ILJ, Amaral Júnior AT, Freitas Júnior SP, Cabral PDS, Ribeiro RM, Gonçalves LSA (2014) Genetic gains in the UENF-14 popcorn
population with recurrent selection. Genetics and Molecular
Research 13: 518-527.
Freitas Junior SP, Amaral Junior AT, Rangel RM and Viana AP (2009) Genetic
gains in popcorn by full-sib recurrent selection. Crop Breeding and
Applied Biotechnology 9: 1-7.
GCEA/IBGE (2013) Levantamento sistemático da produção agrícola.
Grupo de Coordenação de Estatísticas Agropecuárias - GCEA/IBGE, Diretoria de Pesquisas, Coordenação de Agropecuária, Levantamento Sistemático da Produção Agrícola, Rio de Janeiro, 86p.
Hallauer AR and Miranda Filho JB (1988) Quantitative genetics in maize
breeding. Iowa State University Press, Ames, 468p.
Hull FH (1945) Recurrent selection and specific combining ability in corn. Journal American Society of Agronony 37: 134-145.
Kantety RV, Zeng X, Bennetzen J and Zehr BE (1995) Assessment of
genetic diversity in dent and popcorn (Zea mays L.) inbred lines
using inter-simple sequence repeat (ISSR) amplification. Molecular
Breeding1:365-373.
Miranda GV, Souza LV, Galvão JCC, Guimarâes LJM, Melo AV and Santos IC (2008) Genetic variability and heterotic groups of Brazilian popcorn
populations. Euphytica 159: 123-132.
Oliveira EC, Amaral Júnior AT, Gonçalves LSA, Pena GF, Freitas Júnior SP, Ribeiro RM and Pereira MG (2010) Optimizing the efficiency of the touchdown technique in ISSR markers in corn (Zea mays L.). Genetics and Molecular Research 9: 835-842.
Pacheco CAP, Gama EP, Guimarães PEO, Santos MX and Ferreira AS (1998) Estimativas de parâmetros genéticos nas populações 42 e
CMS-43 de milho pipoca. Pesquisa Agropecuária Brasileira 33: 1995-2001.
Paes MCD (2006) Aspectos físicos, químicos e tecnológicos do grão
de milho. Embrapa Milho e Sorgo, Sete Lagoas, p. 1-6. (Circular Técnica 75).
Pereira MG and Amaral Júnior AT (2001) Estimation of genetic components
in popcorn based on the nested design. Crop Breeding and Applied
Biotechnology 1: 3-10.
Rangel RM, Amaral Júnior AT, Gonçalves LSA, Freitas Júnior SP and Candido LS (2011) Análise biométrica de ganhos por seleção em população
de milho pipoca de quinto ciclo de seleção recorrente. Revista de
Ciências Agronômicas 42: 473-481.
Ribeiro RM, Amaral Júnior AT, Gonçalves LSA, Candido LS, Silva TRC and Pena GF (2012) Genetic progress in the UNB-2U population of popcorn under recurrent selection in Rio de Janeiro, Brazil. Genetics and Molecular Research 11: 1417-1423.
Santos FS, Amaral Júnior AT, Freitas Júnior SP, Rangel RM and Pereira MG (2007) Predição de ganhos genéticos por índices de seleção na população de milho pipoca UNB-2U sob seleção recorrente. Bragantia 66: 389-396.
SAS (1985) SAS user’s guide: statistics. SAS Institute, New York, 958p.
Sawazaki E (2001) A cultura do milho pipoca no Brasil. O Agronômico
53: 11-13.
Scapim CA, Pacheco CAP, Tonet A, Braccini AL and Pinto RJB (2002) Análise
dialélica e heterose de populações de milho pipoca. Bragantia 61:
219-230.
Silva WJ, Vidal BC, Martins MEQ, Vargas H, Pereira AC, Zerbetto M and
Miranda LCM (1993) What makes popcorn pop. Nature 362: 417.
Simon GA, Scapim CA, Pacheco CAP, Pinto RJB, Braccini AL and Tonet A (2004) Depressão por endogamia em populações de milho pipoca. Bragantia 63: 55-62.
Vilela FO, Amaral Junior AT, Pereira MG, Scapim CA, Viana AP and Freitas Junior SPF (2008) Effect of recurrent selection on the genetic variability of the UNB-2U popcorn population using RAPD markers. Acta Scientiarum. Agronomy 30: 25-30.
Zanette VA (1989) Análise da variabilidade genética em populações de
milho pipoca (Zea mays L.): heterose da capacidade de expansão do
grão. Agronomia Sulriograndense 25: 173-181.
Zinsly JR and Machado JA (1987) Milho pipoca. In Paterniani E and Viegas
GP (eds) Melhoramento e produção de milho. Fundação Cargill,