Removal of Copper(II) and Zinc(II) Ions From
Aqueous Solution by Chemical Treatment of
Coal Fly Ash
Eleonora Sočo,* Jan Kalembkiewicz
Department of Inorganic and Analytical Chemistry, Faculty of Chemistry, Rzeszów University of Technology, 6 Powstańców Warszawy Ave., PL-959 Rzeszów, Poland * Corresponding author’s e-mail address: eleonora@prz.edu.pl
RECEIVED: April 15, 2015 REVISED: August 17, 2015 ACCEPTED: October 26, 2015
Abstract: The aim of this study was to investigate the chemical modifications of coal fly ash (CFA) treated with HNO3 or ammonium acetate (AcNH4) or NaOH or sodium diethyldithiocarbamate (NaDDTC) as an adsorbent for the removal of copper(II) and zinc(II) ions from aqueous solution. The morphology of fly ash grains before and after modification was examined via X-ray diffraction (XRD) and images of scanning electron microscope (SEM). Adsorption of copper(II) and zinc(II) ions was conducted under batch process at different duration, concentrations and temperature of the suspension. Equilibrium experiments shows that the selectivity of CFA-NaOH nanoparticles towards Cu(II) ions is greater than that of Zn(II) ions, which is related to their hydrated ionic radius and first hydrolysis equilibrium constant. The adsorption isotherms were described by Langmuir and Freundlich models. Kinetic data revealed that the adsorption fits well by the pseudo-second-order rate model with high regression coefficients. Thermodynamic parameters suggested that the immobilization Cu(II) and Zn(II) ions onto CFA-NaOH is a sponta-neous process. Results demonstrated that the treating coal fly ash with alkaline solution was a promising way to enhance Cu(II) and Zn(II) ions adsorption.
Keywords: kinetic and thermodynamic adsorption, coal fly ash, copper and zinc, scanning electron microscopy, X-ray diffraction.
INTRODUCTION
OAL fly ash is particulate material produced from the coal-fired heat and power plant. The amount of coal fly ash generated in Poland was 4.2 Gt per year, of which 52 % (2.2 Gt) was recycled while the rest was land-filled.[1] Fly ash is used partly in manufacturing of pozzolana ce-ment, filler material for reclamation of low lying areas and manufacturing of bricks.[2,3] Ash contamination poses a se-rious threat to environment. The confirmed presence and mobility of heavy metals from fly ash can cause significant environmental problems.[4–6] Contamination during dis-posal of fly ash, as well as interaction of fly ash and heavy metals in the environment is very limited.[7–9] The chemi-cal composition of fly ash - abundance of amorphous alu-minosilicate glass, which is the prevalent reactive phase, is what makes fly ash an important source material in
zeolite synthesis.[10–12] Hence, coal fly ash and its fly ash-derived zeolite can be candidate materials for heavy metals removal.[13–18]
Adsorption is probably one of the most attractive, simple and efficient processes and consequently, the com-monly used in industry, because of its simple and efficient application.[19–23] Thus, there is a growing demand to find low-cost and efficient adsorbent for the adsorption of heavy metal ions.[24–28]
The aim of the research was uptake of Cu(II) and Zn(II) ions in polluted waters by chemically-modified coal fly ash. This paper will describe the equilibrium and kinetic studies which contributed to our understanding of the properties of the new adsorbent. Importantly, the effect of pH on the adsorption process of heavy metals by CFA and CFA-modified was explored, and the key physical and chem-ical characteristics of the product are described.
Croat. Chem. Acta2015, 88(3), 267–279 DOI: 10.5562/cca2646
EXPERIMENTAL
Apparatus
The elemental composition of the adsorbent and extracts was determined by flame atomic absorption spectrometer (FAAS, model SavantAA, GBC Scientific Equipment, Aus-tralia). Non-metal (C, N, S) determination in the coal fly ash was carried out by Elemental Analyser EA 1108 (Carlo Erba, Italy). The samples named CFA and CFA-NaOH were charac-terized by x-ray diffractometer (XRD) D2 Phaser (Bruker, Germany) equipped by source of Cu-Kα radiation (λ = 0.15406 nm), employing scanning rate of 0.02° s–1 and 2Θ ranges from 5 to 65°, the operating voltage of 30 kV and current of 10 mA. Scanning electron microscope VEGA 3 (Tescan, USA) employing the mode of secondary electron emission at operating voltage of 20 kV, was employed for sample imaging. The characterization of coal fly ash sample was performed by infrared spectrometer (FT-IR, model Alpha, Bruker, Germany). FT-IR spectrum of the sample was recorded using KBr pellet method. The digestion system consist of heating unit with programmable temperature regulation (25 to 450 °C) Model DK6 (VELP Scientifica, Italy) and mineralization unit with set of reflux condensers Model TMD6 (VELP Scientifica, Italy) to modify coal fly ash. All reagents used in preparation and determination steps were of analytical and suprapure grade (Fluka, Germany and Aldrich, UK).
Preparation of the Coal Fly Ash Sample
The coal fly ash used in this study was supplied by the Rzeszów-Załęże electric power station in the south-eastern part of Poland. The studied fly ash is a residue from coal combustion using a pulverized coal firing with the furnace exit gas temperature of 1200 °C. The moisture content of the fly ash was obtained by drying a 10 – 15 g sample at 105 °C by 24 h. After drying the sample was then placed in a desiccator for a final mass measurement. The loss on igni-tion (LOI) was determined by heating a pre-weighed dry sample to 600 °C over a period of 2 h. The pH of the dis-persed adsorbent was obtained by adding 2 g of coal fly ash to 100 mL of deionization treated water. After mixing the dispersion for 15 – 20 min, its pH was then measured using a CPI-551 pH meter.
Modification of Coal Fly Ash
Modification of coal fly ash solution at a boiling tempera-ture was performed following: the fly ash was treated in a 2 mol L–1 solution of NaOH or 1 mol L–1 solution of HNO3 or 1 mol L–1 solution of AcNH4 or 1 mol L–1 solution of NaDDTC at a solution to fly ash ratio of 10:1 by weight. The sample of adsorbent mass was placed into round-bottomed flask closed reflux condenser and was put solution. Suspension of fly ash was then mixed for 6 hours at 100 °C.
After modification process adsorbent was decanted and was repeatedly distilled water bathed to obtain pH of filtrate equals pH of distilled water and dried in electric dryer at 105 °C temperature for 24 hours. All laboratory experi-ments were performed using the adsorbent as received.
Adsorption of Cu(II) and Zn(II) Ions
The adsorption experiments of Cu(II) and Zn(II) ions onto modified coal fly ash were conducted in batch method, which permits the complete evaluation of parameters that influence the process of adsorption. In this method, a series of 100 mL glass flasks were filled with 50 mL metal ion solu-tion of varying concentrasolu-tions (10 – 500 mg L–1). Then 0.5 g of primary-CFA/modified-CFA nanoparticles was added into each flask and subjected for agitation until equilibrium is at-tained. The resultant solutions were centrifuged and super-natant liquids were subjected for the determination of Cu(II) and Zn(II) ions.
The metal ion concentration was analyzed by FAAS method. The concentration of metal ions remaining in the solution was calculated by taking the difference of initial and final metal ion concentrations. The content of adsorb-ate in coal fly ash at adsorption equilibrium Cs (in mg g–1) was then obtained by mass balance equation, where C0 and
Caq(in mg L–1) are initial and equilibrium metal ion concen-trations in solution, V (in L) is the solution volume and m (in g) is the amount of dry adsorbent used.
0 aq 0 ads 0
s
C C V C V
C
m m
(1)
The effect of pH on the extent of metal ion adsorp-tion was studied by varying the pH in the range 2 – 12 for the metal ion concentration of 50 mg L–1 and all other ex-periments were conducted at pH = 9 unless and otherwise mentioned. The effect of pH on adsorption behavior was obtained by adjusting the pH of initial heavy metals solution to desired pH, using either 0.1 mol L–1 NaOH or 0.1 mol L–1 HNO3 solution.
The adsorption kinetic experiments were conducted at room temperature using the 0.5 g of dry CFA and 50 mL metal ion solution having a concentrations of 50 mg L–1 (us-ing A.R. Grade salts), and mixed at 180 rpm, us(us-ing an ELPIN-PLUS mixer. The rate of heavy metals uptake was then measured by taking samples at various time intervals for five hours.
DOI: 10.5562/cca2646 Croat. Chem. Acta2015, 88(3), 267–279
RESULTS AND DISCUSSION
Physical and Chemical Properties of
Coal Fly Ash
Composition and characteristic of coal fly ash are shown in Table 1. The major components of all fly ashes were oxides of Si and Al, and various other oxides.
Scanning electron microscopy (SEM) was employed to analyse the elemental composition of coal fly ash before and after treating with NaOH (Figure 1).
The untreated fly ash (CFA) and NaOH-treated fly ash (CFA-NaOH) had similar elements. XRD patterns of the sam-ples were presented in Figure 2. The XRD pattern of the CFA showed the presences of quartz, mullite, magnetite and hematite (Figure 2a), after alkaline treatment, the amounts of mineral in the CFA-NaOH were decreased from the CFA, as was observed in the reduction of these peak intensities (Figure 2b). We also observed the appearance of zeolites, which were NaX and sodalite.
This observation indicated the conversion of fly ash into zeolite-like material under alkaline condition. Previous studies also reported a similar observation.[29] SEM observation of the CFA showed the presence of micro-particles in the shape of smooth balls (microspheres) (Figure 3a). After treating with NaOH, the ball-shaped particles of CFA were partly transformed into smooth surface and agglomerations of various shapes with obser-vation of crystal formation, e.g. plates and rods (Figure 3b).
The particle surface of CFA-NaOH showed the trans-formation of fly ash into zeolite-like structure, as was confirmed by the XRD data of this study (Figure 2b) and was also observed by other studies.[16,29]
Table 1. Physical properties of the coal fly ash.
Determination Value Determination Value
pH 8.3 Content of nonmetals / % (mass fraction)
- carbon
- nitrogen
- sulfur
5.76 0.00 0.00 pHPZC 7.7
Bulk density, ρ / kg m–3 620
Moisture content / % (mass fraction) 1.08 Content of metals oxide / % (mass fraction)
- SiO2
- Al2O3 - Fe2O3 - K2O
- MgO
- CaO
- Na2O - SiO2/Al2O3
50.3 32.6 5.13 2.79 1.46 1.30 0.56 1.54 Loss on ignition (LOI) / % (mass fraction) 7.50
Content of combustible part / % (mass fraction) 9.9 Specific surface area / m2 g–1 39.3
Total pore volume / cm3 g–1 0.171
Average particle size / Å 28.7
Croat. Chem. Acta2015, 88(3), 267–279 DOI: 10.5562/cca2646
The Point of Zero Charge
Determination
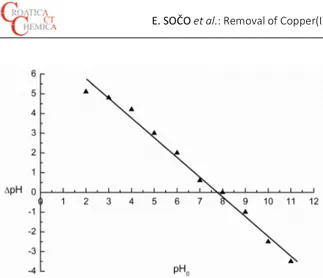
The point of zero charge (PZC) was determined using the solid addition method. Suspensions of 1 g of fly ash mass were put into contact with 50 mL of 0.1 M KNO3 solutions adjusted at different pH values. The pH0 was adjusted using
a pH meter to 2, 3, 4, 5, 6, 7, 8, 9, 10 and 11 (± 0.1 pH units) with 0.1 M HNO3 and 0.1 M NaOH. The suspensions were agitated for 24 h in a shaker at 180 rpm until an equilibrium pH value was reached. After this time each resulting final pH (pHf) was measured and the initial pH (pH0) vs. the dif-ference between the final and initial pH values (ΔpH = pHf – pH0) was plotted. The PZC was taken as the point where ΔpH = 0. The point of intersection of the resulting curve at which pH0 gave the PZC (Figure 4).
Spectroscopic Measurements (FT-IR)
Based on the spectrum obtained from the Fourier trans-form infrared, FT-IR, analysis of the coal fly ash as presented in Figure 5. In coal fly ash was observed absorption broadband in the range of 3400 cm–1, band in range of 1600 cm–1 and absorption broadband at about 1100 cm–1. Band at 3400 cm–1 appropriate of stretching vibrations νO-H. This indicates the presence of both free and hydrogen bonded OH groups on the adsorbent surface.
The spectrum was in air atmosphere recorded that's why clear-cut interpretation this band was difficulty be-cause it could derive from –OH groups, chemically bounded with surface of fly ash, and also from stretching vibrations H–O–H of water molecule adsorbed (peak at 3400 cm–1) on ash surface. The stretching of the OH groups bound to me-thyl radicals presented a very weak signal ∼2900 cm–1 for CFA. Interpretation of next band (1600 cm–1), for the sake of structure complexity is not clear but it was fund that band was from oxide compounds of fly ash derived.
These compounds influence on symmetry of con-densed aromatic rings system, therefore C=C bond is active bond in infrared, shows absorbance in the field of
Figure 3. SEM images of the coal fly ash; a) the untreated CFA and b) the CFA after treating with NaOH.
Figure 2. XRD patterns of a) the untreated CFA and b) the NaOH treated CFA.
DOI: 10.5562/cca2646 Croat. Chem. Acta2015, 88(3), 267–279 1600 cm–1. The IR spectra of the adsorbent indicated weak
and broad peaks in the region of 1600 – 1800 cm–1 corre-sponding to CO group stretching from aldehydes and ke tones. The band at 1600 cm–1 may be due to conjugated hy-drocarbon bonded carbonyl groups. The 1360 – 1420 cm–1 band in CFA may be attributed to the aromatic CH and carboxyl-carbonate structures. The most intensity of band in spectrum of coal fly ash is in the field of 1100 cm–1 can be described of stretching vibrations of bounds in C–O (νC–O) carboxylic, phenolic, etheral groups. The FT-IR spectra showed transmittance at 1100 cm–1 due to the vibration of the CO group in lactones.
Moreover, asymmetrical stretching of SiO44– or AlO45– band (broad-strong) is corresponding to the variation in frequency from 1100 to 1010 cm–1. The double ring of secondary building unit (SBU) is observed to be present in the zeolite structure in the CFA, corresponding to infrared frequency, equal to 570 cm–1. Based on the FT-IR spectrum, it can be observed that there is presence of pore openings corresponding to frequency range from 450 to 400 cm–1 in the CFA which can be attributed to the dissolution of the minerals (viz., quartz and mullite) present in the fly ash30. The surface functional groups from IR spectra, the broad bands provide information about the nature of the surface oxides. The presence of polar groups on the surface is likely to give considerable cation exchange capacity to the adsor-bents. The surface structures of carbon-oxygen (functional groups) are by far the most important structures in influencing the surface characteristics and surface behav-iour of coal fly ash.
Effect of pH
One of the most important factors that affect the adsorp-tion of metal ions is the pH of the soluadsorp-tion. The pH affects both the adsorbent and adsorbate chemistry in solution. The effect of pH on the adsorption of Cu(II) and Zn(II) ions onto CFA was studied at pH 2 – 11 for initial metal ion con-centration of 50 mg L–1. It was observed from Figure 6 that
the percentage of adsorption of metal ions increased with increase in the solution pH for two metal ions studied.
The effect of solution pH on adsorption could be ex-plained by considering the surface charge of the CFA and degree of speciation of sorbents. Understanding the sorp-tion of metal ions from aqueous solusorp-tion on oxides requires knowledge of chemistry of the oxide/water interface. At acidic pH the adsorbent surface, hydrous oxide (MOH) sur-face will be completely covered by H+ ions (MOH + H+ MOH2+). At alkaline pH, hydroxide ions react with the hy-drous oxide to produce deprotonated (MOH + OHˉ MOˉ + H2O). It is well known that both zinc and copper appears predominantly as Cu2+ and Zn2+ at pH < 5. As both the metal ions exists as Cu2+ and Zn2+ at low pH, there will be compe-tition between H+ ions for the surface sites and an electro-static repulsion between positively charged adsorbent and adsorbate. At a lower pH, the oxide surface will have posi-tive character and there exists a competition between H+ ions and M(II) ions for the active surface sites and hence,
Figure 6. Effect of solution pH on the percentage adsorption of Cu(II) and Zn(II) ions by FA.
Figure 5. FT-IR spectrum of coal fly ash.
Croat. Chem. Acta2015, 88(3), 267–279 DOI: 10.5562/cca2646 lesser adsorption was observed. With increase in the pH
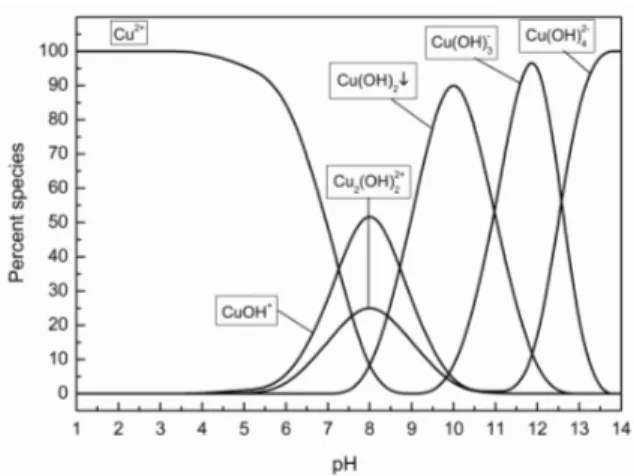
from 5 to 7 (at moderate pH) the surface deprotonation of CFA occurs and leads to the electrostatic attraction be-tween the positively charged metal ions and the partially negatively charged adsorbent surface which in turn in-creases the percentage of adsorption. The increase in the adsorption of Cu(II) and Zn(II) on CFA with increase in the solution pH is also explicable on the basis of increased dis-sociation of surface hydroxyl groups from the surface of CFA and the subsequent formation of metal ions species such as ZnOH+, Zn(OH)2, CuOH+, Cu2(OH)22+ and Cu(OH)2, at pH 7 – 10 of low solubility may contribute in part to maxi-mum percentage removal of metal ions or (Cu(OH)2, Cu(OH)3– Cu(OH)42–, Zn(OH)2, Zn(OH)3– and Zn(OH)42–) at pH > 10 (Figures 7 and 8).
It is well known that zinc and copper hydroxide has amphoteric properties. Thus it appears that as soon as the precipitation begins, adsorption process occurring at the CFA surface is overshadowed. Hence the adsorption ob-served at pH 7 – 10 is due to the combined process of ad-sorption (CuOH+, Cu2(OH)22+, ZnOH+) and precipitation (Cu(OH)2, Zn(OH)2) of metal ions or at pH > 10 is also due to the combined process of precipitation (Cu(OH)2, Zn(OH)2) and adsorption (Cu(OH)3–, Cu(OH)42–, Zn(OH)3–, Zn(OH)42–) of metal ions. It can be seen from the figure that, in case of Cu(II) ions after reaching the maximum the percentage ad-sorption decreases, this trend is attributed to the solubility of formed Cu(OH)2, Cu(OH)3– and Cu(OH)42– at higher pH. At lower pH < 3.0, the dissolution of CFA may occur and hence, the optimum pH of 9 was selected for the adsorption of Cu(II) and Zn(II) onto CFA. The equilibrium adsorption capa-city of CFA changed very little within the pH range of 5 – 7 (Figure 6) and decreased in solutions with lower pH values. At pH = 2, C∞was reduced by 30 %, compared with the value at pH = 7.
The heavy metal sorption is attributed to different mechanisms of ion-exchange processes as well as to the ad-sorption process. During the possible ion exchange process, in the beginning, metal ions may move through either the pores of CFA mass. Secondly, they may replace exchangea-ble cations, mainly surface hydroxyl groups. The replace-ment of the surface hydroxyl groups of CFA was supported by the experimental results.
It was observed that after the equilibration, the measured pH was lesser when compared to that of initial pH of the solution and hence it was concluded that the ad-sorption of Cu(II) and Zn(II) onto CFA was ion exchange re-action between the metal cations and surface protons.
Kinetics of Heavy Metal Ions
Adsorption
The influence of contact time on the amount of metal ion remains in the solution after adsorption by CFA was studied
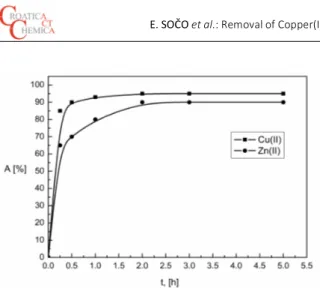
in the solution containing 50 mg L–1 of Cu(II) and Zn(II) ions in the range of 15 minutes - 5 hours at room temperature (20 ± 2 °C). It can be seen from Figure 9, that the amount of Cu(II) and Zn(II) ion remaining in the solution after adsorp-tion by CFA decreased sharply with contact time until the equilibrium was attained.
That is the process of adsorption increased with in-crease in contact time until the establishment of equilib-rium between the metal ions adsorbed on the surface of CFA and those present in the solution. After it reached the equilibrium, there were no significance changes in metal ion concentrations. The adsorption took place more rapidly at initial stages and gradually slowed down as it reaches the equilibrium state. This behavior is quite common due to the saturation of the available surface active sites. The experi-ments revealed that the equilibrium was reached within 2 hours for both the metal ions, after that saturation could be
Figure 8. Distribution of the prevalent species of zinc in aqueous solution as a function of pH. The calculations were carried out using Minteq ver. 3.0.
DOI: 10.5562/cca2646 Croat. Chem. Acta2015, 88(3), 267–279 expected to occur. However, as can be seen from figure, the
rate of adsorption of Cu(II) onto CFA surface was faster than Zn(II) ions.
In order to evaluate the kinetic mechanism for the adsorption of Cu(II) and Zn(II) ions on CFA, pseudo-first-or-der, pseudo-second-orpseudo-first-or-der, and intra-particle diffusion models were employed. A good correlation of the kinetic data explains the adsorption mechanism of the metal ions on the solid phase.
Kinetic modeling
In order to investigate the mechanism and to determine the rate controlling step of adsorption of Cu(II) and Zn(II) ions kinetic models were used. The rate constants were calcu-lated by using pseudo-first-order and pseudo-second-order kinetic models and the rate controlling step was deter-mined by intra-particle diffusion model.
PSEUDO-FIRST-ORDER RATE MODEL Pseudo-first-order model generally expressed as follows:
1
0(1 k t)
ads
C C e
(2)
0 1 0
ln(C Cads) k tlnC (3)
0 1 0
ln
ads
C k t
C C (4)
The values of k1was calculated from the slope of the linear plot of ln(C0Cads) versus t.
PSEUDO-SECOND-ORDER RATE MODEL
The values of rate constant k2can be determined from the plot of 01
ads
CC versus t by using following formula:
2
0 0
1 1
ads k t
C C C (5)
furthermore, the rate of adsorption can also be calculated
by using following formula:
2
0 2 0
1 1
ads
t t
C C k C (6)
Slope of the t/Cads versust plot was then used to obtain the rate constant k2(Figure 10). The correlation coefficients, shown in Table 2, together with the calculated kinetic data (Figure 10), indicated that [Eq. (6)] fitted the experimental data.
The values of correlation coefficients R2of pseudo-first-order model were slightly lesser than pseudo-second-order model indicating that the pseudo-second-pseudo-second-order model is better obeyed than pseudo-first-order model. As a part of the kinetic data analysis, it is essential to assess whether the observed data were affected by the diffusion of the metal ions into the pore structure of the adsorbent. The initial adsorption rate [Eq. (7)], when t 0, can becalculated by using following formula:
2 2 0
α k C (7)
The initial rate of adsorption calculated from pseudo- second-order rate equation for Cu(II) and Zn(II) were 375 and 160 mg g–1 h–1 respectively, indicating the higher adsorption rate of Cu(II) compared to Zn(II) ion on CFA.
INTRA-PARTICLE DIFFUSION MODEL
The overall reaction kinetics for the adsorption of Cu(II) and Zn(II) is a pseudo-second-order process. However, this could not highlight on the rate-limiting step. The rate-limit-ing step (slowest step of the reaction) may be either the boundary layer (film) or the intra-particle (pore) diffusion of solute on the solid surface from bulk of the solution in a batch process.
The model is given as follows:
12
s i
C k t b (15)
where Cs/ mg g–1 is the adsorption capacity at any time t
Figure 10. Intra-particle diffusion model of Cu(II) and Zn(II) ions adsorption by FA.
Croat. Chem. Acta2015, 88(3), 267–279 DOI: 10.5562/cca2646 and ki / mg g–1 h–1/2 is the intra-particle diffusion rate
con-stant and b / mg g–1 is the film thickness. Greater the value of b greater will be the effect of boundary layer on adsorp-tion process. If the rate limiting step be the intra-particle diffusion, the plot of Cadsagainst the square root of time should be a straight line and pass through the origin with
b = 0. The deviation of the plot from the linearity clearly indicates the rate-limiting step should be boundary layer (film) diffusion controlled.
Multi linear plots of Cadsversus t1/2 are presented in Figure 11. Sharp first linear portion is due to the boundary layer (film) diffusion and the second linear one is for the pore diffusion.[31] Non-linearity of the plots had indicated the multi stage adsorption of Cu(II) and Zn(II) by CFA. Extrapolation of the linear portions of the first plots back to the y-axis gave the intercept equal to the boundary layer thickness or film thickness.
It can be seen from Figure 11 that the plots possess multi-linear portions; it indicates that the two or more steps influence the sorption process. The initial portion in the plots has attributed to the boundary layer effect or external mass transfer effect. The slope and intercept of the first portion of the plots has indicated the boundary layer (film) diffusion characteristics of the adsorption while that of the second linear portion is for the pore diffusion.
The values for ki1and ki2 were computed from the slope of each plot. Table 2 gives the values of these param-eters (ki1, ki2and b). The values of ki1were about hundred times greater than that of ki2, and suggested that the boundary layer (film) diffusion had controlled the process of adsorption in the present case. The b value for Cu(II) is greater than that of Zn(II) ions, which indicates the greater effect of boundary layer on the adsorption process of Cu(II). The Elovich equation, which applies to heterogeneous surfaces,[32] was also applied in an effort to better describe the chemisorption process. It is generally expressed as:
1 1
ln ln
s
C t αβ
β β
(16)
where, α is the initial adsorption rate (in mg g–1 h–1) and β is related to the extent of surface coverage and the activa-tion energy for chemisorpactiva-tion (in g–1 mg). A plot of Cs versus
lnt gives a linear trace with a slope of 1
β and an intercept of
1ln
β αβ. Linear plots with reasonable R2 values indicate
agreement with chemisorption processes contributing sig-nificantly to adsorption rates. However, experimental data again showed better agreement with the pseudo-second-order kinetic model (Table 2).
ADSORPTION ISOTHERM MODELING
Isotherms are the equilibrium relations between the con-centration of adsorbate on the solid phase and its concen-tration in the liquid phase. From the isotherms the
maximum adsorption capacity can be obtained. These data provide information on the capacity of the sorbent or the amount required to remove a unit mass of pollutant under the system conditions. Data has been subjected to different adsorption isotherms. Langmuir and Freundlich models are the most common isotherms describing solid-liquid adsorp-tion system.
LANGMUIR ISOTHERM
Langmuir isotherm is often used to describe adsorption of solute from liquid solutions and this model assumes mono-layer adsorption onto a homogeneous surface with finite number of identical sites and expressed by the following equation: 1 L aq s L aq K C C C K C (17)
1 1 1 1
s L aq
C K C C C
(18)
Figure 11. Intra-particle diffusion model of Cu(II) and Zn(II) ions adsorption by FA.
Table 2. Kinetic model constants and correlation coefficients for the adsorption systems in the study.
Model Parameter Cu(II) Zn(II)
Pseudo-first-order
model R2 0.61 0.45
Pseudo-second-order model
R2
k2 / g mg–1 h–1
0.999 15.0 0.997 6.4 Intra-particle diffusion model R2
k1 / mg g–1 h–1/2
b / mg g–1
0.999 0.60 3.7 0.998 1.61 2.2 R2
102 k2·/ mg g–1 h–1/2
0.984 2.3 0.941 5.8 Elovich model R2
/ mg g–1 h–1
/ g–1 mg
DOI: 10.5562/cca2646 Croat. Chem. Acta2015, 88(3), 267–279 Characteristic constants of Langmuir equation; KLrelated to
affinity of the binding sites, C∞Langmuir isotherm constant can be determined from the linearized form of [Eq. (18)].
The slope and intercept of the linear plot of 1/Csversus 1/Caq gave the values of 1/C∞and 1/KLC∞, respectively. The theoretical maximum adsorption capacity C∞ correspon-ding to Langmuir constants is numerically equal to 1/C∞. As illustrated in Figure 12, the maximum adsorption capacity of CFA was reached when the equilibrium solution concen-tration was well below 1 mg L–1. This means that most of the equilibrium solution concentrations were quite low ( 0.1 mg L–1). As a result of scattering low Caq data, the Langmuir equation was best used to provide an indication of the equilibrium adsorption capacities, rather than the prediction of Cs, when it is less than the equilibrium value, even though the R2values are high.
In order to know the feasibility of the isotherm, the essential features of Langmuir model can be expressed in terms of separation factor or equilibrium parameter RL, which was defined by:
1 1
L
L aq R
a C
(19)
L L
K a
C
(20)
1 1 L
L aq R K
C C
(21)
The values of RLindicate the shapes of isotherms to be either unfavorable (RL > 1), linear (RL = 1), favorable (0 <
RL < 1) or irreversible (RL = 0). The RL values for Cu(II) and Zn(II) were calculated and plotted against the initial metal ion concentration. Figure 13 shows that, the sorption of Cu(II) on CFA increased as the initial metal ion concentration increased from 10 to 500 mg/L, indicating that adsorption is even favorable for the higher metal ion concentrations that have been investigated. The RL values
for Cu(II) were in the range 0.983 to 0.796 for the initial concentration of the metal ions (10 – 500 mg/L). This parameter (0 < RL < 1) indicated that the CFA is a suitable adsorbent for the adsorption of Cu(II) and Zn(II) ions from aqueous solutions.
Figure 13. The calculated separation factor profile for Cu(II) ion as a function of initial metal ion concentration.
Figure 12. Langmuir isotherm plot for the adsorption of Cu(II) ions onto primary FA and chemically-modified FA.
Table 3. The values of Freundlich and Langmuir adsorption parameters for Cu(II) ion.
modification Freundlich constants Langmuir constants
KF / L mg–1 1/n n R2 KF / L mg–1 C / mg g–1 R2
NaOH 7.4×10⁻³ 0.90 1.11 0.936 2.0×10⁻³ 15.2 0.995
AcNH4 3.4×10⁻³ 0.63 1.59 0.983 1.5×10⁻³ 10.3 0.988
primary FA 1.3×10⁻³ 0.76 1.32 0.985 1.0×10⁻³ 7.5 0.993
NaDDTC 1.9×10⁻³ 0.80 1.25 0.979 1.1×10⁻³ 4.7 0.998
Croat. Chem. Acta2015, 88(3), 267–279 DOI: 10.5562/cca2646 FREUNDLICH ISOTHERM MODEL
The Freundlich isotherm is an empirical equation employed to describe heterogeneous systems. The Freundlich equa-tion (22) is expressed:
1
( )n
s F
C K C (22)
The Freundlich equation predicts that the metal ion concen-tration on the sorbent will increase as long as there is an increase in the metal ion concentration while experimental results showed a plateau indicating a limiting value of the sorption.
The logarithmic form of the Freundlich model is given by the following equation:
1
logCs logCaq logKF
n
(23)
where KF and n are characteristic constants representing the adsorption capacity and adsorption intensity of the sys-tem respectively. The linear plot between logCs versus
log-Caq (Figure 14) gives a slope which is equal to the value of 1/n and the intercept is logKF. The magnitude of 1/n < 1 (n > 1) indicates the favorability of the process of adsor-ption.
The increase in the maximum adsorption capacity of the modified CFA, with an increase in the solution temper-ature, together with the shape of the isotherms described earlier, indicates that the adsorption of heavy metals by the chemically-modified CFA most likely occurs through chemi-cal rather than physichemi-cal interactions. In order to gain a bet-ter understanding of the adsorption mechanism, all isotherms were fitted by the Langmuir model.
The Langmuir and Freundlich parameters calculated from the slope and intercept of the plots are presented in Table 3.
From the data it was concluded that the experi-mental values fitted well into Langmuir isotherm model with high regression coefficients compared to Freundlich isotherm model, there by indicating the monolayer adsorp-tion of Cu(II) and Zn(II) ions onto CFA.
BRUNAUER, EMMETT AND TELLER ISOTHERM MODEL Researched multilayer adsorption on the basis of BET iso-therm. The results obtained on the adsorption of Cu(II) and Zn(II) ions were analyzed by the well-known models given by Brunauer, Emmett and Teller (Figure 15).
Selectivity of CFA/modified-CFA
To-wards Metal Ions
The adsorption parameters obtained from both the models were given in Table 3. The experimental data were fitted well with Langmuir isotherm suggesting that the metal ions
Figure 16. Arrhenius plot for the adsorption of Cu(II) and Zn(II) ions by CFA-NaOH.
Figure 15. BET isotherm plot for the adsorption of Cu(II) ion onto CFA-NaOH.
DOI: 10.5562/cca2646 Croat. Chem. Acta2015, 88(3), 267–279 sorbed from monolayer coverage on the adsorbent surface.
To lesser extent, the equilibrium data were also well de-scribed with the Freundlich model, probably due to the real heterogeneous nature of the surface sites involved in the process of adsorption. The correlation coefficient (R2) value found to be nearly equal to 0.95 indicates that both the models can be used to describe the adsorption process. The 1/n values were between 0 and 1 indicating that the ad-sorption of Cu(II) and Zn(II) onto CFA/modified-CFA was fa-vorable at the studied conditions.
The adsorption capacity of CFA/modified-CFA to-wards the studied metal ions is found to be in the order Cu(II) > Zn(II). The selectivity sequence of metal is generally explained on the basis of properties of metal ions such as ionic radii, atomic weight, softness, electronegativity and hydrolysis constants of metal cations. This selectivity se-quence may be explained on the basis of first hydrolysis constant values of these metal ions. The hydrolyzed metal ion (MOH+) is strongly sorbed than free metal cations. This can be attributed to the fact that, when the metal ions pre-sent in the solution, may diffuses to the surface sites slowly or rapidly, however, diffusion might be retarded when the metal ions are hydrated. The preferential uptake of Cu(II) ions by CFA is assigned to its lowest pH of hydrolysis. The uptake of Cu(II) ions is less compared to Cu(II) ions because of its higher pH values at which Zn(II) ion hydrolysis begins to occur. It could be explained by considering the hydrated ionic radii of cations; Cu2+ (4.19 Å) and Zn2+ (4.30 Å).
Since Cu(II) ions have the smallest hydrated ionic ra-dii, it is possible that with fewer weakly bonded water mol-ecules they tend to move faster to the potential adsorption sites on CFA/modified-CFA, when compared to the cations with higher hydrated ionic radii. The observed trend could also be accounted by considering the electronegativity also. The electronegativity of these ions can also play a role on the selectivity of adsorbent towards different heavy metal
ions. Since Cu(II) has got the highest electronegativity (1.9), it's tendency to react with the potential adsorption sites is more compared to the other metal ions studied.
Thermodynamic of Heavy Metal Ions
Adsorption
The adsorption of metal ions were studied at 4 different temperatures in the range 293 to 333 K using CFA as an ad-sorbent and at the metal ion concentration of 50 mg L–1. The experimental result showed that the adsorption capac-ity decreases with decrease in the solution temperature. The decrease in the rate of adsorption with the decrease in temperature may be attributed to the weakening of ad-sorptive forces between the active sites of the adsorbents and adsorbate species and also between the adjacent mol-ecules of the adsorbed phases. The variation in the extent of adsorption with respect to temperature has been ex-plained on the basis of thermodynamic parameters, like change in enthalpy ΔH°, change in entropy ΔS° and change in Gibb's free energy ΔG°, were determined using the fol-lowing equations (24), (25) and (26):
ln L
G RT K
Δ (24)
A
H E RT
Δ (25)
H G
S
T
Δ Δ
Δ (26)
where KLis the equilibrium constant in the Langmuir iso-therm, R is the gas law constant and T is the absolute temperature.
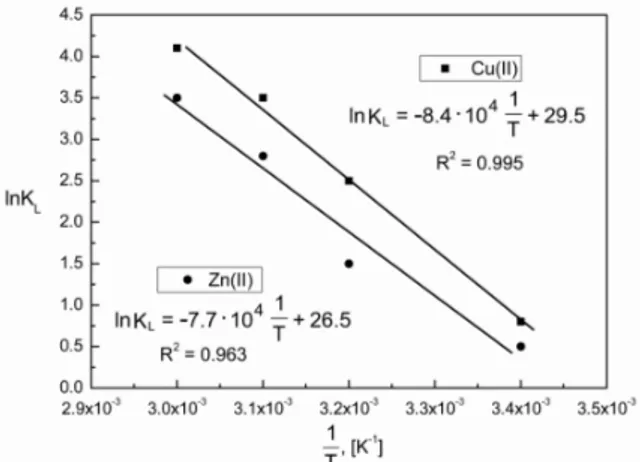
Activation energy Ea can be calculated using the equation (28) from the slope and intercept of the Arrhenius plot oflnKLversus 1/T (Figure 16).
L
a
E RT
K A e (27)
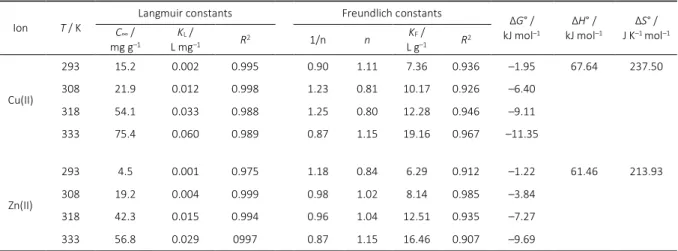
Table 4. The characteristic parameters of adsorption process of Cu(II) and Zn(II) ions on NaOH-FA.
Ion T / K
Langmuir constants Freundlich constants ΔG° /
kJ mol–1
ΔH° / kJ mol–1
ΔS° / J K–1 mol–1
C∞ / mg g–1
KL /
L mg–1 R2 1/n n
KF / L g–1 R2
Cu(II)
293 15.2 0.002 0.995 0.90 1.11 7.36 0.936 –1.95 67.64 237.50
308 21.9 0.012 0.998 1.23 0.81 10.17 0.926 –6.40
318 54.1 0.033 0.988 1.25 0.80 12.28 0.946 –9.11
333 75.4 0.060 0.989 0.87 1.15 19.16 0.967 –11.35
Zn(II)
293 4.5 0.001 0.975 1.18 0.84 6.29 0.912 –1.22 61.46 213.93
308 19.2 0.004 0.999 0.98 1.02 8.14 0.985 –3.84
318 42.3 0.015 0.994 0.96 1.04 12.51 0.935 –7.27
Croat. Chem. Acta2015, 88(3), 267–279 DOI: 10.5562/cca2646 L
1
lnK Ea C
R T
(28)
Determination of Ea for Cu(II) and Zn(II) ions was calculated to be 70.1 and 63.9 kJ mol–1, respectively.
The standard free energy change, ΔG° reflects the feasibility of the process and standard entropy change ΔS°
determines the disorderliness of the adsorption at solid- liquid interface. The values of ΔH° and ΔS° were calculated from the equation are given as 67.64 kJ mol–1 and 237.50 J K–1 mol–1 for Cu(II) ion, respectively and 61.46 kJ mol–1 and 213.93 J K–1 mol–1 for Zn(II) ion, respectively. The results are shown in Table 4.
The positive values of standard enthalpy change ΔH°
for the intervals of temperatures showed the endothermic nature of the adsorption process. The estimated values of ΔH° for the present system were greater than 20 kJ mol–1 and hence, the process may involve a spontaneous sorption mechanism as ion exchange where chemical bonds are not of strong energies. The positive value of ΔS° suggests that the process of adsorption is spontaneous and thermody-namically favorable. The values of ΔG° < 0 kJ mol–1 indicate the spontaneous nature of the process.
CONCLUSION
The chemical treatment of adsorbents has been shown here to have significant effects on the adsorption capacity of coal fly ash on heavy metals as zinc and copper. Results showed that the NaOH-treated fly ash (CFA-NaOH) is a highly effective adsorbent than the HNO3-treated fly ash (CFA-HNO3) and untreated fly ash (CFA). Synthetic zeolite was obtained at laboratory scale during hydrothermal syn-thesis of fly ash with NaOH solution. Improvement of the textural properties and percentage of adsorption indicates the possibility of the derived zeolite material application as adsorbent for removal heavy metal ions from water and wastewaters.
The pH of the solution, initial metal ion concentra-tion, time and temperature are found to play a crucial role in the process of adsorption of Cu(II) and Zn(II) ions onto the CFA/modified-CFA. The adsorption capacity and kinet-ics for the adsorbents investigated were well described by the monolayer adsorption model of the Langmuir isotherm and the chemisorption model of pseudo-second-order ki-netics. The maximum monolayer adsorption capacity of the CFA-NaOH was unaffected at 333 K, 2 hours and pH = 9, but decreased at lower pHs, and were found to be 75.4 and 56.8 mg g–1 for Cu(II) and Zn(II) ions respectively. Intra-particle diffusion model suggested that the initial adsorption rate controlled by the film diffusion, which followed by the pore diffusion or external mass transfer effects. The thermody-namic calculations suggested (heat of adsorption - ΔH°) that
the adsorption of Cu(II) and Zn(II) ions onto NaOH-CFA is an endothermic nature of the process and low values of free energy (ΔG°) indicated the spontaneity of the process. Equi-librium experiments shows that the selectivity of CFA and CFA-NaOH towards Cu(II) ions is more than that of Zn(II) ions, which is related to their hydrated ionic radius and first hydrolysis equilibrium constant. The competitive adsorp-tion experiment indicated that CFA and CFA-NaOH had a stronger affinity to Cu(II) than to Zn(II) ion. We propose that the chemical enhancement of coal fly ash by alkali treat-ment yields an effective and economically feasible material for the treatment of heavy metal-containing effluents.
Acknowledgment. The authors are grateful to the Laboratory of Spectrometry and Laboratory of Scanning Microscopy for providing the laboratory support and facilities.
X-ray analysis was made in the Laboratory of Spec-trometry, Faculty of Chemistry, Rzeszów University of Tech-nology, 6 Powstanców Warszawy Ave., 35-959 Rzeszów, Poland and was financed from DS budget.
SEM-EDS analysis was made in the Laboratory of Scanning Microscopy, Faculty of Mechanical Engineering and Aeronautics, Department of Casting and Welding, Rzeszów University of Technology, 6 Powstanców Warszawy Ave., 35-959 Rzeszów, Poland.
REFERENCES
[1] Statistical yearbook 2010. Condition and environmental protection, Warsaw (Poland), 2010.
[2] M. Ahmaruzzaman, Prog. Energ. Combust. 2010, 36, 327.
[3] F. Canpolat, K. Yilmaz, M. M. Kose, M. Sumer, M. A. Yurdusev, Cement Concrete Res.2004, 34, 731. [4] E. Sočo, J. Kalembkiewicz, J. Hazard. Mater.2007,
145, 482.
[5] F. Jiao, N. Wijaya, L. Zhang, and Y. Ninomiya, R. Hocking,
Environ. Sci. Technol.2001, 45, 6640.
[6] V. V. Seredin, R. B. Finkelman, Int. J. Coal Geol.2008,
76, 253.
[7] W. Berg, H. J. Feuerborn, Coal combustion products in Europe trends and developments, in: Proceedings of World of Coal Ash Conference. University of Kentucky, Lexington, 2007.
[8] O. E. Manz, Fuel1997, 76, 691.
[9] L. Ruhl, A. Vengosh, G. S. Dwyer, H. Hsu-Kim, A. Deonarine, Environ. Sci. Technol.2010, 44, 9272. [10] C. An, G. Huang. Environ. Sci. Technol. 2012, 46,
12742.
[11] A. Derkowski, W. Franus, E. Beran, A. Czímerová,
Powder Technol.2006, 166, 47.
DOI: 10.5562/cca2646 Croat. Chem. Acta2015, 88(3), 267–279 [13] M. Nascimento, P. S. Moreira Soares, V. P. de Souza,
Fuel2009, 88, 1714.
[14] R. Juan, S. Hernandez, X. Querol, J. M. Andres, N. Moreno, J. Chem. Technol. Biot.2002, 77, 299. [15] A. Moutsatsou, E. Stamatakis, K. Hatzizotzia, V.
Protonotarios, Fuel2006, 85, 657.
[16] P. R. Penilla, A. G. Bustos, S. G. Elizalde, Fuel2006,
85, 823.
[17] X. Queroll, N. Moreno, J. C. Umana, A. Alastuey, E. Hernandez, A. Lopez-Soler, F. Plana, Int. J. Coal Geol.
2002, 50, 413.
[18] H. Tanaka, Y. Sakai, R. Hino, Mater. Res. Bull.2002,
37, 1873.
[19] K. Bedoui, I. Abbes Bekri, E. Srasra, Desalination
2008, 223, 269.
[20] R. Chitrakar, S. Tezuka, A. Sonoda, K. Sakane, K. Ooi, T. Hirotsu, J. Colloid Interface Sci.2005, 290, 45. [21] T. R. Ferreiraa, C. B. Lopesb, P. F. Litoa, M. Oterob, Z.
Lina, J. Rochaa, E. Pereirab, C. M. Silvaa, A. Duarteb,
Chem. Eng. J.2009, 147, 173.
[22] M. Jiang, X. Jin, X. Lu, Z. Chen, Desalination2010, 252, 33.
[23] G. Rangel-Porras, J. B. Garcia-Magno, M. P. Gonzalez-Munoz, Desalination 2010, 262, 1. [24] S. M.Maliyekkal, Anshup, K. R. Antony, T. Pradeep,
Sci. Total Environ.2010, 408, 2273.
[25] D. H. K. Reddya, K. Seshaiaha, A. V. R. Reddy, M. Madhava Rao, M. C. Wang, J. Hazard. Mater.2010,
174, 831.
[26] L. Zhenga, Z. Danga, X. Yi, H. Zhanga, J. Hazard. Mater.2010, 176, 650.
[27] S. Debnath, U. C. Ghosh, Chem. Eng. J.2009, 152, 480.
[28] E. Pehlivan, S. Cetin, B.H. Yank, J. Hazard. Mater.
2006, 135, 193.
[29] Z. Sarbak, M. Kramer-Wachowiak, Powder Technol.
2002, 123, 53.
[30] N. Kantiranis, A. Filippidis, T. Mouhtaris, K. M. Paraskevopoulos, T. Zorba, C. Squires, D. Charistos,
Fuel2006, 85, 360.
[31] S. J. Allen, G. Mckay and K. Y. Khader, Environ. Pollut.
1989, 50, 39.
[32] S. H. Chien, and W. R. Clayton, Soil Sci. Soc. Am. J.