Universidade Nova de Lisboa
Dissertation, presented as part of the requirements for the degree of Doctor of Philosophy in Economics
Corporate Taxation: Evasion, Incentives, and the Shadow
Economy
Risa Marie Pavia, Student Number 3
A dissertation carried out on the PhD in Economics, under the supervision of Professors Susana Peralta (Nova SBE) and Jean Hindriks (Université catholique de Louvain).
Abstract
In this thesis I examine two elements of firm behavior with respect to taxation: efforts to reduce tax liability, and responses to incentives in the tax code. In the first and second chapters I analyze how the tax and regulatory environment affect firm incentives to engage in tax evasion and avoidance. In the third and fourth, I examine the effectiveness of a tax credit in Portugal intended to stimulate business investment. The thesis advances our knowledge of how firms react to government intervention, with important implications for policy design.
Forthcoming.
Introduction 1
1 Tax Evasion by Portuguese Firms: A Bunching Analysis 5
1.1 Introduction . . . 5
1.2 Model . . . 9
1.2.1 Exogenous shock to the cost of evasion in the formal market . . . . 15
1.3 Identification Strategy . . . 16
1.3.1 Natural Experiment: Shock to Evasion Costs in Portugal . . . 20
1.4 Data . . . 21
1.5 Results . . . 26
1.5.1 Foreign-owned Firms . . . 29
1.5.2 Micro domestic firms . . . 31
1.6 Conclusions . . . 35
2 Firms in the Shadow Economy: A Survey 37 2.1 Introduction . . . 37
2.2 Defining the shadow economy . . . 39
2.3 Measurement . . . 41
2.3.1 Indirect Methods . . . 42
2.3.2 Direct . . . 45
2.4 Key Insights: characterizing the shadow economy and informal firms. . . . 46
2.6 Conclusions . . . 52
3 Effects of a Temporary Investment Tax Credit in a Periphery Eurozone Country 55 3.1 Introduction . . . 55 3.2 Institutional Context . . . 59 3.3 Data . . . 63 3.4 Identification Strategy . . . 67 3.5 Results . . . 69 3.6 Conclusions . . . 78
4 Can tax credits raise investment and employment? An empirical assessment in a crisis-hit country 81 4.1 Introduction . . . 81
4.2 The Portuguese Investment Tax Credit . . . 86
4.3 Data and Identification Strategy . . . 88
4.3.1 Matching estimations . . . 95 4.4 Results . . . 99 4.5 Conclusions . . . 100 References 103 A Appendix Ch. 1 115 B Appendix Ch. 2 125 C Appendix Ch. 3 127 D Appendix Ch. 4 141
The efficient design of tax systems presents a constant challenge to governments around the world. They must set tax rates at a level to ensure adequate revenues without discouraging economic activity, and choose enforcement strategies that improve compliance at a reasonable cost. At the same time, governments use the tax system to achieve broader economic goals by providing incentives for certain behavior, such as savings or investment. This thesis investigates two elements affecting policy design: firms’ tax evasion strategies and their response to tax credits. I explore these issues using data from Portugal, a country that provides an interesting case study through measures taken to strengthen the economy and public institutions in response to the downturn of recent years.
In Chapter 1 I examine a tax planning strategy that has until recently been little studied: the mis-reporting of zero profits. I show that the phenomenon is related to the tax environment, using a unique identification strategy exploiting a reform in Portugal that creates an exogenous shock to the cost of tax evasion in certain sectors of economic activity.
A difference-in-differences estimation of the rate of excess bunching at zero profits shows that some firms in targeted sectors reduce their bunching post-reform, providing support for the consensus in the literature that this behavior is related to tax evasion. To further investigate heterogeneous effects, I analyze two subgroups of firms with different alternative options: foreign-owned and micro domestic firms.
Foreign-owned firms have a higher tax-planning capacity and the option of minimizing their global tax bill through profit shifting. I find that the rate of bunching of these firms is higher than the average in treated sectors and decreases more strongly after the reform,
with some indication of a difference in their mis-reporting strategies. Although the number of firms in the sample is small, the results support the findings of other studies that the reporting of zero profits by foreign-owned firms is related to tax evasion and avoidance.
Micro domestic firms, on the other hand, have less capacity to mis-report profits but the additional option of operating on the informal market, where they pay no taxes. These firms have received little attention in the literature on bunching at zero. I find that the rate of bunching for this subset is less affected by the reform, lending support to the hypothesis that the zero profits strategy is less relevant in their tax planning. A higher rate of exit for these firms in treated sectors post-reform suggests that the option of operating informally reduces the incentive to bunch at zero.
In Chapter 2, I provide context for the incentives of these small firms with an ex-amination of the economic literature on the shadow economy. I give an overview of how researchers have approached the problem of studying a phenomenon that cannot be directly observed, and what information this has yielded regarding the nature of the shadow economy and informal firms.
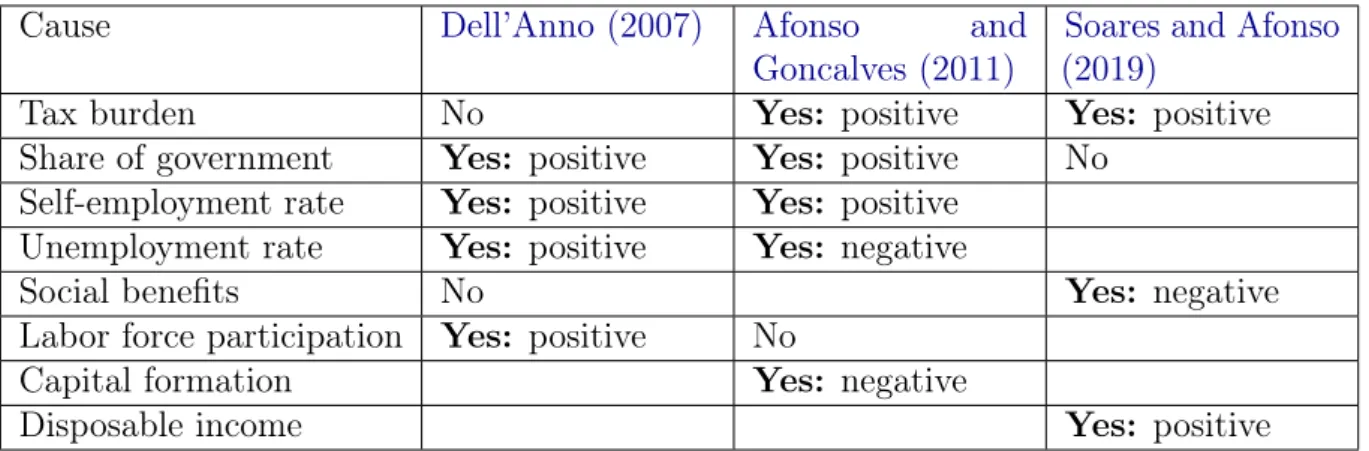
I focus in particular on the relevant results for Portugal. Although the literature lacks a clear consensus on the structural causes or size of the shadow economy, some important elements emerge. First, social systems and labor market dynamics play an important role in determining the size of the shadow economy. A high rate of self-employment appears to be particularly relevant, as in other Southern European countries such as Italy and Greece. Additionally, results from the literature show that the Portuguese shadow economy is sizable and growing, representing 16-39% of GDP.
An important general conclusion from studies of the shadow economy is the contribution of strong public institutions to limiting its size. Where firms have stronger incentives to operate formally, the informal market loses its relative appeal. Chapters3and4investigate a program in Portugal that provides one such incentive: tax credits for investment. The
In Chapter3, I use a dataset of firms’ administrative accounting records to test whether the reform led to increased investment and employment. I employ a difference-in-differences estimation based on sectoral and regional variation in eligibility for the tax credit. The results show significant positive effects on investment of the regional targeting, with some indication that firms shifted investment from non-eligible to eligible types.
Further investigation using a more detailed dataset with information on firm take-up, however, shows that the sectoral and regional eligibility are not binding, suggesting that these results were driven by specificities of the small set of control regions rather than a causal effect of the program. In Chapter 4, the enriched data is used in a matching estimation to establish a positive effect of the program on investment, employment, and growth in other key indicators of firm performance. The findings suggest that the program represents an effective type of stimulus that can be applied in other countries.
This thesis contributes important insights for the evaluation of public policy aimed at changing firm behavior. The results for Portugal provide valuable empirical evidence for the effectiveness of programs to reduce tax evasion and stimulate private investment, and highlight trends to be tested in other settings.
Tax Evasion by Portuguese Firms:
A Bunching Analysis
1.1
Introduction
Tax evasion and avoidance by firms have long presented a challenge to governments around the world. Tax authorities seek to to detect and deter mis-reporting, while firms always seem to find new strategies to circumvent them. In this paper, I investigate a phenomenon that has until recently attracted little attention: the mis-reporting of zero profits.
Firms have an incentive to report zero profits to avoid paying taxes while remaining in the formal market, where they can benefit from social security systems and access to credit. Zero is also an important point in most tax schedules just before the marginal tax rate increases by several percentage points. Discontinuities of this magnitude have been shown in the literature on evasion to induce bunching in the distribution of taxable income (see e.g. Chetty et al. (2011); Saez (2010); Kleven and Waseem (2013)).
Unlike at other points in the distribution, however, it is difficult to convincingly demonstrate that a high rate of firms reporting zero profits can be attributed to tax evasion. True profit and loss may be such that taxable income is close to zero for many firms, particularly in countries where small firms predominate or where there is a high rate of turnover in firm entry and exit. Firms may also mis-report zero profits for other
reasons, such as inter-temporal shifting of profits across fiscal years to maintain a record of consistent profitability (Burgstahler and Dichev, 1997). Additionally, in perfectly competitive markets profits should converge to zero in the long run.
In this paper I develop a unique identification strategy to isolate the evasion-related component of bunching at zero, using the exogenous variation provided by a reform in Portugal that increased the risk of detection in certain sectors of economic activity. I conduct a difference-in-differences analysis of the rate of bunching at zero before and after the reform, finding a relative decrease for firms in targeted sectors. The result suggests that mis-reporting of zero profits is indeed affected by the tax environment, providing confirmation that firms use this channel to evade.
I further investigate the effects for two subsets of firms to see whether differences in the availability of alternative tax planning strategies change the incentives to evade. I find that the rate of bunching by foreign-owned firms in treated sectors is higher than the average and is strongly affected by the reform, implying that they rely more heavily on this channel. I also test the results for micro domestic firms, which have been largely left out of the literature on bunching at zero. The rate of bunching by these firms is less affected by the reform, which suggests that it is less relevant for them as a channel of evasion. I further show that in treated sectors these micro firms are more likely to exit the formal economy, providing some support for the hypothesis that the option of operating informally reduces the incentive to bunch at zero.
This paper contributes to the literature on the mis-reporting of zero profits as a tax planning strategy, which has until recently been largely neglected – in part because many papers regress a logarithmic transformation of profits on the tax rate, implicitly excluding non-positive profits. Where the phenomenon has been studied, it has focused almost exclusively on the subsidiaries of large multinational corporations, which are subject to intense media scrutiny for their aggressive tax planning but are not the only firms with an
construct a dummy variable taking a value of one when firms report zero or near-zero profits, and regress it on the tax rate faced by foreign affiliates, with country-level fixed effects by headquarters location. They also test a specification with additional measures of governance and development. The authors find that a ten percentage point increase in the affiliate-country tax rate increases the likelihood of reporting zero profits by four percentage points in Eastern Europe and 1.5 percentage points in Western Europe. Their approach has the advantage of needing little additional financial information on firms and no parametric assumptions on production or profits. However, it lacks a convincing causal effect, with a lack of differentiation between the tax rate and other institutional factors affecting firm profitability.
Habu (2017) advances the literature on zero-profit reporting with a different approach. The author uses propensity score matching to test for profit shifting, comparing the reporting of zero profits by subsidiaries of multinational corporations with their matched domestic counterparts. Using a panel dataset of tax records, the author finds that 60% of UK-based subsidiaries of MNCs report zero profits in a given year, more than twice the rate among comparable domestic firms. This effect explains a large part of the observed aggregate difference in taxable profits between multinational and domestic firms. The use of propensity score matching allows her to control for some observable drivers of zero-profit reporting – year, total assets, and sector – to isolate the effect of foreign ownership.
Although the analysis demonstrates that foreign-owned firms systematically report zero profits at a higher rate, it lacks support for the hypothesis that tax evasion itself drives this difference. The validity of this approach rests on the strong assumption that the observable characteristics used in the matching fully capture the determinants of zero-profit reporting. Given that the phenomenon has as yet received little attention in the literature, not enough is known about the mechanism for this assumption to be fully credible. Differences in leverage are suggestive of internal debt transfer as a profit shifting mechanism, but explain at most 40% of the difference. Additionally, while the author focuses on various channels used by multinational corporations that could explain the
higher rate of zero-profit reporting, the behavior of domestic firms is not addressed. The paper of Lediga, Riedel, and Strohmaier (2019) provides evidence that domestic firms also have incentives to report zero profits. Using data on South African firms from 2009 to 2016, the authors find significant bunching at zero profits consistent with an elasticity of taxable income of 0.79-1.22 at that threshold. With the exception of the work of this paper, the literature on bunching at zero has focused on developed economies. As a result, little to no mention is made of the shadow economy as an alternative vehicle for tax evasion. Small domestic firms in many countries, however, operate informally when the tax or regulatory environment makes it more profitable for them to do so.
Waseem (2018) in his paper on firms in Pakistan shows that an increase in the tax rate for certain types of firms induces many firms to exit to informality, providing the first micro-based study of this margin. The reform was implemented retroactively, allowing the author to separate the margin on the real and reporting responses. The response is large: 41% of firms of the targeted type exit in the first year of the reform. The results provide compelling evidence that changes in the tax environment can change the marginal choice of firms to operate in the formal economy.
Domestic firms that are likely to report zero profits, namely those with levels of profit low enough that they can plausibly manipulate their taxable income to that threshold, are also those with the most realistic alternative in the shadow economy. Without accounting for this, measures of profit shifting derived from comparison of zero-profit reporting by multinational and domestic firms are likely to overestimate its magnitude. Although the shadow economy is much smaller in developed than developing economies it is still very much present, accounting for as much as 10-20% percent of GDP on average and 16-39% in Portugal (Schneider and Enste, 2013; World Bank, 2019; Missiou and Psychoyios, 2017; Soares and Afonso, 2019;Schneider, 2016; Dell’Anno, 2007;Bovi, 2003; Schneider, Raczkowski, and Mróz, 2015; Lacko, 1999; Afonso and Goncalves, 2011).
tax enforcement penalties change the incentives for different tax planning strategies. I use data from Portugal, which presents a unique case study of efforts to combat tax evasion and avoidance as a result of the reforms implemented during its economic assistance program from 2011-2014 (European Commission, Directorate-General for Economic and Financial Affairs, 2011). Additionally, Portugal is a small but developed economy characterized by the presence of both an informal economy and foreign investment, allowing for the study of policies aimed at reducing tax evasion both by domestic firms and multinationals engaging in profit shifting. Furthermore, the natural experiment provided by the Portuguese reform allows for identification of a causal effect, providing support both for the efficacy of such enforcement strategies and the prevailing consensus in the literature that bunching at zero profits is related to tax evasion.
The remainder of the paper is organized as follows. I lay out the theoretical framework and identification strategy in Sections 1.2and 1.3. In section 1.3.1 I present the particu-larities of the corporate tax system in Portugal, including the natural experiment which I use to test for evasion around zero profits, and I describe the data I use in Section 1.4. Finally, I present my results and conclusions in Sections 1.5 and 1.6.
1.2
Model
To explain firm motivations for bunching at zero I follow the model of Best et al. (2015), where the firm chooses its optimal levels of production and tax evasion. Where Best et al. (2015) examine tax evasion through cost mis-reporting, I model evasion through manipulation of reported revenue, with a convex and differentiable cost of mis-reporting that depends on the magnitude of the difference between actual and reported revenue.1 This cost is assumed to be monetary and non-tax deductible. Such mis-reporting can be conducted through tax evasion – reduction of the tax bill through illegal means – or tax avoidance, where firms take advantage of features of the tax code to legally reduce their
1The results ofBest et al. (2015)are equivalent across both channels of evasion. I therefore choose
tax liability.
I extend the model by incorporating two additional tax planning strategies: mis-reporting zero profits, and operating informally. I define the informal market or shadow economy as that part of legal economic activity that is mis- or under-reported by firms in an illegal way, leading to a corresponding reduction in tax revenue from what the government would expect to collect with perfect compliance.
When a firm i exists entirely in the shadow economy, I say that it is a ghost, after the terminology used for example by Cowell and Gordon (1995). Its after-tax profit in a given year is given by:
˜
Πsi(y) = R(y) − αiC(y) − βs (1.1) where y is the output level. R(y) is total revenue as a linear function of price and output, assuming for simplicity that market conditions are the same and therefore all firms face the same price.2 C(y) represents total costs, which are strictly convex and differentiable.
The fixed cost of underground business activity is sector-specific, and measured by βs. This allows for the fact that operating without detection by tax authorities is much easier for firms in some sectors, such as household services, than in others, such as banking. I assume that only domestic firms operate as ghosts.3
Each firm also has a cost penalty given by αi. If αi = 1, the firm faces the baseline market cost of production for all firms. As αi increases above one, i.e. as the firm becomes less efficient, the impact of costs on the profit function increases and profit declines. The firm chooses the level of activity that maximizes equation 1.1, which satisfies:
R0(yi∗) C0(y∗
i)
= αi (1.2)
Each firm also faces a fixed cost k of entry into the market, which I assume has been paid in a previous year and therefore enters into neither the firm’s production or evasion decision in equation 1.1. This accounts for the possibility that a firm’s annual profit may be negative in a given year, but it will continue to operate so as not to lose its investment in k with the expectation that it will return to profitability in a future period, as in Dixit (1989). It also implies that a firm operating in the formal market will prefer to shift to the
shadow economy than go out of business if it has that option.
A firm i can also choose to report some activity in the formal sector. I call such a firm an iceberg after the work of Keen (2012), with after-tax profit given by
Πsi(y, e) = R(y) − αiC(y) − ηsγjg(e) − τ [R(y) − µαiC(y) − e] (1.3) where τ is the tax rate. Each firm chooses some amount e of its revenue to under-report to the tax authorities, with an associated increasing and convex cost of mis-reporting given by g(e). This type of cost could include hiring extra accountants and lawyers, managing two sets of books, and dealing in cash transactions rather than going through a bank. It is also associated with the probability of being caught, with the firm facing a penalty if mis-reporting is detected.
The parameter ηs captures the difference in the cost of tax evasion in the formal market from one sector to another. For example, businesses with large amounts of small cash transactions, such as corner grocery stores or small cafes, will find it easier to hide transactions from the tax authorities than those in other sectors.
The cost of mis-reporting is scaled by γj, which depends on whether the firm is domestic, d, or an affiliate of a multinational, m, with γm = υγd, [0 < υ < 1], so that γm < γd. This reflects the relative ease of evasion in the formal and informal markets. While domestic firms have more familiarity with the tax environment and reality of the underground economy in a given country, they do not have the option of shifting profits between tax jurisdictions to take advantage of differential tax rates, as multinational firms do. Firms with a presence in more than one location are also more likely to be aggressive tax planners,
giving them a greater capacity to use features of the tax code to reduce their taxable profits.
As in Best et al. (2015), I also allow a share µ6 1 of the firm’s reported costs to be tax deductible. To simplify the analysis, I set µ = 1 throughout, representing the case of full cost deductibility.4
Iceberg firms may report zero profits or positive profits, depending on which yields the highest net-of-tax return.5 Firms falsely reporting zero profits, which I call bunchers,
engage in special case of iceberg evasion where they mis-report the entirety of their income. For both, the production decision is the same as that of ghosts, so lower-cost firms will produce more (see equation 1.2).
The iceberg optimally chooses e and y so as to maximize equation 1.3. When µ = 1, the optimal evasion and activity levels satisfy:
R0(yi∗) C0(y∗ i) = αi g0(e∗i) = τ ηsγj where j = m, d (1.4)
The optimal reporting for iceberg firms results from a trade-off between mis-reporting costs and the tax rate. As seen in equation 1.4, evasion decreases with γj and ηs, hence it is lower for domestic firms (γm < γd) and for firms in sectors with a high cost of formal-market evasion. It also increases with the tax rate τ , implying that firms will mis-report to a greater extent when taxes are higher.
The final tax planning strategy is that of bunchers, who choose a level of evasion ˆe such that reported profits equal zero:
R(y∗i) − µαiC(yi∗) − ˆe = 0 ˆ e = R(y∗i) − µαiC(yi∗) d(be) d(α) < 0 (1.5)
with yi∗ given by equation 1.2.
Because bunchers mis-report the totality of their profit, the associated cost of formal-market evasion will always be higher for bunchers than icebergs at a given αi:
b
e = R(y∗i) − αiC(y∗i) e∗i < R(y∗i) − αiC(y∗i) g(be) > g(e∗i)
(1.6)
Respective after-tax profits for the three types of firm are given by: • Ghosts: πg = R(yi∗) − αiC(yi∗) − βs
• Bunchers: πz = R(yi∗) − αiC(yi∗) − ηsγjg(be)
• Icebergs: πp = R(y∗i) − αiC(yi∗) − ηsγjg(e∗i) − τ [R(y ∗
i) − αiC(yi∗) − e ∗ i)]
Domestic firms will choose between the three options based on which yields the highest after-tax profits, given the relative costs of formal and informal evasion in the sector. Foreign-owned firms will choose only between acting as bunchers and icebergs. The results follow those for example of Virmani (1989) for small firms in the distribution of firms across the spectrum of evasion channels.
A domestic firm in a given sector will choose to operate in the formal market and mis-report some level of its profits rather than conducting all activity in the informal market when the expected return is strictly higher. This depends on the relative costs ηs of mis-reporting and βs of operating informally. For icebergs, it will also depend on the tax rate.
A domestic firm will operate in the formal market rather than as a ghost when it expects to earn higher profits by doing so, i.e. when the cost ηs of mis-reporting is less than the fixed cost βs of moving to the informal sector. The level of evasion represented by the special case of bunching at zero is given by e∗i =be. Because a buncher is always evading its full pre-tax profit, the associated cost of formal market evasion will always be higher than for an iceberg, and it will therefore always be closer to the margin of choosing to evade as a ghost. The firm will choose this level of evasion where ˆe = R(y∗i) − αiC(y∗i) rather than moving directly to the informal market when the associated cost is strictly less than the fixed cost of being a ghost :
ηsγdg(be) < βs (1.7)
Within a given sector, lower-cost firms will earn higher profits from operating in the informal market as ghosts, while higher-cost firms gain more from operating in the formal market. Intuitively, this follows from the fact that high-cost firms benefit more from being able to deduct their costs from their total tax bill, making it relatively more advantageous for them to report some positive taxable profit.
The choice between evading as a buncher or an iceberg depends also on the multinational status of the firm, which affects its cost of mis-reporting. A foreign-owned firm of a given αi producing yi∗ will always face a lower cost of mis-reporting e
∗i than a domestic firm in the same sector, because it has a greater capacity for tax planning and the additional option of profit shifting:
given sector.6 Since the cost of evading all profit as a buncher represents the case where
the cost of evasion is highest, there will also always be fewer domestic than foreign-owned bunchers, where the remaining domestic firms evade by operating informally.
In summary, the main results of the model for domestic firms are that within a given sector the lowest-cost firms will be ghosts and the highest-cost icebergs, with bunchers in between. Each firm chooses its tax planning strategy based on the tradeoff between the cost ηs of mis-reporting profits in the formal market, the tax rate τ , and the cost βs of operating informally. High-cost foreign firms will operate as icebergs and low-cost as bunchers, depending on ηs and τ . There will always be more foreign-owned than domestic icebergs and bunchers in a given sector, while only domestic firms will operate as ghosts.
1.2.1
Exogenous shock to the cost of evasion in the formal market
An increase in the cost ηs of mis-reporting will affect both icebergs and bunchers. When firm efficiency α, the tax rate τ , and cost of evasion in the informal sector βs remain unchanged, we can differentiate the firm’s response according to its foreign ownership status, which determines the relative costs of reducing its tax burden through different tax planning strategies.
Marginal domestic bunchers will respond to the increase in η by either moving to the informal market - i.e., becoming ghosts - or beginning to report positive profits as icebergs. The lowest-cost bunchers will become ghosts, while the highest-cost bunchers will become icebergs. Multinational bunchers, on the other hand, will only become icebergs – i.e., stop reporting zero profits.
Domestic firms’ decision comes from the tradeoff between ηs and βs, i.e. the relative costs of evasion in the formal and informal market. When firms are forced to report more transactions to the tax authorities, it may become unprofitable for them to operate in the formal market at all, and they will prefer to pay the fixed cost of moving to the informal market. The overall impact on measured bunching at zero will be ambiguous, as some
firms respond by increasing their reported taxable profits while others drop out of the formal market completely.
For a foreign-owned firm, the increased risk of detection makes it relatively more difficult to mis-report sales in the country where the cost of evasion increases vis à vis the country of its headquarters or other affiliates. Zero-bunching will decrease as foreign-owned firms report more profits in the country of the shock. This may increase their reported worldwide profits, or they may compensate by shifting reported profits between other affiliate or headquarter countries.
The effect on observed bunching at zero for all firms will depend on the tradeoff between the two channels of the response: more non-zero profits reported by both domestic and foreign-owned firms that were previously bunching at zero, and fewer domestic firms present in the distribution of firms in the formal market.
1.3
Identification Strategy
To test the predictions of the model, I develop an identification strategy based on a reform passed in Portugal in 2012 to reduce tax evasion in certain sectors of economic activity, introducing just such a shock to the cost of evasion ηs. According to the results of the model, we should see a decrease in bunching at zero for all firms, and an increase in informality for domestic firms. We can observe the decrease for foreign-owned firms, but will only observe a part of the response of domestic firms because we cannot directly measure the exit to informality.
To isolate a causal impact of the reform that corresponds to the predictions of the model, I measure the rate of excess bunching at zero profits by firms and compare the estimates across targeted sectors in a difference-in-differences analysis. Bunching analysis is used to obtain a non-parametric estimator of the difference between the distribution of
subsequent refinements of the bunching technique developed by Chetty et al. (2011) and Kleven and Waseem (2013).
Where corporate tax rates are uniform and firms vary continuously along a given characteristic such as profitability, we expect firms to locate smoothly along the distribution of taxable income. The existence of discontinuities in the corporate tax schedule, however, changes the incentives for firms’ profit reporting. There are two types of discontinuities: kinks, where the marginal tax rate applied to the first dollar above the discontinuity changes; and notches, where the average tax rate applied to all income changes. In both cases, firms with profits above but close to the threshold have an incentive to reduce their reported income to just below to reduce their tax liability, with a stronger incentive for notches than for kinks. By testing for an excess mass of firms around the discontinuity, we obtain an estimate of the share of firms changing their behavior.
In the case of the kink at zero in Portugal, the tax rate for most Portuguese firms jumps from zero to 25% (see section A in Appendix A for more details on corporate taxation in Portugal).7 To avoid facing a positive tax rate, some firms can be expected to falsely
report their profits as zero, acting as bunchers.
Such mis-reporting is not without risk, however. Firms for example face costs associated with hiring extra accountants and lawyers, managing two sets of books, or dealing in cash transactions rather than going through a bank. Another type of cost is associated with the risk of an audit, as for example in Almunia and Lopez-Rodriguez (2012). Because of these costs, not all firms will bunch at zero.
The share B of active firms whose profits are maximized by falsely reporting zero profits can be estimated through RKK+∆zh(z)dz, where K is the point of discontinuity in the income distribution where the tax rate changes from τ1 to τ2. In the case of zero profits, both K and τ1 are equal to zero. The density distribution of reported firm profits in the absence of any discontinuity in the tax rate is represented by h(z), the case where all firms face τ1 regardless of reported income. K + ∆z represents the highest point along
7Some Portuguese firms are subject to a “special payment on account” assessed on the minimum of one
percent of their previous year’s turnover and equal to at leaste850. Inspection of the distribution at this
the income distribution where firms chooses to move below K to avoid facing the higher tax rate τ2.
To estimate the counterfactual distribution of firm taxable income, a flexible polynomial is fitted to the observed empirical distribution, with firms grouped into j bins by their reported pre-tax net profits:
cj = p X i=0 βi(yj)i+ yU X i=yL γi1[yj = i] + νj (1.9)
where cj is the number of firms in bin j, p is the order of the polynomial, and yj is the upper limit of the profits in bin j. To accurately construct the counterfactual, the contribution of firms around K must be excluded, setting a lower limit of yU and an upper limit of yLon the excluded range. This ensures that the counterfactual distribution reflects the profits of firms around the threshold as they would behave if the tax rate remained the same above and below–effectively, if the tax rate were τ1 for all firms.
The counterfactual distribution on the intensive margin is therefore obtained by estimating the regression with only the included firms:
b cj = p X i=0 βi(yj)i (1.10)
The resulting parameter b(τ1, τ2) represents the excess mass of firms in the distribution located below the kink point K, given as the fraction of firms below the kink relative to the density in the counterfactual situation of a constant tax rate τ1 throughout the entire distribution, i.e. the share of bunchers among active firms.
There may of course be a higher mass of firms at zero profits for reasons other than tax evasion. For example, firms in their first year of activity may not have activity to report, or may still be mastering the complexities of the reporting process. It is therefore particularly important for bunching analysis at zero to exclude these types of firms, where
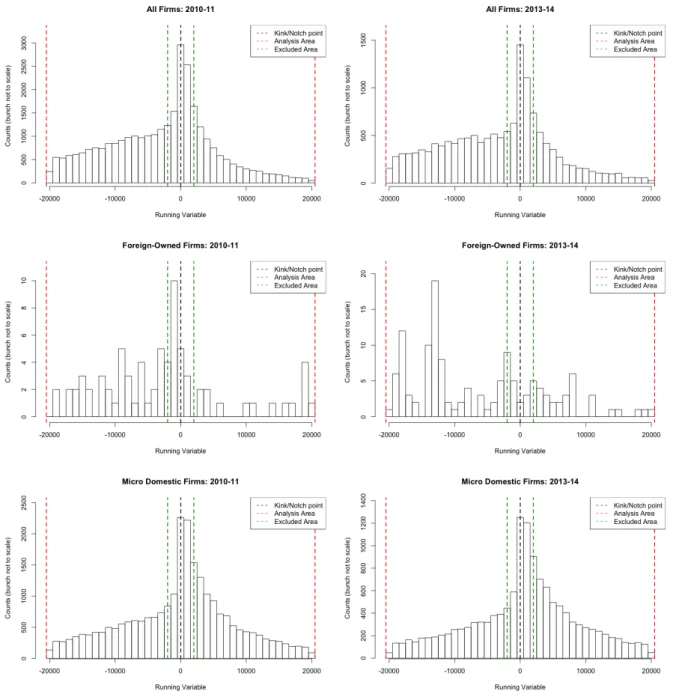
I further distinguish the bunching analysis between two subgroups with different alternatives for tax planning: foreign-owned and micro domestic firms. The cost of bunching at zero is lowest for foreign-owned firms, whose headquarters can use profit shifting to manipulate their global tax bills. We expect that these firms will bunch more at zero pre-reform, and that the drop post-reform will be greater as they are forced to report more sales in Portugal.
I examine small domestic firms to test for the presence of ghosts, using the EU definition of micro businesses: firms with less than ten employees and either annual turnover or balance sheet total less than or equal to e2 million (see section 2.4 in Chapter 2 for more detail on the selection of micro domestic firms). While it is relatively more difficult for these small firms to bunch at zero than for foreign-owned firms, they have the additional option of operating informally. We expect that they will bunch less at zero pre-reform, and that the rate of bunching will be less impacted by the reform – in part because the evasion strategy is less relevant to them and in part because some firms exit to the informal sector, affecting the underlying distribution.
To test for these extensive margin effects, I complement the difference-in-differences with a survival analysis comparing the probability of exit for micro domestic firms before and after the reform and across sectoral treatment. Survival analysis is used to track outcomes where the period of observation ends before all individuals have experienced the event of interest, in this case a firm ceasing operation in the formal market. The technique accounts for the fact that the probability of survival in a given period is conditional on the proportion of firms surviving in all previous periods, while correcting for the skew in the underlying distribution coming from firms exiting before the end of the observation period. If firms exit to informality as predicted by the model, we will see a higher rate of exit in treated sectors post-reform.
1.3.1
Natural Experiment: Shock to Evasion Costs in Portugal
The sectoral treatment is defined according to a law passed in Portugal in August 2012. The reform establishes incentives for consumers to ask for receipts associated with their individual taxpayer identification number for transactions in sectors particularly prone to tax evasion:
• Automotive vehicle maintenance and repair
• Maintenance and repair of motorcycles and motorcycle parts • Lodging, restaurants, and similar businesses
• Hair salons and beauty institutes
When individuals fill out their personal income tax returns, they can see a list of the transactions which were reported by businesses with their taxpayer identification number. If there are any transactions missing, consumers can flag them to the tax authorities.
The law, which went into effect at the beginning of 2013, allows consumers to deduct from their personal tax bill 15% of the VAT paid in these transactions, up to e250 per household member. Starting in 2014, consumers could also enter a lottery to win a car with their eligible receipts. By doing so, the government effectively increased the risk of detection for firms, with the goal of decreasing mis-reporting of business-to-consumer transations and increasing overall VAT collection.
Fiscal receipts provide an official record of transactions for tax authorities. However, consumers have little incentive to ask for such receipts and often dispose of them imme-diately, and businesses seeking to evade taxes have a high incentive not to issue them. Programs such as the one implemented in Portugal seek to give fiscal receipts some value to consumers, creating a conflict of interest between the consumer and the seller that it
television broadcast. It also had an immediate impact on the number of receipts issued in targeted sectors — a 40% increase in the first year alone (Fooken, Hemmelgarn, Herrmann, et al., 2015).
This policy, with high visibility and takeup rates, provided an exogenous shock to the cost of evasion by increasing the probability of detection of under-reported revenue, corresponding in the model to an increase in ηs. I use this as a natural experiment to test the predictions of the model regarding the effects of an increase in the cost of tax evasion on bunching at zero, allowing me to identify the tax-evasion component of the phenomenon. Assuming that other determinants of bunching at zero remained unchanged or changed to the same extent for firms in targeted and non-targeted sectors, the difference in the magnitude of bunching at zero before and after the reform can be attributed to the change in evasion costs.
1.4
Data
I use data from the administrative accounting records of Portuguese firms covering the period 2010-2015.8 Firms are required to submit these records annually to the financial authorities.
I first test the results using firms’ pre-tax net profits as reported in their annual accounts. This variable reflects evasion through the type of sales mis-reporting targeted by the law. As an additional check for the use of alternative channels of mis-reporting, I also construct an approximation of taxable income using the approach of Graham and Kim (2009), who use this method for firms in the United States. The authors test the validity of this specification using information from firms’ actual tax returns, finding that the constructed variable yields the same results. This approach is similar to that used by Chetty (2012) for Denmark, and Gruber and Saez (2002) for the US to simulate personal taxable income from administrative datasets.
8The dataset is available from 2006. I use information from years prior to 2010 to calculate the age of
Table 1.1: Number of firms by category and year 2010 2011 2012 2013 2014 Total 334721 330691 326910 323836 329174 Treated Sector 13902 15222 12994 11250 9974 Foreign-Owned 221 257 258 317 327 Micro Domestic 10405 12065 10688 9653 8841
Note: Totals are restricted to matched firms used in the bunching estimations.
To construct this variable, I begin with firms’ pre-tax profits minus losses. I then add interest and similar earnings, supplemental earnings, earnings from royalties, other unspecified earnings, and deferred tax liabilities. From this total, I subtract interest paid and similar losses and deferred tax credits. This follows as closely as possible the formula used by the Portuguese tax authority to calculate income assessed for corporate tax (see Figure A.1 in appendixA). I am able to capture most parts of the calculation with the available data, although I do not have information on tax credits and deductions claimed by the firm during the current period. I use the variable as a robustness check for the results using pre-tax profits. Where the results using the two variables differ, it signals a difference in the channels through which firms manipulate their profits to bunch at zero. I classify each firm as foreign-owned or domestic using the variable describing the country of ultimate ownership, where a firm reporting any country other than Portugal is defined as a subsidiary of a multinational firm. The estimates for foreign-owned firms therefore reflect the behavior of the overseas owners of an international conglomerate in conjunction with their Portuguese subsidiaries. Table 1.1 shows the number of firms by category and year.
The validity of both the difference-in-differences and survival analysis rest on the assumption that unobserved differences between the treatment and control groups remain stable over time. As an indication of whether this assumption holds, I graphically examine the trends in pre-tax profits and taxable income of firms in treated and non-treated
a slightly sharper downturn in the year before. The trends were the same when plotted for taxable income (not shown).
Figure 1.1: Common Trends in Average Pre-tax Profits: Control and Treated Firms
Note: Blue line represents firms in sectors targeted by the reform.
One weakness in the identification strategy is the non-random selection of firms into treatment. The sectors targeted by the reform are among those most prone to tax evasion, and firms may have chose to operate in these sectors specifically because of the greater ease of mis-reporting. This would imply that they differ from the control group in one important unobservable characteristic, namely the tendency to evade.
Although I cannot control for this selection bias, I do seek to bolster the comparability of the results by restricting the control group in non-treated sectors through nearest-neighbor matching on key characteristics of firm performance: leverage, return on assets, ratio of cashflow to assets, ratio of cash to assets, ratio of PPE to assets, the number of employees, and firm age. Tests for the quality of the match are presented in tables
1.2,1.3, and 1.4, and show that the two groups are generally well-matched in observable characteristics.
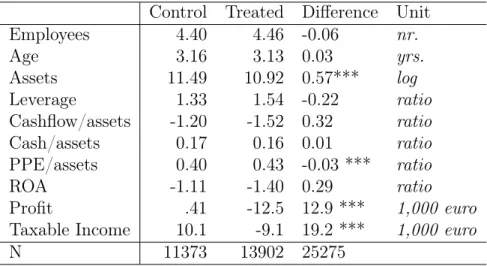
Table 1.2: Summary Statistics: Control Variables by Sectoral Treatment Status (2010) Control Treated Difference Unit
Employees 4.40 4.46 -0.06 nr. Age 3.16 3.13 0.03 yrs. Assets 11.49 10.92 0.57*** log Leverage 1.33 1.54 -0.22 ratio Cashflow/assets -1.20 -1.52 0.32 ratio Cash/assets 0.17 0.16 0.01 ratio PPE/assets 0.40 0.43 -0.03 *** ratio ROA -1.11 -1.40 0.29 ratio Profit .41 -12.5 12.9 *** 1,000 euro
Taxable Income 10.1 -9.1 19.2 *** 1,000 euro
N 11373 13902 25275
Note: Totals are restricted to firms used in the bunching analysis, i.e. those matched across sectoral treatment status. Matching with replacement is allowed. Leverage is measured as the ratio of debt to assets, and ROA as the ratio of EBITA to assets.
*** p<0.01, ** p<0.05, * p<0.1
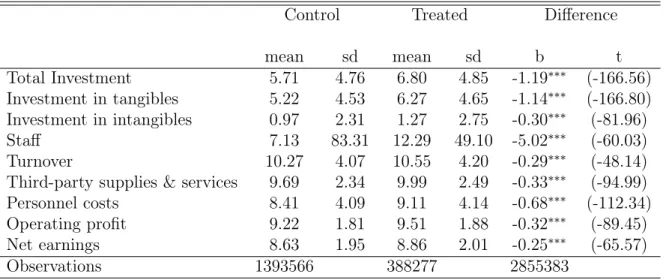
Firms in treated sectors are small on average, with less than five employees in 2010 (see Table 1.2). They report negative income as measured by both pre-tax net profits and constructed taxable income, significantly lower than that reported by the control group in non-treated sectors. They are well matched on age, leverage, the ratio of cash and cashflow to assets, and return on assets. They are slightly smaller than control firms as measured by the log of assets, but have a slightly higher ratio of PPE to assets.
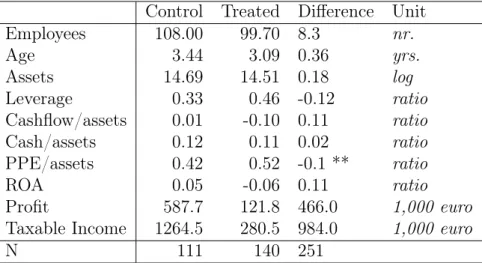
Foreign-owned firms in treated sectors are much larger than other firms with nearly 100 employees on average, highlighting the importance of finding comparable firms in non-treated sectors (see Table 1.3). They are well-matched to the selection of matched non-treated firms on all variables, although they have a slightly higher ratio of PPE to assets. They report higher pre-tax profits and taxable income than the matched firms in non-treated sectors.
Table 1.3: Summary Statistics: Control Variables for Foreign-Owned Firms by Sectoral Treatment Status (2010)
Control Treated Difference Unit
Employees 108.00 99.70 8.3 nr. Age 3.44 3.09 0.36 yrs. Assets 14.69 14.51 0.18 log Leverage 0.33 0.46 -0.12 ratio Cashflow/assets 0.01 -0.10 0.11 ratio Cash/assets 0.12 0.11 0.02 ratio PPE/assets 0.42 0.52 -0.1 ** ratio ROA 0.05 -0.06 0.11 ratio Profit 587.7 121.8 466.0 1,000 euro
Taxable Income 1264.5 280.5 984.0 1,000 euro
N 111 140 251
Note: Totals for firms in non-treated sectors are restricted to those matched to firms in treated sectors. Matching with replacement is allowed. Leverage is measured as the ratio of debt to assets, and ROA as the ratio of EBITA to assets.
*** p<0.01, ** p<0.05, * p<0.1
Table 1.4: Summary Statistics: Control Variables for Micro Domestic Firms by Sectoral Treatment Status (2010)
Control Treated Difference Unit
Employees 2.76 2.94 -0.18 *** nr. Age 3.13 3.10 0.03 yrs. Assets 11.31 10.75 0.56 *** log Leverage 1.43 1.65 -0.22 ratio Cashflow/assets -1.29 -1.65 0.35 ratio Cash/assets 0.17 0.16 0.01 ratio PPE/assets 0.40 0.43 -0.03 *** ratio ROA -1.20 -1.52 0.32 ratio Profit -3.1 -8.8 5.6 *** 1,000 euro
Taxable Income .76 -5.3 6.1 *** 1,000 euro
N 10405 12786 23191
Note: Firms are matched with replacement across sectoral treatment status. Leverage is measured as the ratio of debt to assets, and ROA as the ratio of EBITA to assets.
1.5
Results
I find statistically significant bunching at zero for all firms in all time periods, using both the net profit and taxable income measures.9 The results are reported below in tables 1.5, 1.6, and 1.7, with bunching mass defined as the height of the empirical distribution proportional to the estimated counterfactual. The pre and post-reform differences are reported as the percentage change in bunching mass, and the difference in differences for firms in treated and non-treated sectors as the difference in percentage points. Figure 1.2 graphically shows the pre- and post-reform bunching in pre-tax net profits for firms in treated sectors.
The results for net profits are in line with the predictions of the model and suggest that the reform decreased tax evasion through bunching at zero. We see 2.3-2.53 times more firms reporting zero pre-tax profits than we would expect under the counterfactual scenario. The rate of bunching decreases by 2.23% in treated sectors after the reform, compared with a 2.7% increase in non-treated sectors, with an average differential of five percentage points between the two differences. The decrease is small but statistically significant, suggesting that the reform decreased bunching at zero in these sectors. The rate of bunching is much lower than the 11.98 obtained by Lediga, Riedel, and Strohmaier (2019)for domestic South African firms, suggesting this strategy may be less relevant for
firms in Portugal.
Comparison of the results with those for taxable income suggest that mis-reporting of sales or costs plays a bigger role in tax-related bunching at zero for most firms than manipulation of other items in the tax report, although it is difficult to draw conclusions from this evidence alone. For the universe of firms in treated sectors and their matched counterparts, the rate of bunching is similar when measured by pre-tax profits and taxable income. However, there is no significant change in the bunching rate in taxable income for
Figure 1.2: Bunching at Zero in Treated Sectors, Pre and Post Reform (Pre-Tax Profits)
Note: Bunching in pre-tax profits of firms in treated sectors, pre and post-reform. The decrease for foreign-owned firms is visible, while the changes for all firms and micro domestic firms are much smaller.
Table 1.5: Bunching Results: Sectoral Treatment
Treated sectors Pre-tax net profit Taxable Income
Pre 2.53*** 2.61*** (0.002) (0.002) Post 2.47*** 2.25*** (0.003) (0.005) Difference -2.23%*** -13.6%*** (0.000) (0.000) Non-treated sectors Pre 2.3*** 2.36*** (0.004) (0) Post 2.36*** 2.05*** (0.005) (0) Difference 2.7%*** -13.4%*** (0.001) (0) Difference in differences (pp) 5*** 0*** (0.001) (0.001)
Note: Bunching is estimated as the excess density of firms in the empirical distribution reporting zero profits relative to the counterfactual. Firms are excluded from the analysis in the year of their creation when the likelihood of reporting zero profits for non-tax related reasons is higher. Firms are also excluded if they report no employees, and either no sales or no assets. Estimates for non-treated sectors are restricted to firms matched to treated firms through nearest neighbor matching on return on assets, leverage, ratio of cashflow to assets, ratio of cash to assets, ratio of employees to assets, number of employees, and age in 2010. Binwidth is 1,000 euros. Means and standard errors are obtained through bootstrapping.
*** p<0.01, ** p<0.05, * p<0.1
taxable income to zero, while those bunching in pre-tax profits are only able to mis-report sales or costs, where mis-reported sales are more likely to be detected post-reform.
1.5.1
Foreign-owned Firms
Both the initial rate of bunching and the post-reform decrease for foreign-owned firms is much higher. The initial bunching rate of 5.33 drops by almost half post-reform in treated sectors, compared to a 14% increase in non-treated sectors. The magnitude of the differences should be treated with caution, however, as there are very few firms in the sample – the corresponding estimate of the excess number of firms bunching at zero in treated sectors drops from 46 pre-reform to 2 post-reform, and in non-treated sectors from 11 to 10.
The results for taxable income are very different, although the reason why is unclear. The rate of bunching pre-reform and in non-treated sectors is much higher than that estimated using pre-tax net profits, consistent with the finding of Habu (2017) that bunching at zero by foreign-owned firms in the UK is higher when measured with tax return data than when using administrative accounts. The differential for treated and non-treated firms is 81 percentage points as measured by taxable income, compared with a 55 percentage point differential as measured by pre-tax profits.
It could be the case that foreign-owned firms have a more aggressive tax planning strategy of foreign-owned firms focused on both shifting reported sales away from Portugal, and compensating for Portuguese profits through deductions or other items in the tax report. If this is the case, then the decrease in bunching in taxable income post-reform suggests that these firms were not able to adjust for the forced higher reporting of sales in Portugal. With such a small sample and no information on these firms’ worldwide profits, however, we cannot draw definitive conclusions.
Table 1.6: Bunching Results: Foreign-Owned Firms
Treated sectors Pre-tax net profit Taxable Income
Pre 5.33*** 41.53*** (0.161) (20.281) Post 3.1*** 0.99*** (0.095) (0.07) Difference -41.75%*** -99.54%*** (0.10) (0.90) Non-treated sectors Pre 5.4*** 7.65*** (0.186) (0.567) Post 6.13*** 6.52*** (0.146) (1.65) Difference 13.39%*** -14.42%*** (0.2) (0.30) Difference in differences (pp) 55*** 81*** (0.10) (0.30)
Note: Bunching is estimated as the excess density of firms in the empirical distribution reporting zero profits relative to the counterfactual. Firms are excluded from the analysis in the year of their creation when the likelihood of reporting zero profits for non-tax related reasons is higher. Firms are also excluded if they report no employees, and either no sales or no assets. Estimates for non-treated sectors are restricted to firms matched to treated firms through nearest neighbor matching on return on assets, leverage, ratio of cashflow to assets, ratio of cash to assets, ratio of PPE to assets, number of employees, and age. Binwidth is 1,000 euros. Means and standard errors are obtained through bootstrapping.
1.5.2
Micro domestic firms
Finally, for micro domestic firms there is an increase in bunching at zero of 8.5% in treated sectors as measured in pre-tax profits, which is on average 7 percentage points higher than the increase of 1.56% in non-treated sectors. The direction of the results is even larger for taxable income, although it is difficult to find a plausible explanation for this when compared to the full sample of firms.
Although the rate of bunching increases, the absolute number of bunching firms drops from 3,170 to 1,340 in treated sectors. This means that the remaining bunchers have more weight in the distribution of active firms in treated sectors post-reform. This corresponds with the predictions of the model, which suggest that this will be the case for domestic firms because the incentive to bunch at zero as a tax planning strategy is affected by the availability of another option: exiting to informality – i.e., becoming ghosts.
To test for this effect, I conduct a survival analysis on the same subset of micro domestic firms, comparing their outcomes before and after the reform and across sectoral treatment status. I use nearest-neighbor matching on baseline sales, number of employees, cash flow, assets, and investment in 2009 to restrict the analysis to firms that were comparable in observable indicators of performance and financial health before the period of analysis10. The parameter of interest is the estimated coefficient on sectoral treatment status, representing the impact on the probability of firm survival of being in a sector targeted by the reform. I also include factors shown in the literature to influence firm survival that are available for all firms in the baseline year of 2009: firm age in 2009 and the yearly values of turnover, number of employees, assets, and investment (Jensen, Buddelmeyer, and Jensen, 2006; Mata and Portugal, 2002; Pérez, Llopis, and Llopis, 2004).11
I first specify the model with a time-fixed coefficient on sectoral treatment status, to test the assumption that the effect of being in a treated sector is unchanged over time. A
10Survival analysis is conducted using the R package survival (Terry M. Therneau and Patricia M.
Grambsch, 2000) and matching with the R package MatchIt (Ho et al., 2011)
11Firm age in the baseline year is calculated using the full 2004-2015 panel, based on the first observation
for the firm in the dataset. If the firm is present in 2004 and not flagged as established in that year, the age is imputed using the industry mean plus the time lag.
Table 1.7: Bunching Results: Micro Domestic Firms
Treated sectors Pre-tax net profit Taxable Income
Pre 2.62*** 2.89*** (0.003) (0.003) Post 2.84*** 2.91*** (0.005) (0.008) Difference 8.54%*** 0.81%*** (0.001) (0.001) Non-treated sectors Pre 2.35*** 2.36*** (0.004) (0.004) Post 2.39*** 2.05*** (0.004) (0.005) Difference 1.56%*** -13.1%*** (0.001) (0.001) Difference in differences (pp) -7*** -14*** (0.001) (0.001)
Note: Bunching is estimated as the excess density of firms in the empirical distribution reporting zero profits relative to the counterfactual. Micro firms are defined as those with less than 10 employees and
either turnover or assets less thane2 million. Firms are excluded from the analysis in the year of their
creation when the likelihood of reporting zero profits for non-tax related reasons is higher. Firms are also excluded if they report no employees, and either no sales or no assets. Estimates for firms in non-treated sectors are restricted to those matched to firms in treated sectors through nearest neighbor matching on return on assets, leverage, ratio of cashflow to assets, ratio of cash to assets, ratio of employees to assets, number of employees, and age in 2010. Binwidth is 1,000 euros. Means and standard errors are obtained through bootstrapping.
*** p<0.01, ** p<0.05, * p<0.1
test of the scaled Schoenfeld residuals shows that the Cox proportional hazards assumption – that the ratio of the baseline rate of survival for firms in treated vs. non-treated sectors is constant over time – is violated, with a statistically significant variation for the coefficient on sectoral treatment at the 1% level. Figure 1.3shows divergence starting in 2012, the year the law was passed.
Figure 1.3: Estimated Beta for Sectoral Treatment Status: 2010-2014
In the second stage, I allow the coefficient to vary over time. The test of the scaled Schoenfeld residuals confirms that the proportional hazards assumption is satisfied in this specification.12 Before 2013, firms in treated sectors were weakly more likely to exit than firms in non-treated sectors. In the first two years of the anti-evasion law, however, the hazard ratio for treated firms becomes significantly greater than for non-treated firms (see Table 1.8). In the treatment period, a firm in a treated sector was was 1.15-1.18 times
more likely to exit than a comparable firm in a non-treated sector.
12The proportional hazards assumption is also satisfied only when allowing for time variance for the
firm’s baseline age and its yearly lagged number of employees, sales, and investment. The coefficient on yearly lagged assets is time-fixed.
Table 1.8: Hazard Ratios
Year Treated Sector Younger firms Smaller firms Low sales Low investment
2010 1.01 1.83*** 1.45*** 1.68*** 1.6***
2011 .96 1.88*** 1.41*** 1.94*** 1.52***
2012 1.05 1.59*** 1.39*** 2.06*** 1.86***
2013 1.15*** 1.71*** 1.58*** 2.04*** 1.88***
2014 1.18*** 1.65*** 1.57*** 2.02*** 1.77***
Each value represents the predicted probability of exit for a firm when compared to the reference value. Where the hazard ratio is greater than one, a firm has a higher probability of exiting. Splits for categorical variables are computed automatically using the surv_cutpoint procedure in R, which identifies the threshold value having the largest impact on survival probability and splits observations into ‘low’ and ‘high’ accordingly (2018). Firm size is based on number of employees.
*** p<0.01, ** p<0.05, * p<0.1
As in for example Saez (2010) andWaseem (2018), it can plausibly be assumed that firms will prefer to move to the informal market rather than cease operations in response to an increase in the cost of tax evasion. In conjunction with the model and the fact that the bunching response of these small firms differs from the global trend in the targeted sectors, the result suggests that the impact of the Portuguese reform on these firms is to increase the probability of becoming a ghost. The analysis captures the full extensive margin of firm response, meaning that I cannot distinguish between firms moving to the informal market and those going out of business. However, the use of matching to restrict the sample for analysis lends support to the hypothesis that the divergence in outcomes is driven at least in part by movement to the informal sector, as firms in sectors where the cost of evasion increased are compared to those with similar performance pre-reform.
1.6
Conclusions
The results are consistent with tax-related bunching at zero for both foreign-owned and domestic firms in Portugal. The overall decrease in bunching in targeted sectors post-reform suggests that firms experienced the reform as an increase in the cost of mis-reporting in this way, and responded by changing their tax planning strategies. Bunching at zero appears to be a less relevant strategy for small domestic firms with the option to exit to informality, as suggested by a higher rate of exit for firms in targeted sectors when compared to similar firms in other sectors.
An interesting avenue for further exploration is presented by the difference between the results for foreign-owned firms as measured by the constructed taxable income variable. Although the small sample and data limitations make it difficult to draw conclusions, the results suggest that the channel of mis-reporting differs for these firms. Bunching by foreign-owned firms decreased more sharply after the reform by this measure than for pre-tax profits, possibly because they were not able to anticipate that they would be forced to report more profits in Portugal and adjust through inter-temporal or cross-border shifting. The constructed taxable income variable is missing some key information to fully explore this dynamic, however – most prominently tax credits and deductions, of which many were enacted during this period of recession and economic stimulus. The mechanism underlying the differential between the channels used by foreign-owned and domestic firms bunching at zero would benefit from a more detailed theoretical examination as well.
Understanding how firms change their tax planning strategies in response to changes in the tax environment can inform the efficient use of resources by tax authorities charged with combatting evasion. This paper provides an important contribution to existing research on tax evasion by firms. Using exogenous variation in the cost of evasion, I am able to show that the rate of bunching at zero is affected by the tax environment, that the dynamic differs for foreign-owned and domestic firms, and that the option to operate informally may change the incentives to bunch at zero.
Firms in the Shadow Economy:
A Survey
2.1
Introduction
In Chapter 1, I differentiate three types of firms based on their tax planning strategies: icebergs, which mis-report a percentage of their portion of their profits to reduce their tax bill; bunchers, which report no profits to bring their tax bill to zero; and ghosts, which operate in the informal economy and also pay no taxes. The chapter is focused on bunchers, about whose behavior little is known.
In this chapter, I turn my focus to gaining a better understanding of the ghosts. Understanding and quantifying the activities of these firms has drawn much attention from governments and researchers, but there are many challenges to empirical work on an activity designed to avoid detection. In the literature on tax evasion and avoidance, much more is known about the intensive margin response of firms to changes in the tax rate and enforcement than the decision-making of firms on the extensive margin of the formal economy – those with the option to go underground.
This margin is particularly relevant in the wake of the recent financial crisis in Europe, as many governments have enacted measures to shift activity from the shadow to the official economy. In Portugal, the rescue package provided by the Eurogroup, European Central
Bank, and IMF in 2011 included a clause to raise at leaste175 million by increasing efforts against tax evasion, fraud, and informality (European Commission, Directorate-General for Economic and Financial Affairs, 2011). This prompted a series of measures including the provision of incentives for consumers to ask for receipts from businesses (see section 1.3.1 in Chapter1 for more details), the improvement of resources and information sharing by the tax authority, and the strengthening of tax reporting obligations for businesses (European Parliament, 2017).
The presence of a shadow economy erodes the tax base, draws workers and firms away from the formal economy, and makes it more difficult for governments to make public policy decisions by distoring official figures on the economy (Çule and Fulton, 2009; Schneider and Enste, 2000; Dell’Anno, Gómez-Antonio, and Pardo, 2007). Additionally, firms that operate in the shadow economy lose access to institutions such as the judicial system, making their production and investment decisions less efficient (Dabla-Norris and Feltenstein, 2005). The presence of a shadow economy can also act as an obstacle to economic progress. Without the ability to collect tax revenues, governments cannot build the strong institutions that are necessary to sustain growth, or – in the case of developing countries – to reduce reliance on international aid (Cobham, 2005).
Academic research has an important role to play in improving the design of policy interventions aimed at reducing illicit activity and increasing tax revenues. Measuring the size of the shadow economy has been a primary focus of the economic literature on the topic, and has led to the exploration and testing of various assumptions. The results differ depending on factors such as the choice of parameters, institutional context, and time period, making it difficult to judge the credibility of a single additional measurement or to use results from different methods as robustness checks for one another. However, the extensive body of work on the topic has led to findings on the determinants and characteristics of the shadow economy that provide important information to researchers
extension of the model in Chapter 1 to include firms in the shadow economy – the ghosts. Other survey papers have evaluated how researchers approach the topic, including the difficulty of defining the problem, the range of measurements obtained in different settings, and the strengths and weaknesses of different techniques (see e.g. Schneider and Enste (2000); Fuest and Riedel (2009); Georgiou (2007); Gerxhanti (1999); Beer, Mooij, and Liu (2018); Riedel (2018); Schneider and Buehn (2018)). This survey will cover some of the same ground, with a focus on how researchers have approached the difficulties inherent to study of the shadow economy, what information this has yielded on the nature of the shadow economy and the firms that participate in it, and what can be learned about the shadow economy in Portugal. I start in Section 2.2by laying out the foundations for study of the shadow economy with an overview of different definitions used. In Section 2.3 I then address the different approaches to measuring its size, and the pros and cons of each. In Section 2.4 I present the key insights from the measurement literature, and I conclude in Section2.5 with an assessment of the relevant results for Portugal and areas for further development.
2.2
Defining the shadow economy
In Chapter 1, I take as a definition of the shadow economy that part of legal economic activity that is mis- or under-reported by firms in an illegal way, leading to a corresponding reduction in tax revenue from what the government would expect to collect with perfect compliance. There is no consensus on a definition in the economic literature, however, and each study on the topic starts from a different baseline depending on the estimation method and institutional context.
Many authors use a starting point similar to that of Schneider and Enste (2000), who defines the shadow economy as “unreported income from the production of legal goods and services, either from monetary or barter transactions, hence all economic activities that would generally be taxable were they reported to the tax authorities” (pp. 78-79) (Cebula, 1997; Hudson et al., 2012; Çule and Fulton, 2009). Others broaden the scope even more,
as in for example in Bhattacharyya (1999), who includes all unrecorded national income — i.e. the difference between “potential” and recorded national income. These very general definitions fail to make the important distinction between tax evasion and tax avoidance, which is the underpayment or nonpayment of taxes through loopholes or inconsistencies in the legal tax system.
Many researchers narrow their scope according to the type of activity, excluding for example illegal activities or household work. This is a cleaner setup theoretically, but cannot always be delineated in practice. For example, legal and illicit activities cannot be distinguished in studies based on macroeconomic indicators. Moreover many activities cannot be easily classified as formal or informal, such as money laundering – where income from illegal activities is legitimized through use in legal business – or the illegal smuggling of legitimate goods (Georgiou, 2007; Schneider, Raczkowski, and Mróz, 2015; Schneider et al., 2015; Pedersen, 2003).
Others consider the motivation of the evader in their definition, which is nearly impossible to tease out in aggregate studies. Schneider and Buehn (2018), for example, define the shadow economy as all legal production of goods and services to avoid payment of taxes, social security contributions, or labor market standards; or avoiding complying with administrative procedures. Not only is it very difficult to assess which of these reasons motivates firms to operate in the shadow economy, but it also opens questions regarding the definition of the drivers themselves – for example, it could make sense to further differentiate firms based on whether they are primarily motivated to avoid income or VAT taxes.
There is no real answer as to which definition is best, and it depends on the nature of the research question at hand. For the purposes of the study in the first chapter of this thesis, the most important element is the legal nature of the business engaged in by the ghost firms – because they are on the margin of the formal and informal economy, they
distinguishing the ghosts from bunchers and icebergs. While ghosts conduct all of their business in the shadow economy and thus by default through illegal tax evasion, bunchers and icebergs conduct some of their business in the formal economy and have the additional option of avoidance to reduce their tax bills. Finally, the reduction of tax revenue captures the policy relevance of the question at hand, namely the effectiveness of the intervention aimed at increasing the reporting of income subject to taxation.
2.3
Measurement
By far the most extensive branch in economic literature on the shadow economy is devoted to its measurement. Over the years, researchers have developed increasingly complex techniques for addressing the biggest obstacle inherent to this task: namely the fact that its illicit nature makes it impossible to observe directly. The struggle to agree on a consistent definition for the shadow economy stems in part from this difficulty, and has contributed to a large variation in estimates obtained using different definitions and techniques. In Portugal, for example, estimates of the size of the shadow economy between 2000 and 2012 using three of the primary measurement techniques range from 16 to 39% of GDP (see Figure 2.1 in section 2.5).
The two main methods of measurement are indirect approaches that use macro-level indicators to tease out the aggregate size of the shadow economy in a single country or group of countries, and direct approaches that use micro-level indicators such as surveys to elicit small-sample estimates for extrapolation. While indirect approaches use widely-available data, they rest on strong assumptions that cannot always be confirmed. Direct methods of measurement can help provide support for these assumptions, but rely on data that are not easily obtained, are costly to collect, and have limited external validity. For these reasons, indirect methods are still the most widely used in the literature.