Introduction
In a volleyball play, the defending team tries to neutralise or restrain the opponent’s offense through defensive actions such as blocking and court defence. The block is a team’s irst line of defence, and it aims to intercept, stop, or restrain the oppo-nent’s offensive actions (Selinger & Ackermann-Blount, 1985). The main objective of court defence is to control the ball that was attacked by the opponent to send it to the setter and, thus, counterattack (Stone, 2002). Block and court defence perfor-mance depend on how an opponent’s spike (e.g. attack tempo, distance from the ball, previous displacements) is performed (Selinger & Ackermann-Blount, 1985) as well as on variables that determine the opponent´s offense (e.g. setter’s zone, available hitters, attack area) (Afonso & Mesquita, 2011). The interaction of various game actions determines the performance of defensive actions such that performance may vary according to the age group and/or competition level. These changes are determined by players´ maturity (e.g. greater height, weight, reach) (Malina & Bouchard, 1991), progress in the training process (e.g. higher speed, better technical execution), and changes in game regulations (e.g. net height, libero), which may occur as players progress from one category to the next.
Block performance is associated with players´ anthropo-metric features (e.g. height, weight, etc.), and behavioural and psychological abilities (e.g. reaction time) (Stamm, Stamm, & Thomson, 2005). One reason for this association is the fact
that the height reached over the net is crucial (Grgantov, Katic, & Jankovic, 2006; Stanganelli, Dourado, Oncken, Mancan, & Costa, 2008), as it enables an appropriate technical-tactical ex-ecution. On the other hand, court defence performance requires the development of physiological factors (e.g. strength, lexi -bility, etc.), technical-tactical factors (hand-eye coordination, etc.), and psychological factors (optimal activation for a quick reaction to the opponent’s attack) (Stone, 2002). Most of these performance factors are limited when the opponent’s spike is carried out quickly. These quick attacks force defenders to re-act and move in the shortest possible time. Thus, quick attacks have greater eficiency (Bergeles & Nikolaidou, 2011; Castro, Souza, & Mesquita, 2011; Costa et al., 2011; Palao, Santos, & Ureña, 2007) on account of the conditions in which the block is performed (Afonso, Mesquita, Marcelino, & Silva, 2010) and limited defensive movements.
Despite the relationship between the spike and defensive actions, there is a lack of reference values in the scientiic liter -ature pertaining to technical-tactical performance of the block and court defences that take into consideration the opponent’s spike tempo according to the various categories of competition. Reference values may be helpful in guiding training process and improving the performance of these actions. This study is the irst step in establishing a technical-tactical performance proile of blocking and court defence. The aim was to assess techni-cal-tactical performance proiles of blocking and court defence for various categories of competition in men’s volleyball. Original article (short paper)
Technical-tactical performance proile of the
block and dig according to competition category
in men’s volleyball
Antonio García-de-Alcaraz
Faculty of Physical Activity and Sport Sciences, Polytechnic University of Madrid, Spain
Enrique Ortega
Faculty of Sport Sciences, University of Murcia, Spain
José M. Palao
University of Wisconsin-Parkside, United States
Abstract––The aim of this study was to analyse the technical-tactical performance proile of blocking and court defence actions for various age groups and categories of competition in men’s volleyball. The sample comprised 16,454 blocks and 8,321 digs performed in 299 sets in several categories of competition (from U-14 to Olympic Games). A descriptive and correlational inter- and intra-group observational design was used. The variables studied were: category of competition, opponent’s spike tempo, and block and dig performance. The results showed a signiicant increase in the percentage of blocks and digs derived from fast attacks and a signiicant improvement in performance of these actions to counteract slow attacks. Thus, improving in blocking and digging performance was observed at higher categories when the attack is performed slowly. This paper discusses various reasons for the evolution in defensive performance and the effects on the training process for various categories of competition in volleyball.
Method
Population and sample
The sample was made up of teams and players participating in matches and sets in Spain´s U-14, U-16, and U-19 men’s championships (2008-2009 season), Spain´s first division (national senior category, 2008-2009 and 2009-2010 seasons), and the 2008 Olympic Games (international senior category). The analysed actions comprised 16,454 blocks and 8,321 digs. These actions were played by 99 teams in 299 sets. Fifty-nine sets were randomly selected from the Olympic Games, while sixty sets were randomly selected from the other categories. The sets were stratiied in terms of “performance level” (one of three rankings) and “quality of opposition” (six different options according to rival’s level of performance). Given the different structure of the ifth set (FIVB, 2008), it was not included in the sample.
All matches were video recorded after the organizing com-mittee had given consent. In the case of the Olympics, matches were not ilmed, but downloaded from open online channels such as NBC. The process did not affect players´ and teams´ spontaneous behaviour, as ilming is a common, non-invasive procedure typically used by coaches. This study complied with
the Bioethics Commission of the University of Murcia (Spain) and with the ethical principles stated by the Declaration of Helsinki.
Design
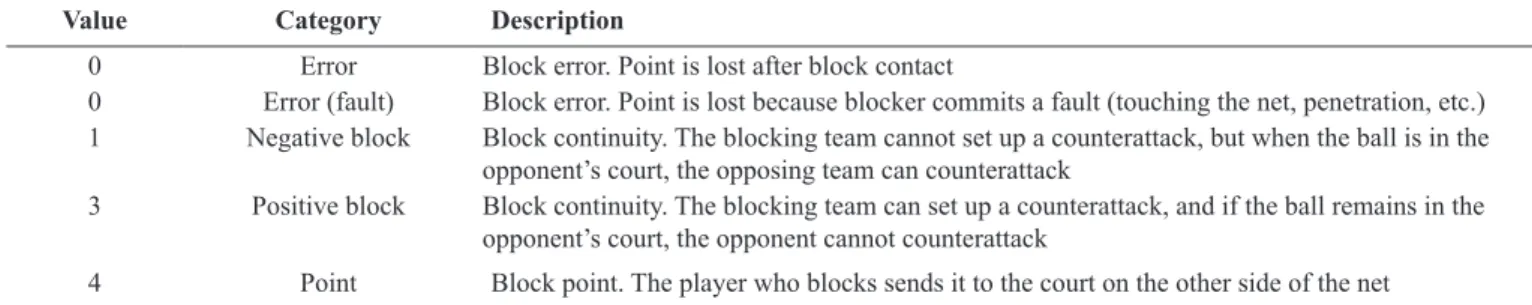
A descriptive, correlational, observational (nomothetic, intra sessional, and multidimensional) design were implemented through of a category system (Anguera, 2003). The study´s variables were: a) category of competition (U-14, U-16, U-19, national senior, and international senior); b) attack tempo (irst, second, or third tempo); and c) the performance of the block and dig. A irst, second, or third tempo block or dig was an action or attempted action responding to a irst, second, or third tempo spike, respectively. Block and dig performance were measured in terms of the defending team’s ability to counterattack under the best possible conditions. The performance of the block was measured in terms of the opponent’s ability to continue the play when the ball is returned to their court or in terms of the defending team’s ability to continue the play when the ball remains in their court (Table 1). Performance of the dig was measured in terms of the defending team’s ability to continue the play (Table 2).
Value Category Description
0 Error Block error. Point is lost after block contact
0 Error (fault) Block error. Point is lost because blocker commits a fault (touching the net, penetration, etc.)
1 Negative block Block continuity. The blocking team cannot set up a counterattack, but when the ball is in the
opponent’s court, the opposing team can counterattack
3 Positive block Block continuity. The blocking team can set up a counterattack, and if the ball remains in the opponent’s court, the opponent cannot counterattack
4 Point Block point. The player who blocks sends it to the court on the other side of the net
Table 1. Variables for block performance.
Table 2. Variables for dig performance.
Value Category Description
0 Error Dig error. Point is lost after dig contact
1 Negative dig Dig continuity. The digging team continues the play but is not able to set up a counterattack, or the ball is sent
to the opponent’s court after digging
3 Positive dig Dig continuity. The digging team continues the play and maintains the possibility of setting up a counterat-tack
Procedure and instruments
Competitions were recorded on video cameras placed at the end of the court and at a height higher than the net, except for the matches from the Olympic Games where ilming took place from the sides and back of the court. It was ensured that the oficial court area (18 x 9 m) would be recorded, at a minimum, to allow clear viewing of all actions. Regular video cameras positioned on tripods and plugged in with extension cords were used. For the national senior category, matches were also downloaded from an oficial website.
analysis, and in the use of the observational software used in this study, and who held the highest national coach certiication. For the inter-observer reliability analysis, 25% of sets from the national senior category were randomly selected and observed. Analyses showed a reliability of 0.865 for blocking and 0.820 for court defence. For intra-reliability analysis, 20% of sets from each category of competition were randomly selected and observed. Analyses showed a reliability of 0.872 for blocking and 0.864 for court defence.
While observing, variables were recorded with the Data Volley software (Data Volley 2007, Data Project Sport Software, Bologna, Italy). Recorded actions were then synchronised with video images by means of Data Video (Data Video 2007, Data Project Sport Software, Bologna, Italy), so that the quality of the data could later be analysed. The data were collected and exported from Data Volley 2007 software using the observa -tion tool´s internal spreadsheets. Each spreadsheet contained players´ and teams´ performance during sets. All spreadsheets were merged into a single matrix in which contextual variables (category, team level, type of match, set result, game system, initial line-up, substitutions, and role of players) were added. SPSS 15.0.0 (Statistical Package for the Social Sciences, IBM, Armonk, United States) was used for descriptive and inferential analyses. The sample size was analysed in order to check the stability of data (Hughes & Daniel, 2003). For all tested catego-ries, stability occurred starting at the 17th set, in the case of the block, and starting at the 10th set, in the case of court defence.
Statistical analysis
A descriptive analysis for the various actions and types of actions in every category of competition was performed. Frequency (number of actions or type of actions), relative fre-quency (relative measure for frefre-quency), mean actions (team´s
mean value for the entire set), coeficient (mean value of per -formance of an action or type of action), eficacy (percentage of maximum performance of an action or type of action), eficiency (percentage of maximum value of an action when subtracting errors), and ratios (block point-to-error or positive-dig-to-neg-ative-dig) were calculated. Coeficient, eficacy, eficiency and ratio were calculated using players’ mean values per set. The following inferential tests were performed: a) Kolmogorov-Smirnov test to analyse normality of data; b) Kruskal-Wallis test (p < 0.05) to identify differences among categories; c) Wilcoxon test (p < 0.05) to analyse differences within each category; and d) Mann Whitney U procedure with post hoc Bonferroni (p < 0.01) to analyse speciic differences between categories.
Results
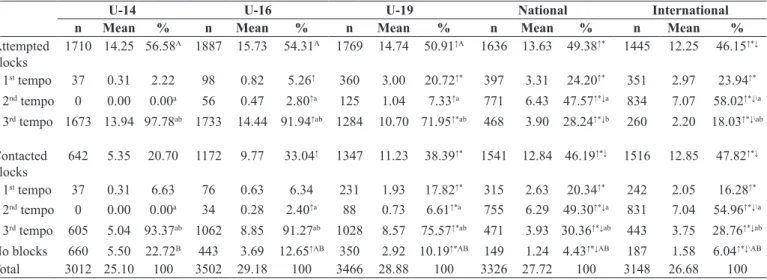
Results showed that at the initial stages (U-14, U-16, and U-19), the percentage of blocks with ball contact was signiicantly lower than the percentage of blocks with no ball contact (Table 3). These differences were not signiicant at later stages. At higher categories, the percentage of ball contacts increased signiicantly. Beginning with the U-14 category, the percentage of attack situations in which there were no block actions decreased signiicantly. The percentage of block attempts decreased signiicantly starting in the U-19 category. Regarding the tempo utilised to block, a predominance of third tempo blocks was observed in initiation stages (U-14, U-16 and U-19), and a predominance of second tempo blocks was observed in the senior stage. In higher categories; however, irst and second tempo blocks increased signiicantly, while third tempo blocks decreased signiicantly. Starting at the U-16 category, all changes were signiicant, except for irst and third tempo blocks, which changed signiicantly starting at the U-19 category.
Table 3. Number of blocks, mean team blocks per set, percentage of blocks per player per set, and statistically signiicant differences among categories.
U-14 U-16 U-19 National International
n Mean % n Mean % n Mean % n Mean % n Mean %
Attempted blocks
1710 14.25 56.58A 1887 15.73 54.31A 1769 14.74 50.91↑A 1636 13.63 49.38↑* 1445 12.25 46.15↑*↓
1st tempo 37 0.31 2.22 98 0.82 5.26↑ 360 3.00 20.72↑* 397 3.31 24.20↑* 351 2.97 23.94↑*
2nd tempo 0 0.00 0.00a 56 0.47 2.80↑a 125 1.04 7.33↑a 771 6.43 47.57↑*↓a 834 7.07 58.02↑*↓\a
3rd tempo 1673 13.94 97.78ab 1733 14.44 91.94↑ab 1284 10.70 71.95↑*ab 468 3.90 28.24↑*↓b 260 2.20 18.03↑*↓\ab
Contacted blocks
642 5.35 20.70 1172 9.77 33.04↑ 1347 11.23 38.39↑* 1541 12.84 46.19↑*↓ 1516 12.85 47.82↑*↓
1st tempo 37 0.31 6.63 76 0.63 6.34 231 1.93 17.82↑* 315 2.63 20.34↑* 242 2.05 16.28↑*
2nd tempo 0 0.00 0.00a 34 0.28 2.40↑a 88 0.73 6.61↑*a 755 6.29 49.30↑*↓a 831 7.04 54.96↑*↓\a 3rd tempo 605 5.04 93.37ab 1062 8.85 91.27ab 1028 8.57 75.57↑*ab 471 3.93 30.36↑*↓ab 443 3.75 28.76↑*↓ab
No blocks 660 5.50 22.72B 443 3.69 12.65↑AB 350 2.92 10.19↑*AB 149 1.24 4.43↑*↓AB 187 1.58 6.04↑*↓\AB
Total 3012 25.10 100 3502 29.18 100 3466 28.88 100 3326 27.72 100 3148 26.68 100
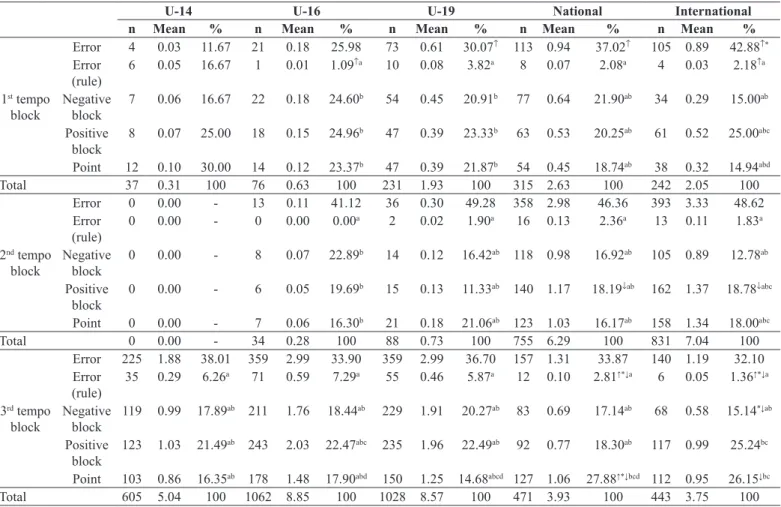
When analysing the performance of irst tempo blocks (Table 4), a predominance of block points in the U-14 category and of block errors in the other categories were observed. Block errors increased signiicantly beginning in the U-19 category, while block errors due to faults decreased signiicantly starting at U-16. When analysing the perfor -mance of second tempo blocks (Table 4), a predominance of block errors in all categories was found, except for the U-14 category in which there were no such attacks. A statistically
signiicant increase in positive blocks was detected when comparing senior categories (national and international) with U-19. As to the performance of third tempo blocks (Table 4), a predominance of block errors in all categories was observed. Regarding the national category, the evolution of performance of third tempo blocks showed a statistically signiicant decrease in errors due to faults and negative blocks. In contrast, a statistically signiicant increase in block points was found.
Table 4. Performance of contacted blocks with regard to spike tempo, and statistically signiicant differences between categories.
U-14 U-16 U-19 National International
n Mean % n Mean % n Mean % n Mean % n Mean %
1st tempo block
Error 4 0.03 11.67 21 0.18 25.98 73 0.61 30.07↑ 113 0.94 37.02↑ 105 0.89 42.88↑* Error
(rule)
6 0.05 16.67 1 0.01 1.09↑a 10 0.08 3.82a 8 0.07 2.08a 4 0.03 2.18↑a
Negative
block
7 0.06 16.67 22 0.18 24.60b 54 0.45 20.91b 77 0.64 21.90ab 34 0.29 15.00ab
Positive block
8 0.07 25.00 18 0.15 24.96b 47 0.39 23.33b 63 0.53 20.25ab 61 0.52 25.00abc
Point 12 0.10 30.00 14 0.12 23.37b 47 0.39 21.87b 54 0.45 18.74ab 38 0.32 14.94abd
Total 37 0.31 100 76 0.63 100 231 1.93 100 315 2.63 100 242 2.05 100
2nd tempo block
Error 0 0.00 - 13 0.11 41.12 36 0.30 49.28 358 2.98 46.36 393 3.33 48.62
Error (rule)
0 0.00 - 0 0.00 0.00a 2 0.02 1.90a 16 0.13 2.36a 13 0.11 1.83a
Negative
block
0 0.00 - 8 0.07 22.89b 14 0.12 16.42ab 118 0.98 16.92ab 105 0.89 12.78ab
Positive block
0 0.00 - 6 0.05 19.69b 15 0.13 11.33ab 140 1.17 18.19↓ab 162 1.37 18.78↓abc
Point 0 0.00 - 7 0.06 16.30b 21 0.18 21.06ab 123 1.03 16.17ab 158 1.34 18.00abc
Total 0 0.00 - 34 0.28 100 88 0.73 100 755 6.29 100 831 7.04 100
3rd tempo block
Error 225 1.88 38.01 359 2.99 33.90 359 2.99 36.70 157 1.31 33.87 140 1.19 32.10 Error
(rule)
35 0.29 6.26a 71 0.59 7.29a 55 0.46 5.87a 12 0.10 2.81↑*↓a 6 0.05 1.36↑*↓a
Negative
block
119 0.99 17.89ab 211 1.76 18.44ab 229 1.91 20.27ab 83 0.69 17.14ab 68 0.58 15.14*↓ab
Positive block
123 1.03 21.49ab 243 2.03 22.47abc 235 1.96 22.49ab 92 0.77 18.30ab 117 0.99 25.24bc
Point 103 0.86 16.35ab 178 1.48 17.90abd 150 1.25 14.68abcd 127 1.06 27.88↑*↓bcd 112 0.95 26.15↓bc
Total 605 5.04 100 1062 8.85 100 1028 8.57 100 471 3.93 100 443 3.75 100
Note.↑p < .01 when compared to U-14. *p < .01 when compared to U-16. ↓p < .01 when compared to U-19. \p < .01 when compared to national category. a
Signiicant differences when compared to “error”. b Signiicant differences when compared to “rule error”. c Signiicant differences when compared to “negative
block”. d Signiicant differences when compared to “positive block”.
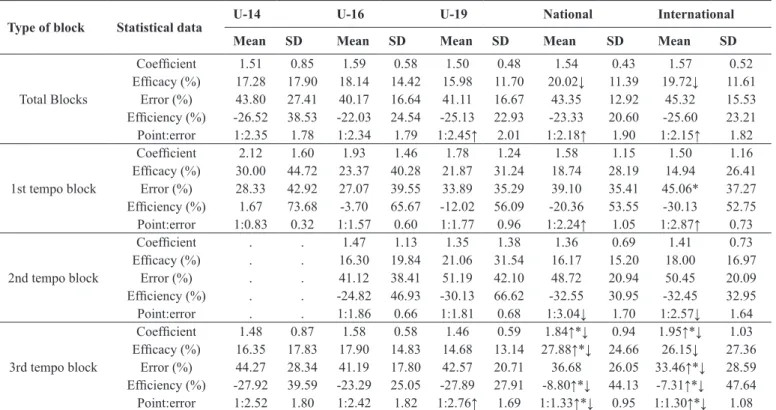
As for statistical parameters of total blocks (Table 5), a statistically signiicant decrease in the block point-to-error ratio between U-14 and senior categories (national and international) and a statistically signiicant increase in this same variable be -tween U-14 and U-19 were found. Also, a statistically signiicant increase in eficacy starting at the national senior category was found. When analysing statistical parameters of irst and second tempo blocks, there was a signiicant increase in the block point-to-error ratio as of the national senior category. Furthermore, there was a signiicant increase in the percentage of errors in irst tempo blocks between the U-16 and international senior categories. Regarding the third tempo block, an increase in the coeficient, eficacy, and eficiency beginning with the senior
national category was observed, while a statistically signiicant decrease in percentage of error (between the initiation categories and the international senior category) and in the block point-to-error ratio (beginning with U-19) was also observed.
signiicant increase in digs for irst and second tempo attacks and a statistically signiicant decrease in digs for third tem -po attacks were observed. These changes were signiicant
beginning with U-16, except for irst and third tempo digs with ball contact, which increased signiicantly from the U-19 category upwards.
Table 5. Block performance values and statistically signiicant differences between categories.
Type of block Statistical data
U-14 U-16 U-19 National International
Mean SD Mean SD Mean SD Mean SD Mean SD
Total Blocks
Coeficient 1.51 0.85 1.59 0.58 1.50 0.48 1.54 0.43 1.57 0.52
Eficacy (%) 17.28 17.90 18.14 14.42 15.98 11.70 20.02↓ 11.39 19.72↓ 11.61
Error (%) 43.80 27.41 40.17 16.64 41.11 16.67 43.35 12.92 45.32 15.53
Eficiency (%) -26.52 38.53 -22.03 24.54 -25.13 22.93 -23.33 20.60 -25.60 23.21
Point:error 1:2.35 1.78 1:2.34 1.79 1:2.45↑ 2.01 1:2.18↑ 1.90 1:2.15↑ 1.82
1st tempo block
Coeficient 2.12 1.60 1.93 1.46 1.78 1.24 1.58 1.15 1.50 1.16
Eficacy (%) 30.00 44.72 23.37 40.28 21.87 31.24 18.74 28.19 14.94 26.41
Error (%) 28.33 42.92 27.07 39.55 33.89 35.29 39.10 35.41 45.06* 37.27
Eficiency (%) 1.67 73.68 -3.70 65.67 -12.02 56.09 -20.36 53.55 -30.13 52.75
Point:error 1:0.83 0.32 1:1.57 0.60 1:1.77 0.96 1:2.24↑ 1.05 1:2.87↑ 0.73
2nd tempo block
Coeficient . . 1.47 1.13 1.35 1.38 1.36 0.69 1.41 0.73
Eficacy (%) . . 16.30 19.84 21.06 31.54 16.17 15.20 18.00 16.97
Error (%) . . 41.12 38.41 51.19 42.10 48.72 20.94 50.45 20.09
Eficiency (%) . . -24.82 46.93 -30.13 66.62 -32.55 30.95 -32.45 32.95
Point:error . . 1:1.86 0.66 1:1.81 0.68 1:3.04↓ 1.70 1:2.57↓ 1.64
3rd tempo block
Coeficient 1.48 0.87 1.58 0.58 1.46 0.59 1.84↑*↓ 0.94 1.95↑*↓ 1.03
Eficacy (%) 16.35 17.83 17.90 14.83 14.68 13.14 27.88↑*↓ 24.66 26.15↓ 27.36
Error (%) 44.27 28.34 41.19 17.80 42.57 20.71 36.68 26.05 33.46↑*↓ 28.59
Eficiency (%) -27.92 39.59 -23.29 25.05 -27.89 27.91 -8.80↑*↓ 44.13 -7.31↑*↓ 47.64
Point:error 1:2.52 1.80 1:2.42 1.82 1:2.76↑ 1.69 1:1.33↑*↓ 0.95 1:1.30↑*↓ 1.08
Note.↑p < .01 when compared to U-14. *p < .01 when compared to U-16. ↓p < .01 when compared to U-19. \p < .01 when compared to national category.
Table 6. Number of digs, mean team digs per set, percentage of digs per player per set, and statistically signiicant differences between categories.
U-14 U-16 U-19 National International
n Mean % n Mean % n Mean % n Mean % n Mean %
Non-con
-tacted dig
344 2.87 18.42A 389 3.24 20.68A 362 3.02 22.01A 500 4.17 34.19↑*↓A 544 4.61 38.73↑*↓A
1st tempo 19 0.16 5.72 54 0.45 13.35↑ 94 0.78 25.67↑* 182 1.52 37.74↑*↓ 175 1.48 31.39↑* 2nd tempo 0 0.00 0.00a 14w 0.12 3.96↑a 31 0.26 6.91↑a 221 1.84 43.64↑*↓ 306 2.59 57.28↑*↓\a
3rd tempo 325 2.71 94.28ab 321 2.68 82.69↑ab 237 1.98 67.42↑*ab 97 0.81 18.61↑*↓ab 63 0.53 11.32↑*↓\ab Contacted
digs
1592 13.27 81.58 1481 12.34 79.32 1256 10.47 77.99 998 8.32 65.81↑*↓ 855 7.25 61.27↑*↓
1st tempo 114 0.95 6.80 115 0.96 7.68 258 2.15 20.81↑* 218 1.82 22.21↑* 172 1.46 20.19↑*
2nd tempo 0 0.00 0.00a 38 0.32 2.33↑a 72 0.60 6.28↑a 444 3.70 44.67↑*↓a 448 3.80 51.44↑*↓\a
3rd tempo 1478 12.32 93.20ab 1328 11.07 89.99ab 926 7.72 72.90↑*ab 336 2.80 33.13↑*↓ab 235 1.99 28.37↑*↓ab Total 1936 16.13 100 1870 15.58 100 1618 13.48 100 1498 12.48 100 1399 11.86 100
Note.↑p < .01 when compared to U-14. *p < .01 when compared to U-16. ↓p < .01 when compared to U-19. \p < .01 when compared to national category. A
Signiicant differences when compared to “Contacted digs”. a Signiicant differences when compared to “1st tempo dig”. b Signiicant differences when compared
to “2nd tempo dig”.
When analysing irst tempo digs (Table 7), predominance of positive digs in U-14, U-16, and U-19 and of dig errors in the senior national and international categories were observed. An increase in errors beginning at U-19 and a statistically signiicant decrease in negative and positive digs starting at the national
were observed. Regarding the analysis of third tempo digs (Table 7), a predominance of positive digs in all categories was observed. There was a signiicant decrease in dig errors (between the U-14 and international senior categories) as well as in negative digs (starting with the U-19 category). On the other hand, an increase in positive digs beginning with the U-16 category was observed.
When analysing the statistical data of the total num-ber of digs and irst tempo digs (Table 8), there was a signiicant increase in the percentage of error and in the positive-dig-to-negative-dig ratio as well as a signiicant decrease in the coeficient, eficiency, and effectiveness. All
these changes were signiicant starting at the national senior level, except for the irst tempo defence ratio variable, which showed a signiicant increase in the beginning at the U-19 category. For the second tempo dig, a signiicant increase in the positive-dig-to-negative-dig ratio between the national category and U-16 was observed. For the third tempo de-fence, there were an increase in the coeficient, eficiency (starting at U-19), and eficiency (starting with the national category) and decrease in the percentage of errors (for the international senior category) and in the ratio (starting at the national category).
Table 7. Performance of contacted digs with regard to spike tempo, and statistically signiicant differences between categories.
U-14 U-16 U-19 National International
n Mean % n Mean % n Mean % n Mean % n Mean %
1st tempo dig
Error 22 0.18 17.63 29 0.24 21.64 79 0.66 30.48↑ 118 0.98 55.15↑*↓ 89 0.75 53.83↑*↓
Negative dig 2 9 0.24 25.72 27 0.23 23.23 63 0.53 23.55 32 0.27 13.72↓a 15 0.13 7.87↑*↓a
Positive dig 63 0.53 56.64ab 59 0.49 55.13ab 116 0.97 45.98b 68 0.57 31.13↑*↓ab 68 0.58 38.30↑b
Total 114 0.95 100 115 0.96 100 258 2.15 100 218 1.82 100 172 1.46 100
2nd tempo dig
Error 0 0.00 - 14 0.12 40.08 37 0.31 54.97 227 1.89 52.66 222 1.88 48.47
Negative dig 0 0.00 - 13 0.11 36.31 13 0.11 21.78 70 0.58 14.31a 58 0.49 13.87a
Positive dig 0 0.00 - 11 0.09 23.61 22 0.18 23.25 147 1.23 33.03ab 168 1.42 37.65b
Total 0 0.00 - 38 0.32 100 72 0.60 100 444 3.70 100 448 3.80 100
3rd tempo dig
Error 405 3.38 30.11 351 2.93 25.77 238 1.98 27.26 89 0.74 28.39 52 0.44 25.60↑
Negative dig 408 3.40 26.58 329 2.74 24.60 203 1.69 20.29↑a 47 0.39 13.31↑*↓a 20 0.17 7.81↑*↓a
Positive dig 665 5.54 43.31ab 648 5.40 49.63↑ab 485 4.04 52.45↑ab 200 1.67 58.29↑ab 163 1.38 66.59↑*↓ab
Total 1478 12.32 100 1328 11.07 100 926 7.72 100 336 2.80 100 235 1.99 100
Note.↑p < .01 when compared to U-14. *p < .01 when compared to U-16. ↓p < .01 when compared to U-19. \p < .01 when compared to national category. a
Signiicant differences when compared to “error”. b Signiicant differences when compared to “negative dig”.
Table 8. Dig performance values and statistically signiicant differences among categories Types of court
defence
Statistical data U-14 U-16 U-19 National International
Mean SD Mean SD Mean SD Mean SD Mean SD
Total dig
Coeficient 1.59 0.51 1.72 0.48 1.69 0.52 1.37↑*↓ 0.55 1.50* 0.62
Eficacy (%) 44.33 17.80 48.90 17.82 49.31 19.18 41.24*↓ 19.06 46.55 21.65
Error (%) 29.31 18.52 26.33 15.35 29.93 17.22 45.40↑*↓ 19.86 42.74↑*↓ 20.88
Eficiency (%) 15.07 33.73 22.57 30.52 19.29 33.84 -4.11↑*↓ 36.62 3.78*↓ 40.56
Positive:error ratio 1:0.59 0.76 1:0.55 0.84 1:0.57 1.03 1:1.05↑*↓ 1.23 1:0.91↑*↓ 1.22
1st tempo dig
Coeficient 1.96 1.06 1.89 1.16 1.61 1.03 1.07↑*↓ 1.08 1.23↑* 1.17
Eficacy (%) 56.65 43.30 55.12 45.15 45.98 38.95 31.11↑*↓ 36.87 38.29↑ 39.88
Error (%) 17.62 31.68 21.65 37.30 30.43↑ 35.22 55.17↑*↓ 40.94 53.84↑*↓ 41.86
Eficiency (%) 39.01 65.48 33.50 73.40 15.49 66.35 -24.01↑*↓ 72.89 -15.53↑*↓ 78.42
Positive:error ratio 1:0.35 0.45 1:0.49 0.61 1:0.68↑* 0.55 1:1.74↑* 1.01 1:1.31↑* 0.86
2nd tempo dig
Coeficient . . 1.07 1.02 0.92 0.95 1.13 0.79 1.27 0.89
Eficacy (%) . . 23.62 37.65 23.23 31.96 33.03 27.86 37.65 31.30
Error (%) . . 40.05 42.79 54.97 43.29 52.67 29.23 48.48 30.61
Eficiency (%) . . -16.43 68.69 -31.73 66.45 -19.64 52.98 -10.83 58.67
Positive:error ratio . . 1:1.27 0.47 1:1.68 1.61 1:1.54* 1.27 1:1.32 0.92
3rd tempo dig
Coeficient 1.57 0.53 1.74 0.47 1.78↑ 0.61 1.88↑ 0.98 2.08↑*↓ 1.03
Eficacy (%) 43.35 18.67 49.65 18.19 52.48↑ 22.46 58.30↑ 35.26 66.61↑*↓ 36.02
Error (%) 30.12 19.18 25.81 15.57 27.29 20.12 28.40 32.43 25.57↑ 34.44
Eficiency (%) 13.19 35.17 23.88 29.97 25.16 39.44 29.94↑ 63.86 40.97↑*↓ 67.65
Positive:error ratio 1:0.61 0.99 1:0.54 0.79 1:0.49 0.88 1:0.45↑*↓ 0.54 1:0.32↑*↓ 0.45
Discussion
This study demonstrates the technical-tactical performance proile of blocking and court defence depending on attack tempo at various age groups and categories of competition in men’s vol-leyball. As the category increases, there is a signiicant increase in block and court defence for irst and second tempo spikes and a signiicant decrease in these actions for third tempo spikes, with or without contact with the ball. Regarding performance, only the block and court defence for third tempo spikes showed increased eficiency (block points and digs which allow a team to set up their counterattack).
An increase in contacted blocks when progressing to higher categories may be related to players´ anthropometric development and physical abilities (Grgantov et al., 2006). Physical improve-ments would restrain the spike; thus increasing the percentage of contacted blocks. However, players´ development may not be enough to prevent a decline in the percentage of contacted digs which occur when the ball avoids a block and heads toward the opponent’s court. When comparing blocks and digs, the percent-age of ball contacts for digs is greater than the percentpercent-age of ball contacts for blocks throughout all categories. This could be related to a shortage of time to set up a block depending on how close one is to the opponent’s spike. Thus, the proximity of blockers to the spike would hinder their perception and interception of the ball and its path, while defenders would have more time to identify and respond to it (Selinger & Ackerman-Blount, 1985).
An increase in blocks and digs for irst and second tempo spikes (contacted and non-contacted) demonstrates that the high-er the category, the highhigh-er the speed of play. This is positively affected by an improvement in reception and court defense performance which occurs in higher ages and categories of competition (García-Alcaraz, Palao, & Ortega, 2014; Grgantov et al., 2006). An increase in the speed of the game may reduce the time available for defensive actions, thus limiting both the number of players who may block (Afonso, Mesquita, & Palao, 2005) and the defensive moves (Afonso et al., 2005, 2010; Selinger & Ackermann-Blount, 1985). This limitation of perception and execution on defensive actions is intended to counteract the increase in the height of the net (FIVB, 2008), the increase in the height of the players, and the development of players´ physical abilities (e.g. jump, speed, etc.) (Grgantov et al., 2006), which are variables that may favour the performance of defensive actions when progressing to higher categories.
Regarding the performance of the block and court defence, there was a signiicant improvement in performance for slow attacks when analysing higher categories. This may be related to the amount of time available for defenders to execute their defensive actions. Previous studies have demonstrated that a shortage in time determines players´ defensive moves (Afonso et al., 2010; Afonso et al., 2005; Selinger & Ackermann-Blount, 1985), thus limiting the execution of a cohesive block (Bergeles & Nikolaidou, 2011) and the number of blockers (Afonso et al., 2005). On the other hand, an increase in time for slow attacks fosters anticipation, decision-making, and players´ moves when blocking and defending. This is because slow attack times are related to low-performance receptions (Papadimitriou, Paschali,
Sermaki, Mellas, & Papas, 2004), which limit the options for at-tacking and determine the setting zone, thus promoting the set-up of a block with a larger number of players (Afonso et al., 2005). An improvement in performance of court defence in slow attacks may also be due to the relationship between court defence (i.e. the second line of defence) and the block (i.e. the irst line of defence). Increasing the number of blockers (Afonso et al., 2005), or setting up a more cohesive block (Bergeles & Nikolaidou, 2011), reduces the number of trajectories of attack aimed at areas not covered by defenders, thus facilitating the performance of court defence.
The signiicant improvement in performance of blocks and court defence for slow attacks may explain the signiicant decrease in the percentage of blocks and digs contacted in slow attacks. Regarding the block, this decline would be related to the spiker´s performance, particularly in one´s ability to avoid getting blocked. Thus, the increase in training and players´ experience as they pro-gress to higher categories would improve their ability to spike. In contrast, temporal limitations of the block in fast attacks would be an advantage for spikers, who may perform better when attacking against this limited block. In this regard, Rocha and Barbanti (2004) found an increase in the attack´s eficacy when the ball contacts the block, although the attack tempo is not speciied. As for defence, a signiicant increase in the percentage of contacted digs in fast attacks (irst and second tempo) may be related to a decrease in the number of blockers (Afonso et al., 2005), which promotes the increase in the number of balls headed toward diggers.
These results present the performance proile of blocking and court defence according to attack tempo in various categories of competition. The data provide reference values which may be useful when setting training and competition objectives for the various categories. Due to the relationship between defensive actions and attack tempo and between attack tempo and perfor-mance in previous actions (i.e. reception/defence and set) (Eom & Schutz, 1992), there is a need for further research on the effect of these variables on block and court defence performance. Thus, the attack that is set up upon receiving the ball is different in terms of offensive actions that are set up from a team’s defence, mainly due to the setter’s location and the spikers’ availability to counterattack as quickly as possible (Castro & Mesquita, 2010). Variables such as spike direction distance between the point where the spiker hits the ball and the blocker positions his hands, ball speed, number of blockers, defence area, player role, set momentum, etc., may also need further analysis.
Conclusions
categories of competition. These values may help to develop training programs, assess performance in competition, and expand knowledge about variables that describe performance. Nevertheless, the complex interaction of defensive actions with other game variables, such as attack time, attack zone, height of block, etc., requires further study which would fulil a gap in current knowledge of performance variables.
References
Afonso, J., & Mesquita, I. (2011). Determinants of block cohesiveness
and attack eficacy in high-level women’s volleyball. European
Journal of Sport Science, 11(1), 69-75.
Afonso, J., Mesquita, I., & Palao, J.M. (2005). Relationship between the tempo and zone of spike and the number of blockers against the hitters. International Journal of Volleyball Research, 8(1), 19-23. Afonso, J., Mesquita, I., Marcelino, R., & Da Silva, J.A. (2010).
Analysis of the setter’s tactical action in high-performance wom-en’s volleyball. Kinesiology, 42, 82-89.
Anguera, M.T. (2003). Diseños observacionales en la actividad física y el deporte: estructura, alcance y nuevas perspectivas. In A. Oña, & A. Bilbao (Eds.), II Congreso Mundial de Ciencias de la Actividad Física y el Deporte: Deporte y Calidad de vida (pp. 253-282).
Granada (Spain): Gráicas Alhambra.
Bergeles, N., & Nikolaidou, M E. (2011). Setter’s performance and
attack tempo as determinants of attack eficacy in Olympic-level
male volleyball teams. International Journal of Performance Analysis in Sport, 11(3), 535-544.
Castro, J.M., & Mesquita, I. (2010). Analysis of the attack tempo determinants in volleyball’s complex II: A study on elite male teams. International Journal of Performance Analysis in Sport, 10(3), 197-206.
Castro, J.M., Souza, A., & Mesquita, I. (2011). Attack eficacy in volleyball: Elite male teams. Perceptual and Motor Skills, 113(2), 395-408.
Costa, G., Caetano, J., Neiva, N., Junqueira, G., Afonso, J., Costa, P.,
& Mesquita, I. (2011). Determinants of attack tactics in youth male elite volleyball. International Journal of Performance Analysis in Sport, 11(1), 96-104.
Eom, H. J., & Schutz, R.W. (1992). Statistical analyses of volleyball team performance. Research Quarterly for Exercise and Sport, 63(1), 11-18.
FIVB (2008). Reglas oiciales del voleibol [Oficial volleyball rules].
Retrieved from www.rfevb.com.
García-Alcaraz, A., Palao, J.M., & Ortega, E. (2014). Peril de ren -dimiento técnico-táctico de la recepción en función de la categoría de competición en voleibol masculino. Kronos, 13(1). Retrieved
from http://g-se.com/es/journals/kronos/articulos/peril-de-ren - dimiento-tecnico-tactico-de-la-recepcion-en-funcion-de-la-cate-goria-de-competicion-en-voleibol-masculino-1706
Grgantov, Z., Katic, R., & Jankovic, V. (2006). Morphological charac
-teristics, technical and situation eficacy of young female volleyball
players. Collegium Antropologicum, 1, 87-96.
Hughes, M.D., & Daniel, R. (2003). Playing patterns of elite and non-elite volleyball. International Journal of Performance Analysis in Sport, 3(1), 50-56.
Malina, R.M., & Bouchard, C. (1991). Growth, maturation, and phys-ical activity. Champaign, IL: Human Kinetics.
Palao, J. M., Santos, J.A., & Ureña, A. (2007). Effect of the manner of spike execution on spike performance in volleyball. International Journal of Performance Analysis in Sport, 7(2), 126-138. Papadimitriou, K., Paschali, E., Sermaki, I., Mellas, S., & Papas, M.
(2004). The effect of the opponents’ serve on the offensive actions of Greek setters in volleyball games. International Journal of Performance Analysis in Sport, 4(1), 23-33.
Rocha, C., & Barbanti, V.J. (2004). Analysis of factors that inluence the
attack in high level male volleyball. Brazilian Journal of Physical Education and Sport, 18(4), 103-114.
Selinger, A., & Ackermann-Blount, J. (1985). Arie Selinger’s power volleyball. New York: St. Martin Press.
Stamm, R., Stamm, M., & Thomson, K. (2005). Role of adolescent female volleyball players’ psychophysiological properties and body build in performance of different elements of the game. Perceptual and Motor Skills, 101, 108-120.
Stanganelli, L.C.R., Dourado, A.C., Oncken, P., Mançan, S., & Costa, S.C. (2008). Adaptations on jump capacity in Brazilian volleyball players prior to the under-19 world championship. Journal of Strength and Conditioning Research, 22(3), 741-749.
Stone, J. (2002). Digging and ball control. In D. Shondell, & C. Reynaud (Eds.), The volleyball coaching bible (pp. 163-176). Champaign, IL: Human Kinetics.
Author’s note
Antonio García-de-Alcaraz is afiliated with the Department of Sports, Faculty of Physical Activity and Sport Sciences, Polytechnic University of Madrid, Spain.
Enrique Ortega is afiliated with the Department of Physical Activity and Sport, Faculty of Sport Sciences, University of Murcia, Spain.
José M. Palao is afiliated with Department of Health, Exercise Science and Sport Management. University of Wisconsin, Parkside, United States.
Corresponding author
Antonio García de Alcaraz Serrano
Facultad de Ciencias de la Actividad Física y del Deporte, INEF. Departamento de Deportes. C/ Martín Fierro, 7, Spain.
Email: [email protected]
Manuscript received on November 10, 2014 Manuscript accepted on February 10, 2016