Improved Line/Edge Detection and Visual Reconstruction
João Rodrigues
Escola Superior de Tecnologia
J.M.H. du Buf
Vision Laboratory - FCT University of Algarve - Faro, Portugal{jrodrig,dubuf}@ualg.pt
Abstract
Lines and edges provide important information for object categorization and recognition. In addition, one brightness model is based on a symbolic interpretation of the cortical multi-scale line/edge representation. In this paper we present an improved scheme for line/edge extraction from simple and complex cells and we illus-trate the multi-scale representation. This representation can be used for visual reconstruction, but also for non-photorealistic rendering. Together with keypoints and a new model of disparity estimation, a 3D wireframe rep-resentation of e.g. faces can be obtained in the future.
Keywords
Visual cortex; line and edge detection; multi-scale; visual reconstruction; non-photorealistic rendering.
1. INTRODUCTION
Computer graphics, for example (non-)photorealistic rendering (NPR), is closely related to visual perception. Trying to understand perception requires insight into low-level processes in the eyes and visual cortex. In ad-dition, artistic rendering in the style of a certain painter requires insight into the painter's techniques (brushes, strokes, color palettes) and high-level cognitive processes [Zeki00, Livingstone00]. The latter relate to image inter-pretation and certain effects, for example illusions like brightness and color induction, i.e. the opposite effects of simultaneous contrast (a high surround brightness pushes the center towards a lower level) and assimilation (a high surround may also pull up the center brightness), see [du Buf95].
Because such opposite center-surround effects are not yet well understood, there is a need to develop e.g. bright-ness models from which we can learn. Such models must be based on state-of-the-art models of visual representa-tions in the primary cortex: area V1 and beyond.
In this paper we present an improved model for line and edge detection, suitable for modeling brightness and NPR, concentrating on the multi-scale representation, curvature and visual reconstruction. This model is based on simple and complex cells in V1, and complements existing models for end-stopped cells [Heitger92], key-points [Wütz00, Rodrigues04b], saliency for focus-of-attention [Deco04, Rodrigues05a], inhibition [Grigorescu03, Petkov93] and disparity [Fleet91, Rodri-gues04a]. Together, these models provide input for ob-ject and face detection [Rodrigues05a, Rodrigues05b] if embedded into an architecture with ventral and dorsal data streams: the where and what systems [Deco04, Ren-sink00].
2. CELL MODELS AND NCRF INHIBITION
Gabor quadrature filters provide a model of cortical sim-ple cells [Lee96]. In the spatial domain (x, y) they consist of a real cosine and an imaginary sine, both with a Gaus-sian envelope. A receptive field (RF) is denoted by (see e.g. [Grigorescu03]): ⎟ ⎠ ⎞ ⎜ ⎝ ⎛ + ⎟ ⎟ ⎠ ⎞ ⎜ ⎜ ⎝ ⎛ + − = ϕ λ π σ γ ϕ θ σ λ x y x y x G cos 2 ~ 2 ~ ~ exp ) , ( 2 2 2 , , , , (1) ; sin cos
~x =x θ+y θ y~=xcosθ−ysinθ, where the
aspect ratio γ = 0.5 and σ determines the size of the RF. The spatial frequency is 1/λ, λ being the wavelength. For the bandwidth σ/λ we use 0.56, which yields a half-response width of one octave. The angle θ determines the orientation (we use 8 orientations), and φ the phase sym-metry (0 or π/2). We can apply a linear scaling between
min
f and fmaxwith a few discrete scales or hundreds of contiguous scales.
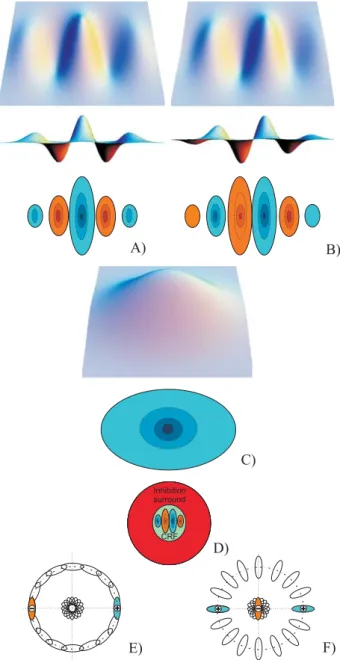
The responses of even (Fig. 1(A)) and odd (Fig. 1(B)) simple cells, which correspond to the real and imaginary parts of a Gabor filter, are obtained by convolving the input image with the RF, and are denoted by RsE,i and
O i s
R, , s being the scale, i the orientation
(
θi =iπ (Nθ−1))
and Nθthe number of orientations. The responses of complex cells (Fig. 1(C)) are modelled by the modulus
( )
,{
( )
,}
{
( )
,}
2. 1 2 , 2 , , x y =⎢⎣⎡R x y + R x y ⎥⎦⎤ C O i s E i s i s (2)Non-classical receptive field (NCRF) inhibition (Fig. 1(D)) can be used to suppress information in textured regions [Grigorescu03]. There are two types: (a)
ani-sotropic, in which only responses obtained for the same preferred RF orientation contribute to the suppression, and (b) isotropic, in which all responses over all orienta-tions equally contribute to the suppression.
Figure 1: 3D and 2D cell representations (see text).
The anisotropic non-classical receptive field inhibition (A-NCRF) model is computed by an inhibition term
A i s
t ,σ, for each orientation i,
σ
σ C w
tsA, ,i = s,i* , (3)
as a convolution of the complex cell response Cs,i with the weighting function wσ, with .1 being the L1 norm
and
[]
.+denotes the suppression of negative values:[
] [
]
1 ) , ( ) , ( = σ + σ + σ x y DoG x y DoG w , (4)( )
( )
⎟ ⎟ ⎠ ⎞ ⎜ ⎜ ⎝ ⎛ + − − ⎟ ⎟ ⎠ ⎞ ⎜ ⎜ ⎝ ⎛ + − = 2 2 2 2 2 2 2 2 2 exp 2 1 4 2 exp 4 2 1 ) , ( σ πσ σ σ π σ y x y x y x DoG (5)The operator bsA,σ,i corresponds to the inhibition of Cs,i, i.e. =
[
− A]
+ i s i s A i s C tb,σ, , α ,σ, , with α controlling the
strength of the inhibition.
The isotropic NCRF (I-NCRF) model is obtained by computing the inhibition term tsI,σ which does not
de-pend on orientation i. For this we construct the maximum
response map of the complex cells C~ =s max
{ }
Cs,i , with1 ,... 0 − = Nθ
i . The isotropic inhibition term tsI,σ is com-puted as a convolution of the maximum response map
s
C~ with the weighting functionwσ , and the isotropic operator is =
[
− A]
+ s s I i s C t b,σ, α ,σ .3. LINE/EDGE DETECTION METHOD
Van Deemter and du Buf [Deemter96] presented a scheme for line and edge detection based on the responses of simple cells. A positive line is detected where REshows a local maximum in the orthogonal fil-ter orientation and RO shows a zero crossing. In the case
of an edge the even and odd responses must be swapped. This gives 4 possibilities for positive and negative events: local maxima/minima plus zero crossings. Rodri-gues and du Buf [RodriRodri-gues04b] combined the responses of simple and complex cells, i.e. simple cells serve to detect positions and event types, whereas complex cells are used to increase the confidence. Since the use of Ga-bor modulus (complex cells) implies some loss of preci-sion at vertices [du Buf93], increased precipreci-sion was ob-tained by considering multiple scales.
The two algorithms described above work reasonably well but there are still a few problems: (a) either one scale is used or only a very few scales for increasing con-fidence, (b) some parameters must be optimized for spe-cific input images or even as a function of scale, (c) de-tection precision can be improved, and (d) dede-tection con-tinuity at highly curved lines/edges must be guaranteed. We present an improved algorithm with no free parame-ters, truly multi-scale, and with new solutions for problems (c) and (d). With respect to precision, simple and complex cells respond beyond line and edge ends, for example beyond the corners of a rectangle. In addi-tion, at line or edge crossings, detection leads to continu-ity of the dominant events and gaps in the sub-dominant events. These gaps must be reduced in order to recon-struct continuity. Both problems can be solved by intro-ducing new inhibition schemes, like the radial and tan-gential ones used in the case of keypoint operators [Rod-rigues04b].
Here we use lateral (L) and cross-orientation (C) inhibi-tion, see Fig. 1(E,F), defined as:
( )
(
)
[
(
)
]
(
)
(
)
[
C , S C , S]
; S , C S , C , , , , , , , , , , , , , , + + + + − − − + − − − + + = i s i s i s i s i s i s i s i s i s i s i s i s L i s d y d x C d y d x C d y d x C d y d x C y x I & & & & & & & & (6)( )
[
( )(
)
( )
, ( )(
2 C , 2 S)
]
, . 2 S 2 , C 2 , , , 2 / , , , , 2 / , , + + + − − + − + + = i s i s N i s i s i s i s N i s E i s d y d x C y x C d y d x C y x I & & & & θ θ (7)where
(
i+Nθ/2)
⊥i, with C&s,i =cosθs,i, S&s,i =sinθs,iand d=0.6s. We can apply the inhibition to the com-plex cell responses, with β controls the strength of the inhibition (normally we use β =1.0),
(
)
[
,( , ) ,( , ) , ( , )]
. , + + − = C x y I x y I x y C)si si β sLi sEi (8)Line/edge (event) detection is achieved by constructing a few cell layers on top of simple and complex cells. The first layer serves to select active regions and domi-nant orientations. At each position responses of complex cells are summed
∑
− = = 1 0 , θ N i i s s C C) ) . (9)and only at positions with C)s not equal to zero an output cell is activated. At active output cells, the dominant ori-entation is selected by gating one complex cell on the basis of non-maximum suppression of C)s,i. The gating is confirmed or corrected by an excitation/inhibition proc-ess of dominant orientations in a local neighborhood. In the second layer, event type and position is determined on the basis of active output cells (1st layer) and gated simple and complex cells. A first cell complex checks simple cells RsE,iand RsO,ifor a local maximum (or
mini-mum by rectification) using a dendritic field size of ±λ/4, λ being the wavelength of the simple cells (Gabor filter). The active output cell is inhibited if there is no maximum or minimum. A second cell complex does exactly the same on the basis of complex cells. A third cell complex gates four types of zero-crossing cells on the basis of simple cells, again on ±λ/4. If there is no zero-crossing, the output cell is inhibited. If there is a zero-crossing, the active cell at the position of the zero-crossing cell deter-mines event position and the active zero-crossing cell determines event type.
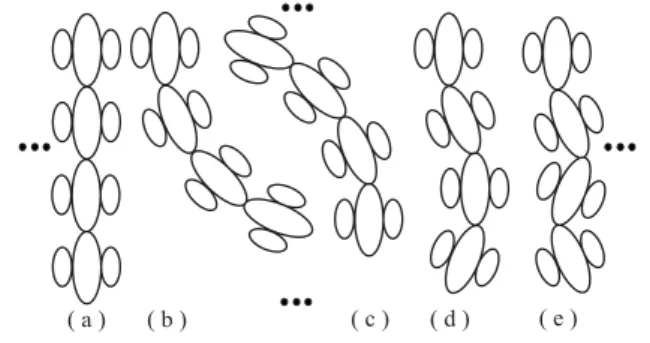
In the third layer, the small loss of accuracy due to the use of complex cells in the second layer is compensated. This is done by correcting local event continuity, consid-ering the information available in the second layer, but by using excitation of output cells by means of grouping cells that combine simple and complex cells tuned to the same and adjacent orientations, see Fig. 2. The latter
process is an extension of linear grouping [Deemter96] and a simplification of using banana wavelets [Krüger97]. In the same layer event type is corrected in small neighborhoods, restoring type continuity, because the cell responses may be distorted by interference ef-fects when two events are very close [du Buf93].
Figure 2: Curvature continuity.
Figure 3 shows four input images together with detection results (positive and negative lines and edges are coded by different gray levels). Detection accuracy is very good and there are many small events due to low-contrast tex-tures (Fig. 3 does not show event amplitudes!) and the fact that there is no threshold value in the detection scheme.
Figure 4 shows results obtained by standard edge-only (!) detection algorithms from computer vision in the case of the orange image with, from left to right: Canny, Nalwa, Bergholm and Iverson [Heath97] (for more results see
http://marathon.csee.usf.edu/edge/edge_detection.html).
Most events in textured regions can be suppressed by NCRF inhibition. Figure 5 shows results obtained by I-NCRF at the finest filter scale. For more results obtained with NCRF we refer to [Grigorescu03], but we note that they developed contour (edge) detection algorithms, whereas we can distinguish between edges and lines with positive and negative polarities. This is necessary for visual reconstruction; see below.
4. MULTI-SCALE REPRESENTATION
Here we focus on the multi-scale representation. Al-though NCRF inhibition can be applied at each scale, we will not do this for two reasons: (a) we want to illustrate line/edge behavior in scale space for applications like face detection and recognition, also visual reconstruction, and (b) in many cases a coarser scale, i.e. increased RF size, will automatically eliminate texture detail.
For illustrating scale space we can create an almost con-tinuous, linear scaling with 320 scales between
40
4≤λ≤ , but here we will present only a few scales in order to show complications. Figure 6 shows events de-tected at five scales in the case of ideal, solid square and star objects. At fine scales (at left) the edges of the square are detected, as are most parts of the star, but not at the very tips of the star. This illustrates an important difference between normal image processing and devel-oping cortical models. The latter must be able to con-struct brightness maps, and at the tips of the star, where two edges converge, there are very fine lines. The same
effect occurs at coarser scales, until entire triangles are detected as lines and even pairs of opposite triangles (right image). In the case of the square, we show me-dium-scale results with little cross-orientation inhibition (edges will continue at the corners). Lines will be de-tected at the diagonals, which will vanish at very coarse scales (also in case of the star object).
Figure 3: Fine-scale line/edge detection (see text).
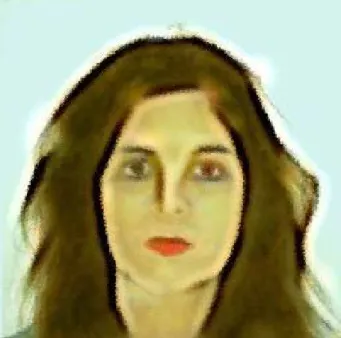
Figure 7 shows the Fiona image with events detected at six scales, with decreasing amount of detail at coarser scales, and the result of a face detection algorithm that only exploits keypoint scale space [Rodrigues05b]. In the future, keypoints and lines/edges will be combined in order to also recognize faces in a database.
Figure 8 shows image reconstructions. These are not based on a complete set of (bandpass) wavelets comple-mented by one lowpass filter, a technique common in image coding, but on a virtual interpretation of lines and
edges: our visual system does not reconstruct in the nor-mal sense, i.e. there is no cortical layer in which cell ac-tivity corresponds to input luminance. An active “line cell” is interpreted as a Gaussian intensity profile with a certain orientation, amplitude and scale, the size of the profile being coupled to the scale of the underlying sim-ple and comsim-plex cells. In the same way an active “edge cell” is interpreted, but with a bipolar, Gaussian-truncated error-function profile. As for image coding, this interpretation must be complemented with a lowpass filter, a process that happens to exist by means of retinal ganglion cells with light-sensitive dendritic fields NOT connected to rods and cones [Berson03].
Figure 4: Edges by Canny, Nalwa, Bergholm and Iverson algorithms.
Figure 5: Line/edge detection with NCRF.
In order to show reconstructions, we must sum the low-pass (LPσ ) plus line (Ls) and edge (Es) representa-tions, using , ) .( ). 1 ( . 1
∑
= + − + = s N s s s s L E W LP R γ σ γ (10)in which γ controlls the balance between lowpass and other information, and Ws the relative weighting of the
different scales. In Fig. 8 we used γ = 0.5 , Ws =1Ns
and 16 equally-spaced scales 4≤λ≤20. As can be seen, reconstructions are quite good. Better results are
obtained when using more filter scales, but optimization requires extensive experiments with different values for
γ and Ws.
Figure 6: Multi-scale representation of a square and a star, left to right λ={4, 12, 18, 24, 40} .
Figure 7: Multi-scale event detection on Fiona.
Figure 8: Reconstruction (see text). 5. DISCUSSION
In this paper we presented an improved scheme for line and edge detection, a scheme that can be used for creat-ing a truly multi-scale image representation suitable for object detection/recognition and visual reconstruction. Faces can already be detected on the basis of the multi-scale keypoint representation, i.e. by grouping keypoints at eyes, nose and mouth [Rodrigues05b], but lines and edges can (must!) complement keypoint information for developing robust face recognition algorithms, for which a cortical architecture of the what and where subsystems was explored by Deco and Rolls [Deco04].
For example, eyes, nose and mouth detectors can be complemented by a detector of the quasi-oval face out-line, which is quite stable over many scales (Fig. 7). More information is available of course: eyebrows and quasi-elliptical mouth and eyes.
With respect to visual reconstruction, the symbolic repre-sentation with Gaussian line profiles and Gaussian-truncated error-function edge profiles, in combination with a lowpass filter, yields a "rendering" that is suitable for extending our brightness model [du Buf95] from 1D to 2D, for example for modeling brightness illusions. Apart from "realistic" rendering in the case of brightness perception, non-photorealistic rendering can be obtained by selecting a few scales in combination with picking a few colors of the input image [Lam05]. Figure 9 shows an example of NPR in which the typical crayon effect was added by Corel’s Photo-Paint standard "impression-ist" filter. In the future we plan to develop real brushes (instead of using the line and edge profiles) and use these along simulated strokes (detected line and edge posi-tions) in order to simulate real oil paintings and water-colors in certain styles, like Van Gogh and Turner.
In the future we can develop 3D wireframe models of objects, including faces, because we already have an op-timized scheme for keypoint extraction [Rodrigues05a], which link lines and edges at vertices, and an initial model for disparity (stereo) [Rodrigues04a] that can be used to attribute depth to keypoints and therefore also to lines and edges. Such extensions are very useful for ana-lyzing automatically facial expressions and to simulate realistic speaking avatars.
Figure 9: NPR rendering of Fiona 6. ACKNOWLEDGEMENTS
This investigation is partly financed by PRODEP III Medida 5, Action 5.3, and by the FCT program POSI, framework QCA III.
7. REFERENCES
[Berson03] D. Berson. Strange vision: ganglion cells as circadian photoreceptors. Trends in Neurosciences, 26(6): 314-320, 2003.
[Deco04] G. Deco and E.T. Rolls. A neurodynamical cortical model of visual attention and invariant object recognition. Vision Res., (44):621–642, 2004. [Deemter96] J.H. van Deemter and J.M.H. du Buf.
Si-multaneous detection of lines and edges using com-pound Gabor filters. Int. J. Patt. Rec. Artif. Intell., 14(6):757–777, 1996.
[du Buf93] J.M.H. du Buf. Responses of simple cells: events, interferences, and ambiguities. Biological Cy-bernetics, 68:321–333, 1993.
[du Buf95] J.M.H du Buf and S. Fischer. Modeling brightness perception and syntactical image coding. Optical Eng., 34(7):1900–1911, 1995.
[Fleet91] D.J. Fleet, A.D. Jepson and M.R.M. Jenkin. Phase-based disparity measurement. CVGIP: Image Understanding, 53(2):198–210, 1991.
[Grigorescu03] C. Grigorescu, N. Petkov and M.A. Wes-tenberg. Contour detection based on nonclassical re-ceptive field inhibition. IEEE Trans. IP, 12(7):729– 739, 2003.
[Heath97] M. Heath, et. al., A robust visual method for assessing the relative performance of edge-detection algorithms. IEEE Tr. PAMI, 19(12):1338-1359, 1997.
[Heitger92] F. Heitger et al. Simulation of neural contour mechanisms: from simple to endstopped cells. Vision Res., 32(5):963–981, 1992.
[Krüger97] N. Krüger and G. Peters. Object recognition with banana wavelets. Proc. 5th Europ. Symp. Artifi-cial Neural Networks, 1997.
[Lam05] R. Lam, J. Rodrigues and J.M.H. du Buf. Artis-tic rendering of the visual cortex. Accepted for: 2nd Workshop Luso-Galaico de Artes Digitais, V. N. de Cerveira (Portugal), 27 August, 2005.
[Lee96] T.S. Lee. Image representation using 2D Gabor wavelets. IEEE Tr. PAMI, 18(10):pp. 13, 1996. [Livingstone00] M. Livingstone. Vision and art: the
biol-ogy of seeing. Abrams, New York (NY), 2000. [Petkov93] N. Petkov, T. Lourens and P. Kruizinga.
Lat-eral inhibition in cortical filters. Proc. Int. Conf. Dig. Sig. Proc. and Inter. Conf. on Comp. Appl. to Eng. Sys., Cyprus:122–129, July 14-16 1993.
[Rensink00] R. Rensink. The dynamic representation of scenes. Visual Cognition, 7(1-3):17–42, 2000. [Rodrigues04a] J. Rodrigues and J.M.H. du Buf. Vision
frontend with a new disparity model. Early Cogn. Vi-sion Workshop, Isle of Skye, Scotland, 28 May - 1 June 2004.
[Rodrigues04b] J. Rodrigues and J.M.H. du Buf. Visual cortex frontend: integrating lines, edges, keypoints and disparity. Proc. Int. Conf. Image Anal. Recogn., Springer LNCS 3211(1):664–671, 2004.
[Rodrigues05a] J. Rodrigues and J.M.H. du Buf. Multi-scale cortical keypoint representation for attention and object detection. In J.S. Marques et al., editors, 2nd Iberian Conf. on Patt. Recogn. and Image Anal, Springer LNCS 3523: 255–262, 2005.
[Rodrigues05b] J. Rodrigues and J.M.H. du Buf. Multi-scale keypoints in V1 and face detection. Accepted for: 1st Int. Symp. Brain, Vision and Artif. Intell., Naples (Italy), 19-21 October, 2005.
[Würtz00] R.P. Würtz and T. Lourens. Corner detection in color images by multiscale combination of end- stopped cortical cells. Image and Vision Computing, 18(6-7):531–541, 2000.
[Zeki00] S. Zeki. Inner vision: an exploration of art and the brain. Oxford Univ. Press, 2000.