Disponível em:
http://editora.unoesc.edu.br/index.php/race Race, Joaçaba, v. 14, n. 1, p. 351-382, jan./abr. 2015
THE LINK BETWEEN EARNINGS
MANAGEMENT AND DIGITAL PATTERN
O elo entre gerenciamento de resultado e padrão digital
Jennifer Martínez Ferrero E-mail: [email protected] Doutora pela Faculdade de Economia e Empresa da Universidade de Salamanca, Espanha; Professora da Universidade de Salamanca – Campus Miguel de
Unamu-no; Avenida Francisco Tomás y Valiente, s/n, 37007, Salamanca. Beatriz Cuadrado Ballesteros
E-mail: [email protected] Doutora pela Faculdade de Economia e Empresa da Universidade de Salamanca, Espanha; Professora da Universidade de Salamanca – Campus Miguel de
Unamu-no; Avenida Francisco Tomás y Valiente, s/n, 37007, Salamanca. Marco Antonio Figueiredo Milani Filho E-mail: [email protected] Pós-doutor pela Faculdade de Economia e Empresa da Universidade de Salaman-ca, Espanha; Doutor em Controladoria e Contabilidade pela Universidade de São Paulo; Professor do Curso de Administração de Empresas da Universidade Estadual de Campinas; Cidade Universitária; Rua Pedro Zaccaria, 1300, Limeira/
SP, 13484-350, Brasil.
R ACE , Unoesc, v . 14, n. 1, p. 351-382, jan./abr . 2015 Abstract
According to Dechow and Dichev (2002) and Lin and Wu (2014), a high degree of earnings management (EM) is associated with a poor quality of information. In this sense, it is possible to assume that the financial data of companies that manage earnings can present different patterns from those with low degree of EM. The aim of this exploratory study is to test whether a financial data set (operating expenses) of companies with high degree of EM presents bias. For this analysis, we used the model of Kothari and the modified model of Jones (“Dechow model” hereafter) to estimate the degree of EM, and we used the logarithmic distribution of data predicted by the Benford’s Law to detect abnormal patterns of digits in number sets. The sample was composed of 845 international listed non-financial companies for the year 2010. To analyze the discrepancies between the actual and expected frequencies of the significant-digit, two statistics were calculated: Z-test and Pearson’s chi-square test. The results show that, with a confidence level of 90%, the companies with a high degree of EM according to the Kothari model presented similar distribution to that one predicted by the Benford’s Law, suggesting that, in a preliminary analysis, their financial data are free from bias. On the other hand, the data set of the organizations that manage earnings according to the Dechow model presented abnormal patterns. The Benford´s Law has been implemented to successfully detect manipulated data. These results offer insights into the interactions between EM and patterns of financial data, and stimulate new comparative studies about the accuracy of models to estimate EM.
Keywords: Earnings management (EM). Financial Reporting Quality (FRQ). Benford’s Law.
O elo entre gerenciamento de resultado e padrão digital
Resumo
Conforme Dechow e Dichev (2002) e Lin e Wu (2014), um alto grau de gerenciamento de resultados (GR) está associado a uma qualidade informacional pobre. Nesse sentido, é possível assumir que os dados financeiros de empresas que gerenciam resultados podem apresentar padrões diferentes daquelas com um baixo grau de GR. O objetivo deste estudo exploratório foi testar se um conjunto de dados financeiros (despesas operacionais) de empresas com alto grau de GR apresentam viés. Para esta análise, utilizou-se o modelo de Kothari e o modelo modificado de Jones (“modelo Dechow”) para estimar o grau de GR e foi usada a distribuição logarítmica de dados predita pela Lei de Benford para detectar padrões digitais anormais em um conjunto numérico. A amostra foi composta por 845 empresas não financeiras listadas em bolsas de valores no ano de 2010. Para analisar as discrepâncias entre as frequências atuais e esperadas do dígito chamado de significativo, dois testes estatísticos foram realizados: o teste Z e o teste Qui-Quadrado. Os resultados mostraram que, com um nível de confiança de 90%, as empresas com alto grau de GR conforme o modelo de Kothari apresentaram distribuição similar àquela predita pela Lei de Benford, sugerindo que, em uma análise preliminar, esses dados não possuem viés. Por outro lado, o conjunto de dados das organizações que gerenciam resultados conforme o modelo Dechow apresentaram padrões anormais. A Lei de Benford tem sido implementada com sucesso para detectar dados manipulados. Esses resultados
R
ACE
, Unoesc, v
. 14, n. 1, p. 351-382, jan./abr
. 2015
oferecem novos elementos sobre as interações entre GR e padrões de dados financeiros, além de estimular novos estudos comparativos sobre a acurácia de modelos para se estimar o GR. Palavras-chave: Gerenciamento de resultados (GR). Qualidade dos Relatórios Financeiros (QRF). Lei de Benford.
1
INTRODUCTION
Financial reports offer relevant elements for the analysis of companies’ assets and economic balance. The financial information disclosed by entities of any nature must meet standards of quality in order to meet the different expectations of their users. Thus, the reliability of the financial data is an important factor for reducing the informational asymmetry between companies and their stakeholders.
According to Dechow and Dichev (2002), a high degree of earnings management (EM) is associated with a poor quality of information, and therefore it is a relevant issue for external users of accounting information.
According to Leclerc et al. (1996, p. 224), the role of auditing is “[…] to add credibility to financial statements and to enhance the effectiveness of accounting communication needed by our economic system.” Under this perspective, the auditing can increase the confidence level of information disclosed. Statistical tests can be used by auditors as analytical procedures in the planning stages of the audit (NIGRINI; MITTERMAIER, 1997).
Benford’s Law (BL) is a useful logarithmic distribution for detecting abnormal patterns in sets of numbers and it has been applied in different areas of knowledge to analyze the frequency of data sets. With the improvement of computational resources, the BL had its use increasingly simplified and practices preliminary audit has shown a simple and effective tool for detecting evidence of errors, illegal or untoward events, such as fraud and managing for results (NIGRINI, 2005).
The general aim of this exploratory study is to test whether a financial variable (operating expenses) of companies with a high degree of EM presents bias according the data distribution predicted by Benford’s Law. In this sense, the research question of this study is: Do the companies with a high degree of earnings management have bias in their financial data?
Considering that there is a gap in the literature regarding the quality of financial information and detection of bias in companies that manage earnings, it is expected that the results of this study contribute to this subject and can foster new investigations in different entities and regions.
R
ACE
, Unoesc, v
. 14, n. 1, p. 351-382, jan./abr
. 2015
2
THEORETICAL FRAMEWORK: EARNINGS
MANAGEMENT AND FINANCIAL REPORTING
QUALITY
2.1 EARNINGS MANAGEMENT (EM)
Accounting scandals that have hit the headlines in the last decade (notably those involving Enron, WorldCom, Xerox and Merck) have generated increasing mistrust among investors regarding the relevance and reliability of published accounting information. In this respect, the earnings management issue has become a concern throughout the world (ISLAM; ALI; AHMAD, 2011). Precisely, the separation between ownership and control can be considered the starting point of EM, which is viewed as a variety of agency cost (DAVIDSON; XIE; XU, 2004). As Ball (2013) noted, given the conflict of interest shareholder versus manager, the cost to be borne by managers for manipulating the result is less than the cost that shareholders have to bear for detecting and penalizing such management. Moreover, because of agency conflict, the existence of asymmetric information makes it particularly difficult for investors to know the real situation of companies (LIN; WU, 2014). This problem is associated with the different availability of information between diverse participants (AKERLOF, 1970). In accordance with them, company directors, acting for their own benefit, carry out actions aimed, not just against shareholders’ interests, in the form of non-optimal investment decisions, but also against those of other interest groups, in order to influence contractual outcomes (HEALY; WAHLEN, 1999; SCOTT, 2009).
According to García-Osma, Noguer e Clemente (2005), EM can be defined as any practice carried out intentionally by company managers, for opportunistic and/or information purposes, to report accounting results that do not correspond to those really achieved. These authors stress that such actions may be either opportunistic or information-related, as proposed also by Schipper (1989), who remained on the sidelines of the debate as to whether EM constitutes exclusively practices that violate generally accepted accounting principles or whether managers may use their discretionary powers, overstating or understating results, without violating these principles. In accordance with Gao (2013) managers could engage in EM activities to influence the characteristics of a transaction without improving its economic substance. But it is necessary to note that this EM can distort the
R
ACE
, Unoesc, v
. 14, n. 1, p. 351-382, jan./abr
. 2015
financial picture of the firm (, 2013). With increasing managerial discretion by EM actions, thus distorting the signal value of earnings, the earnings quality and then, the financial reporting quality is reduced (NELSON; SKINNER, 2013).
Earnings Management practices are proxied by management accruals (AEM) and real measures (REM) in order to determine whether results vary depending on earnings practices. Although the choice of one EM instrument or another depends on various factors – the aim pursued, the accounting rules applicable and business-sector characteristics, among others (GARCÍA-OSMA; NOGUER; CLEMENTE, 2005; DATTA; ISKANDAR-DATTA; SINGH, 2013) – managers prefer instruments which are readily available and low cost, like AEM, or, in contrast, selected REM instruments that are less visible to investors, the market, auditors and other stakeholders. EM via discretionary accruals is a manager›s instrument for changing shareholders and stakeholders’ expectations (Maranjory et al., 2013).
Managers can choose between AEM and REM actions according to which ones are less costly and less visible to investors and to the market (KIM; LISIC; PEVZNER, 2011). According to Zang (2012), decisions to manage earnings through “real” actions precede those to manage earnings through accruals. REM could be detrimental to firms’ competitiveness and future value (GARCÍA-OSMA; NOGUER; CLEMENTE, 2005). However, it has been suggested that the manipulation of real activities is also widespread (GRAHAM; HARVEY; RAJGOPAL, 2005) because it is more difficult for auditors and regulatory bodies to detect REM than AEM, because REM is associated with operating, investing and financing activities (COHEN; ZAROWIN, 2010).
Managers have diverse reasons for manipulating accounting results. Thus, according to Roychowdhury (2006), real activities are misreported in order to avoid reporting annual losses, while Gargouri, Shabou and Francoeur (2010), in their study of Canadian companies, found that managers may seek to smooth out income flows, to minimise the tax burden, to effect changes in the control of the company, to influence labour negotiations or to respond to takeover bids. Moreover, in accordance with Hazarika, Karpoffet and Nahata (2012), managers could be tending to distort their firms’ reported financial performance in order to increase their compensation and gains through stock sales (BURGSTAHLER; DICHEV, 1997; GUNNY, 2010). In order to summarize these motivations, Healy and Wahlen (1999) classified these motivations as contractual, political/governmental and valuation-based.
R
ACE
, Unoesc, v
. 14, n. 1, p. 351-382, jan./abr
. 2015
Firstly, in relation to contractual motivations, the higher the debt ratio of a company, the more likely that its managers will select accounting practices that transfer future profits to the present (KIM; LISIC; PEVZNER, 2011). This tendency is heightened when managers have signed remuneration contracts related to company results (HEALY, 1985; HOLTHAUSEN; LARCKERET; SLOAN, 1995). Moreover, as Franz, Hassabelnaby and Lobo (2012) examined and found, firms show a positive correlation between their incentives to EM actions and the proximity to debt covenant violation. Secondly, the greater the political costs facing a company, the greater the incentives of management to artificially reduce its profit, in order to reduce the potential costs of governmental actions towards the company, and thus to manipulate the image offered to the market and to regulatory authorities (WATTS; ZIMMERMAN, 1986). Similarly, Monterre Mayoral and Sánchez Segura (2008) studied how taxes affect the quality of the accounting result and reported that in the case of companies that are not highly indebted, rising taxes generate a tendency for profits to be massaged down. Meanwhile, Cahan (1992) examined EM behaviour by companies facing antitrust and import-relief investigations, and found, empirically, that managers had incentives to use accounting procedures that reflected lower levels of income than for the periods not being investigated. However, managers are sensitive to future stock performance and those with high equity incentives are less likely y to report large positive earnings (CHENG; WARFIELD, 2005).
And finally, related to asset valuation, numerous studies have highlighted the existence of EM prior to transactions in which valuation is a crucial aspect. As Cohen and Zarowin (2010) report, firms use real and accrual-based EM activities around seasoned equity offerings. Thus, Perry and Williams (1994) observed that EM led to profits being understated in periods prior to a management buyout. By contrast, Teoh, Welch and Wong (1998) found that profits were often overstated during periods of equity issue. Paulo, Cavalcante and Lapa de Melo, 2012 found that accounting numbers are not significantly different in periods close to the public issue of shares and debentures, pointing that this fact does not affect the quality of accounting information. Another question of interest is that of management changes. In this respect, there are opportunistic interests both for managers leaving a company and for those joining it. As shown by DeAngelo (1988), managers who believe their position within the company is being challenged have an incentive to overstate the accounting result, while those who are newly arrived will seek to
R
ACE
, Unoesc, v
. 14, n. 1, p. 351-382, jan./abr
. 2015
understate profits in their first year in order to shift responsibility for this situation to the former management and to make subsequent results appear more impressive. The consequences of these management practices are beyond doubt detrimental, reducing the value of the company, its assets, its transactions, its reputation and corporate image (FOMBRUN; GARDBERG; BARNETT, 2000; ROYCHOWDHURY, 2006). According to Zahra, Priem e Rasheed (2005), the consequences of these discretionary practices affect investors, employees, customers and the local communities, which is eventually reflected in corporate reputation and, hence, the market value. Improvements in Earnings Quality lower information asymmetry and affect the cost of capital (FRANCIS et al., 2005; BHATTACHARYA; DAOUK; WELKER 2003; BLANCO; GARCÍA; TRIBÓ, 2009). At this respect, as Ferrero, Banerjee and García-Sánchez (2013) and Martínez-Ferrero, Banerjee and García-Sánchez (2014) report, EM practices leads to higher costs of capital and lower reputation, as result of the perceived uncertainty resulting in a discounting of the value of the information reported by the company engaging in EM practices. At the same time, provoking a loss of support among shareholders, investors and other stakeholders, and increasing activism and surveillance by interest groups and regulatory authorities (ZAHRA; PRIEM; RASHEED, 2005).
2.2 FINANCIAL REPORTING QUALITY (FRQ)
Due to the markets and business globalization, geographical expansion and the greater demand for information and transparency among investors, stakeholders and society in general, market agents find their toehold in the quality of their financial reporting and their main source of knowledge on company strategy (MARTÍNEZ-FERRERO, 2014). In relation to Financial Reporting Quality (FRQ), let us first note that the goal of financial reporting is to provide useful information for decision-making. So, according to Navarro-Garcia and Madrid-Guijarro (2014), “[...] the main purpose of financial reporting is to provide information that better reflects the economic position and performance of companies.” However, even though companies may generate financial statements in accordance with generally accepted accounting principles, these statements may present differing levels of quality (CHOI; PAE, 2011). Nonetheless, companies tend to improve their accounting practices from the moment that standards can be voluntarily applied (NAVARRO-GARCIA; MADRID-GUIJARRO, 2014).
R
ACE
, Unoesc, v
. 14, n. 1, p. 351-382, jan./abr
. 2015
Precisely, as FRQ can be defined as the faithfulness of the information conveyed by the financial reporting process. This quality may be influenced by factors related to taxes, dividends and objectives other than those regarding the information needs of external providers of capital (BALL; SHIVAKUMAR, 2005; BURGSTAHLER; HAIL; LEUZ, 2006). Reporting is a final output, but the quality of the output depends on each of the parts of the process by which it is elaborated, including disclosures about the company’s transactions, the selection and application of accounting policies, the judgments involved in this respect and the estimates made (JONAS; BLANCHET, 2000).
The financial report shows the economic and financial situation of the company, in order to inform managers and shareholders (MATHEWS; PERERA, 1991; MONEVA; LLENA, 2000), and is of crucial importance in decision making, when the interests of both shareholders and creditors must be taken into account.
FRQ requires companies to voluntarily expand the scope and quality of the information they report, to ensure that market participants are fully informed in order to make well-grounded decisions on investment, credit, etc. This high quality information facilitates greater transparency. Thereon, reporting quality is achieved when the information reported to investors and to the market is credible and free of error and bias, whether they are intentional or not (LU; RICHARDSON; SALTERIO, 2011). Therefore, the scope and quality of reported information are expanded and market participants are fully informed (HOPE; THOMAS; VYAS, 2013).
According to the leading authorities on the evaluation of financial reporting (such as the FASB, the SEC or the Jenkins committee), the main characteristics required are relevance, reliability, transparency and clarity (JONAS; BLANCHET, 2000; LU; RICHARDSON; SALTERIO, 2011). It has been asserted that high quality accounting information is a valuable means of counteracting information asymmetry (CHEN et al., 2011).
Numerous advantages of providing high-quality information have been cited: FRQ reduces information risk and liquidity (Lambert et al., 2007), prevents managers from using discretionary powers for their own benefit and helps them take efficient investment decisions (CHEN; BOUVAIN, 2009). Lambert, Leuz e Verrecchia (2007) obtained empirical evidence that the quality of accounting information can influence the cost of capital, both directly, by affecting market participants’ perceptions about the distribution of future cash flows, and indirectly, by affecting real decisions that alter the distribution of future cash flows above. In
R
ACE
, Unoesc, v
. 14, n. 1, p. 351-382, jan./abr
. 2015
this sense, Bachoo, Tan and Wilson (2013) obtained evidence which shows how the quality of reporting is negatively linked with cost of equity capital, and positively linked with the expected level of future long-term earnings. Chen and Bouvain (2009) found that FRQ positively affects the investment efficiency of private firms in emerging markets and that this effect enhances bank financing and decreases incentives to minimise earnings for tax avoidance purposes.
The external indicators of FRQ are: SEC Accounting and Auditing Enforcement Releases (AAERs); Restatements; and finally; internal controls (DECHOW; GE; SCHRAND, 2010). The two last indicators are the most important because they show information about the quality of the financial statements as a whole and not just as earnings. The main consequences of these alternatives are their effect on the cost of capital (market reaction to announcements of restatements and/ or AAERs is negative). Francis et al. (2005), supporting this point of view, reported that firms with a higher earning quality have a lower cost of debt.
2.3 RELIABILITY OF FINANCIAL INFORMATION
The four main attributes listed by the International Accounting Standard Board to make financial statements useful to users are: understandability, relevance, comparability and reliability (INTERNATIONAL ACCOUNTING STANDARDS BOARD, 2011).
The information that can influence the decisions of users by helping them to understand the operational and financial context of the organization and evaluate the impact of previous, current or future transactions and events, must be reliable, i.e., it has to be verifiable and free of errors and biases (INTERNATIONAL ACCOUNTING STANDARDS BOARD, 2011).
From the perspective of auditors, reliability refers to the probability of achieving the same results when analytical tests are again performed or when the same information is obtained from different sources. Reliable results are thus “[…] consistent, and are minimally affected by random errors of measurement.” (THE CANADIAN AUDITING AND ASSURANCE STANDARDS BOARD, 2011, p. 20). In order to verify the consistency and lack of errors and bias of a data set, statistical tests are used regularly by auditors and other analysts.
Digital analysis, which is often used in the audit testing, allows finding abnormal patterns of numbers, wrong digit combinations and rounding of numbers
R
ACE
, Unoesc, v
. 14, n. 1, p. 351-382, jan./abr
. 2015
in financial information. According to Durtschi, Hillison and Pacini (2004), one of the most effective tools for digital analysis is the Benford’s Law, which gives auditors the expected frequencies of digits in a given data set. The Benford’s Law has been implemented to successfully detect manipulated data (RAUCH; GOETTSCHE; EL MOUAAOUY, 2013; HENSELMANN; DITTER; SCHERR, 2013). In recent studies, numerous scholars have employed Benford’s law to investigate earnings management in enterprises. So, in accordance with Lin and Wu (2014), Benford’s law has been widely employed in accounting audits and when examining whether companies carry out EM actions. In this way, Nigrini and Mittermaier (1997) assert that, if an examined distribution of data fitted well with the BL, auditors might conclude that the respective data passed a test of reasonableness. This fact does not mean, necessarily, that all the observed numbers are correct or authentic, but rather that any bias or errors were not significant enough to affect the digital standards expected. According to Nigrini (2005) even if auditors have to combine other complementary analytical procedures and more accurate methods, BL constitutes a powerful tool in preliminary analysis to detect errors and other inconsistencies in data sets.
Moreover, given the divergence between the observed first digits distribution in annual financial accounts, Amiram, Bozanic and Rouen (2014) evidenced that when these financial statements are managed, there is a high likelihood of an increase in the divergence from Benford’s Law. So, these authors conclude that Benford’s Law could be understood as a long-range tool to detect financial reporting irregularities.
2.4 BENFORD’S LAW
Benford’s Law, also known as Law of Anomalous Numbers, Law of Significant Digits or Newcomb-Benford’s Law, is a logarithmic distribution useful for detecting abnormal patterns in sets of numbers. The deviation in actual data from these expected frequencies indicates the presence of manipulation (THOMAS, 2012). The innovative paper, written by Newcomb (1881), contributed to the theoretical explanation of Benford (1938) about the first-digit distribution, which is based on the probability of occurrence of a given initial digit, expressed by the following formula:
R
ACE
, Unoesc, v
. 14, n. 1, p. 351-382, jan./abr
. 2015
Thus, the probability of occurrence of a specific number in a data set, whose first digit is 1, is equal to 30.12%, considering Pe(1)=log102=0.3012. Similarly, the probability to find numbers whose first digit is 2, is equal to 17.61%, considering Pe(2)=log10(3/2)=0.1761, and so on, until Pe(9)=log10(10/9)=0.0458. Additionally, Hill (1995) provided a robust mathematical basis for this distribution. From the second to the fifth digits, the logarithmic behavior of the predicted frequencies is reduced each time and the deviations from a linear distribution tend to disappear progressively after the second digit. The probability of occurrence of a number between 0 to 9 for the fifth digit is equal to 10%.
An important property of BL, commented by Pinkham (1961), is scale invariance, since if a data set is multiplied by a constant factor, the new data set also obey the law. For example, a shift from dollar-denominated data to data denominated in other currencies does not change the first-digit distribution predicted by BL.
Benford’s Law, however, is not applicable to all data sets, such as those related to randomly generated numbers whose probability of occurrence of the digits is the same for the entire set. In addition, dates or pre-defined numbers, such as phone numbers, bank account numbers or non-sequential registries, also fail to satisfy BL.
On the other hand, in all other cases when the BL is applicable, the lack of conformity between the observed and expected occurrences suggests, in a preliminary way, abnormalities that should be investigated to know whether the cause is related to contextual factors, unintentional or intentional actions.
Hürlimann (2006) pointed out that by the year 2006 there were 305 papers directly related to BL published in scientific journals, and around 90 per cent of these texts were written after 1990. Despite this, there are few papers in the literature about BL applied to organizations of the health sector, such as the investigation of Maher and Akers (2002) on fraud in the insurance industry and the research of Wiseman (2011), to detect deviations and operational errors in hospital procedures. Most of the papers related to the application of BL in forensic accounting and auditing were published after the mid-1990s by authors such as Nigrini and Mittermaier (1997), Durtschi, Hillison and Pacini (2004), Quick and Wolz (2005), Johnson (2009) and Geyer (2010), among others. Basically, authors emphasized the relevance of the first digit in relation to other digits. Nigrini and Mittermaier (1997) stated that the other digits can be analyzed to support more specific audit tests according to the designed purposes, but the most significant one is the first.
R
ACE
, Unoesc, v
. 14, n. 1, p. 351-382, jan./abr
. 2015
3
RESEARCH DESIGN AND DATA
In this study, we used a quantitative approach to analyze the financial data of selected companies, particularly those ones that manage earnings. The sample is constituted of 845 international listed non-financial companies for the tax year 2010. The respective sample was obtained from the information available in Thomson One Analytic database for accounting and financial data related to 25 countries (USA, United Kingdom, Ireland, Canada, Australia, Germany, Netherlands, Luxemburg, Austria, Denmark, Norway, Finland, Sweden, Switzerland, France, Italy, Spain, Belgium, Portugal, Greece, Japan, China, New Zealand, Singapore and Korea) and the Administrative Region of Hong Kong.
Concretely, the financial information corresponds to consolidated data of the analyzed companies. Moreover, the financial data were directly related to the operating account, which values encompass the total expenses for each institution. The information provided by Thomson One Analytic database is expressed in millions of Euros. Therefore, there is no conflict in the valuation of each item caused by using a sample of international companies.
According to the Dechow model, 208 companies presented a high degree of earning management in the period. The Kothari model, and its turn, detected the same 208 plus 154 companies, for a total of 362 companies with a high EM degree. We found 483 companies that presented a medium or low EM degree according to the both models applied.
3.1 JONES’ STANDARD MODEL
According to Jones (1991) and Dechow, Sloan and Sweeney (1995), total accrual adjustments (TAA) are defined as:
(2) Where represents the change in current assets; reflects the change in cash held and short term financial investments; is the change in current liabilities; is the change in reclassified long term obligations; is the depreciation and amortization; i represents each company and t represents the year.
R
ACE
, Unoesc, v
. 14, n. 1, p. 351-382, jan./abr
. 2015
On the basis of Equation 2, accruals are calculated using an explanatory model. The difference between present and expected accrual adjustments (taking into account growth, company assets and the accounting result) represents the discretionary or unexplained component of accrual adjustments (DAA) and acts as a measure of management discretion in the reporting of results.
The standard Jones model uses the following procedure to separate the discretionary from the non-discretionary component:
(3) Where are the total accrual adjustments; represents total assets of firm i in period t-1 and this is used as a deflator to correct possible problems of heteroscedasticity; represents the property, plant and equipment of firm i in period t; is the change in sales for firm i in period t. The non-discretionary accrual adjustments (NDAA) are and represents the non-discretionary accrual adjustments (DAA) for firm i in the year t. NDAA are calculated by replacing the coefficients in Equation 3 with the values obtained by Ordinary Least Squares and DAA are the residuals of this calculation.
3.2 MODIFIED JONES MODEL (DECHOW; SLOAN;
SWEENEY, 1995)
In the modified Jones model (DECHOW; SLOAN; SWEENEY, 1995) (Equation 4), the TAA use the variation in sales less accounts receivable (used to measure the growth of the company, as its working capital is closely linked to sales), and less the item property, plant and equipment, which is used to measure the depreciation costs contained in the discretionary adjustments. It is assumed that not all sales are necessarily non-discretionary and that this will depend on the item to be received.
(4) Where A*R represents accounts receivable, and the other variables are as defined in Equation 3.
R
ACE
, Unoesc, v
. 14, n. 1, p. 351-382, jan./abr
. 2015
Note that in this model, the coefficients are calculated using the original Jones model (1991) and that the modification is made only for the calculation of the non-discretionary adjustments. In this study, we name the modified Jones model as “Dechow model”.
3.3 KOTHARI MODEL
Moreover, we alternatively employ the model proposed by Kothari, Leone and Wasley (2005). This is characterised by the incorporation of a non-deflated constant and the return on assets, or financial profitability. All variables (except the constant) are deflated by the total assets for the previous period and are calculated by cross estimation. This model provides increased reliability and higher quality results, by resolving the question of whether differences in DAA may derive from differences in performance. ( ) t t i t i t t i t i t t i t i t t i t t i t i A ROA A PPE A R A Sales A A TAA α α α α α +ε + + ∆ − + + = − − − − − , 1 , , 4 1 , , , 3 1 , , , 2 1 , , 1 0 1 , , 1 *
The NDAA are calculated by replacing the coefficients in Equation 6 with those obtained from Equation 5, as in the original modified Jones model.
( ) + + ∆ − + + = − − − − , 1 , , 4 1 , , , 3 1 , , , 2 1 , , 1 0 , ˆ ˆ 1 ˆ * ˆ ˆ t i t i t t i t i t t i t i t t i t t i A ROA A PPE A R A Sales A NDAA α α α α α
The DAA are then obtained by subtracting the NDAA from the TAA value obtained in Equation 2, as shown in Equation 7. The DAA represent the unexpected or abnormal accruals adjustments that constitute the variable taken as a measure of EM.
t i t i t i
TAA
NDAA
DAA
,=
,−
, (5) (6) (7)R ACE , Unoesc, v . 14, n. 1, p. 351-382, jan./abr . 2015
3.4 MEASURES OF EM AND FRQ
EM is considered to be the inverse of FRQ (DECHOW; DICHEV, 2002); a higher degree of EM is associated with lower quality of information (MARTÍNEZ-FERRERO, BANERJEE, GARCÍA-SÁNCHEZ, 2014).
According to García-Osma, Albornoz Noguer and Clemente (2005), EM can be defined as “[...] any practice carried out intentionally by company managers, for opportunistic and/or information purposes, to report accounting results that do not correspond to those really achieved.” The discretionary component of accruals adjustment could be used as a measure of management discretionarily, and therefore of accounting manipulation. As observed by García-Osma, Albornoz Noguer and Clemente (2005), accruals are not all discretionary; hence it is necessary to separate the discretionary component from the non-discretionary one in order to determine the presence and extent of EM. The discretionary accruals adjustment (DAA) is obtained by subtracting the non-discretionary accruals adjustment (NDAA) from the total accruals adjustment (TAA). The DAA represents the abnormal accruals that constitute the variable taken as a measure of EM.
In this study, in accordance with Martínez-Ferrero, Garcia‐Sanchez and Cuadrado‐Ballesteros (2013) and Martínez-Ferrero, Prado-Lorenzo Fernández-Fernández (2013), we use the modified Jones model (DECHOW; SLOAN; SWEENEY, 1995) and the Kothari model (KOTHARI; LEONE; WASLEY, 2005) to separate the non-discretionary component of accruals from the discretionary one. Despite the modified Jones model, in Kothari model, it is included lagged return on assets (ROA) as an additional regressor to control for the effect of performance on a firm’s accruals.
3.5 FIRST-DIGIT DISTRIBUTION
In order to detect abnormal digit frequencies in accounting numbers, we analyzed only the first-digit distribution, because it is considered a high-level test of reasonableness and it is associate with a larger material manipulation of earnings (RAUCH; GOETTSCHE; MOUAAOUY, 2013). Second and other digits were not subject to analysis for this study.
The first digit of the financial data was identified and organized, aiming to know the observed frequency of the specific digit Po(d). Subsequently, the Po(d) was
R
ACE
, Unoesc, v
. 14, n. 1, p. 351-382, jan./abr
. 2015
compared to the expected probability of the same digit Pe(d) predicted by the BL, as described previously in the Equation 1.
The null hypothesis (H0) proposes that no statistical significance exists between Po(d) and Pe(d), as shown in the Equation 8:
(8) We used the Z-test to determine whether the differences between the actual and expected proportions are significant, in order to verify the appropriateness of accepting or rejecting H0 with significance level (α) equal to 5% and Zcritical equal to 1.959. The Equation 9 presents the Z-test (Zt), where n represents the number of observations.
(9)
According to Nigrini and Mittermaier (1997), the correction term is applied in the Equation 3 when , as shown in the Equation 10.
(10)
To test the null hypothesis that the frequency distribution (Do) observed in the selected sample was consistent with the BL distribution (De), we used the statistical test Chi-square (χ2), shown in Equation 11, with a significance level (α) equal to 10%, degree of freedom (df) equal to 8, and the critical value (χ2critical) equal to 13.362.
R
ACE
, Unoesc, v
. 14, n. 1, p. 351-382, jan./abr
. 2015
After the appropriate statistical tests, it was possible to verify the conformity of the observed distributions to those expected and to infer about the presence or absence of bias, by adopting the BL as a proxy for reliability.
4
EMPIRICAL RESULTS
In this section, we present the digital analysis performed on the values related to operating expenses accounts of 845 observations in the period. The results of statistical tests verify the reliability of the financial data of the selected companies, using the probability distribution predicted by Benford’s Law as a proxy of reliability. Hypothetically, the companies that manage earnings would be more propense to present bias in a digital analysis than others.
Significant differences between the predicted and observed data are relevant for the detection of non-compliance, and may point out, objectively, the entities that would need more detailed analysis to clarify and explain some bias detected.
It is noteworthy that any results of non-compliance to BL not necessarily mean that there are cases of fraud or irregularities, which can only be found by an in-depth audit. The non-compliance data, however, may be a good indicator of attention and it can help to identify relevant factors influencing the performance organization.
Compliance to BL, in turn, is not guarantee that there is no risk of fraud or errors in the data sets, but represents preliminarily a more favorable situation with absence of bias and increasing the degree of reliability of the analyzed data.
4.1 SELECTED COMPANIES USING THE DECHOW MODEL
Graphic 1 shows the observed (Po) and expected (Pe) first-digit frequencies of numbers obtained from the operating expenses account of 208 companies with a high degree of EM according to the Dechow model. The frequencies of digits 4 and 5 are higher than expected for the period. This fact is associated with a reduction in the frequency of other digits, with emphasis on the digit 7.R
ACE
, Unoesc, v
. 14, n. 1, p. 351-382, jan./abr
. 2015
Graphic 1 – Digital distribution – Companies with high EM according to Dechow Model
Source: the authors.
Table 1 contains the results of the Z-test (Zt), which verifies if there is significant difference between the expected (Pe) and observed (Po) probability of occurrence of a given initial digit (d) of the revenue account values. The null hypothesis (H0) is that there is no significant difference between Pe and Po. After analyzing the frequency of occurrence of d, the results indicated that the reference value (Zcritical = 1.959) was higher than Zt in all the observations, except for the digits 7. This fact allows us to reject H0 for the digit 7 and classify the observed data with “attention” status, determining the presence of bias.
Table 1 – Digital distribution
d Pe Po Po-Pe Zt status 1 30,1% 27,9% -2,22% 0,55 ok 2 17,6% 17,3% -0,30% - 0,07 ok 3 12,5% 10,1% -2,40% 0,84 ok 4 9,7% 13,9% 4,25% 1,84 ok 5 7,9% 11,1% 3,14% 1,42 ok 6 6,7% 6,7% 0,04% 0,02 ok 7 5,8% 1,9% -3,88% 2,10 attention 8 5,1% 7,2% 2,10% 1,06 ok 9 4,6% 3,8% -0,73% 0,17 ok Tot 100,0% 100,0% Zcritical=1,959
R
ACE
, Unoesc, v
. 14, n. 1, p. 351-382, jan./abr
. 2015
Table 2 shows the Chi-square (χ2) test, calculated as shown in Equation (11) for our total sample, in order to verify whether observed (Do) and expected (De) data sets have significant differences. The reference value (χ2critical) is compared to the calculated value (χ2calc). Due to χ2critical<χ2calc in the period, it is possible to reject the null hypothesis (Ho) that there is no significant difference between Do and De. This result is also expressed in the relation Pvalue<0.1.
Table 2 – Test χ2- Dechow’s model
d Do De χ2calc 1 58 63 0,3400 2 36 37 0,0107 3 21 26 0,9571 4 29 20 3,8792 5 23 16 2,5893 6 14 14 0,0004 7 4 12 5,3888 8 15 11 1,7869 9 8 10 0,2420 Tot 208 208 15,194 df=8 χ2crit=13,362 α=0,1 P value = 0,055
Source: the authors.
Based on absolute values, the largest differences in the expected frequencies occurred in those numbers initiated by the digits 7, 4 and 5. The total difference is statistically significant.
Thus, adopting the digital distribution provided by BL as a proxy for reliability, statistical tests indicated that, preliminarily, there is bias in the operating expenses data of companies with a high degree of EM according to Dechow Model. This result is compatible with the argument of Dechow and Dichev (2002), Martínez‐Ferrero, Garcia‐Sanchez and Cuadrado‐Ballesteros (2013) and Martínez-Ferrero, Prado-Lorenzo Fernández-Fernández (2013), that a higher degree of EM is associated with lower quality of information.
R
ACE
, Unoesc, v
. 14, n. 1, p. 351-382, jan./abr
. 2015
4.2 SELECTED COMPANIES USING THE KOTHARI MODEL
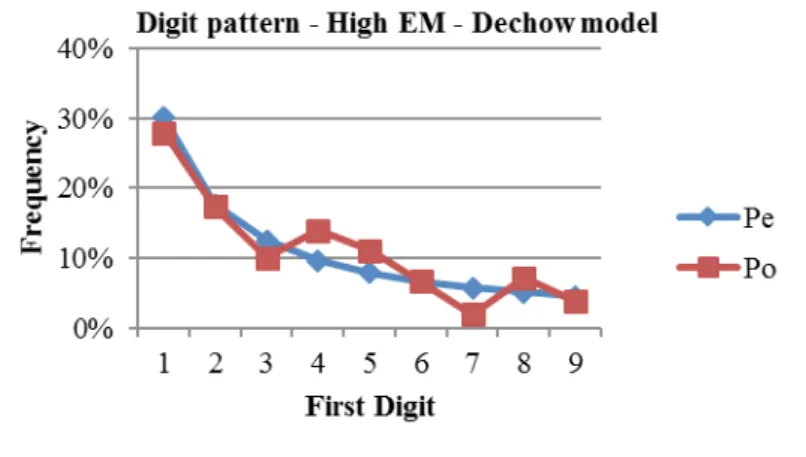
Graphic 2 shows the observed (Po) and expected (Pe) first-digit frequencies of numbers obtained from the operating expenses account of 362 companies with a high degree of EM according to the Kothari model. We found a reasonable fit of Po to the logarithmic curve Pe.Graphic 2 – Digital distribution – with high EM according to Kothari Model
Source: the authors.
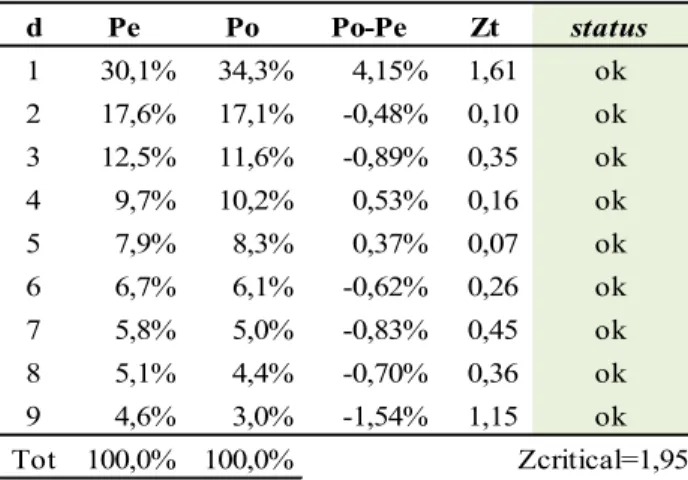
The Zt value of the remaining digits in both years studied was less than the Zcritical, leading to the acceptance of H0.
Table 3 – Digital distribution – Kothari
d Pe Po Po-Pe Zt status 1 30,1% 34,3% 4,15% 1,61 ok 2 17,6% 17,1% -0,48% 0,10 ok 3 12,5% 11,6% -0,89% 0,35 ok 4 9,7% 10,2% 0,53% 0,16 ok 5 7,9% 8,3% 0,37% 0,07 ok 6 6,7% 6,1% -0,62% 0,26 ok 7 5,8% 5,0% -0,83% 0,45 ok 8 5,1% 4,4% -0,70% 0,36 ok 9 4,6% 3,0% -1,54% 1,15 ok Tot 100,0% 100,0% Zcritical=1,959
R
ACE
, Unoesc, v
. 14, n. 1, p. 351-382, jan./abr
. 2015
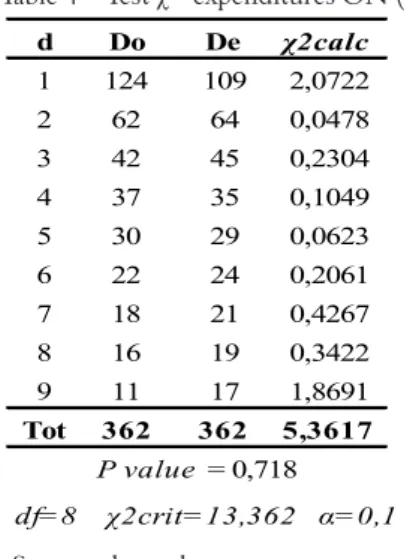
The Chi-square (χ2) test, shown in Table 4, allows accepting the null hypothesis (Ho) that there is no significant difference between the observed (Do) and expected (De) data sets of the selected companies in the period. The reference value (χ2critical) was higher than the calculated value (χ2calc) in both years, as well as the P value was higher than the significance level of 10%.
Table 4 – Test χ2- expenditures ON (2009-10)
d Do De χ2calc 1 124 109 2,0722 2 62 64 0,0478 3 42 45 0,2304 4 37 35 0,1049 5 30 29 0,0623 6 22 24 0,2061 7 18 21 0,4267 8 16 19 0,3422 9 11 17 1,8691 Tot 362 362 5,3617 df=8 χ2crit=13,362 α=0,1 P value = 0,718
Source: the authors.
Based on the χ2 test results, the analyzed data sets can be considered free of bias, and this suggests that the Kothari model does not offer, with a confidence level of 90%, a clear association between companies that manage earnings with lower quality of financial information (operational expenses). This may be related to the fact that the group of companies identified by the Kothari model with a high degree of earnings management is more comprehensive than the Dechow’s and hence the Kothari’s could not point accurately to the relationship between EM and FRQ just as Dechow’s. However, this result contrasts with the apparent advantage of Kothari model over the Dechow’s regarding the reliability of the information generated, according to authors such as Jonas and Blanchet (2000).
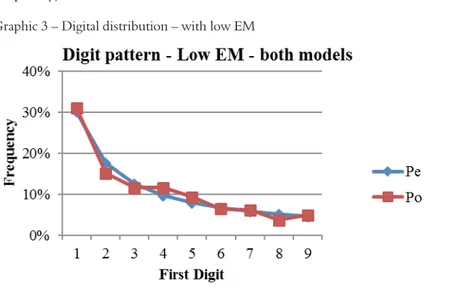
4.3 SELECTED COMPANIES WITH LOW EM DEGREE
Graphic 3 presents the observed (Po) and expected (Pe) frequencies of first-digits of the values obtained from the operating expenses account of companies that
R
ACE
, Unoesc, v
. 14, n. 1, p. 351-382, jan./abr
. 2015
presented a low EM degree according to the both models: Dechow and Kothari ones. In 2010, despite the slight difference for the digits “2” and “4”, there is a reasonable fit of Po (observed frequency) to the logarithmic curve Pe (expected frequency).
Graphic 3 – Digital distribution – with low EM
Source: the authors.
Based on the Z-test (Zt) presented in Table 9, there is no significant difference between the expected (Pe) and observed (Po) probability of occurrence of a given initial digit (d) of the revenue account values, which allows accepting H0. Even considering the differences in 2010, related to the digits “2” and “4”, the reference value (Zcritical= 1.959) was higher than Zt. Thus, the observed data in both years received the ‘ok’ status, suggesting the absence of bias in the data sets. Table 5 – Digital distribution – expenditures – QC (2009-10)
d Pe Po Po-Pe Zt status 1 30,1% 31,1% 0,95% 0,36 ok 2 17,6% 15,1% -2,50% 1,32 ok 3 12,5% 11,6% -0,90% 0,46 ok 4 9,7% 11,6% 1,90% 1,26 ok 5 7,9% 9,3% 1,40% 0,97 ok 6 6,7% 6,4% -0,28% 0,06 ok 7 5,8% 6,2% 0,41% 0,19 ok 8 5,1% 3,7% -1,39% 1,18 ok 9 4,6% 5,0% 0,39% 0,20 ok
R
ACE
, Unoesc, v
. 14, n. 1, p. 351-382, jan./abr
. 2015
The Chi-square (χ2) test, shown in Table 10, allow accepting the null hypothesis (Ho) that there is no significant difference between the observed (Do) and expected (De) data sets of the selected companies. The reference value (χ2critical) was higher than the calculated value (χ2calc) in both years, as well as the P value was higher than the significance level of 10%.
Table 6 – Test χ2 – expenditures - QC (2009-10)
d Do De χ2calc 1 150 145 0,1457 2 73 85 1,7078 3 56 60 0,3129 4 56 47 1,8053 5 45 38 1,1933 6 31 32 0,0551 7 30 28 0,1414 8 18 25 1,8205 9 24 22 0,1632 Tot 483 483 7,3452 df=8 χ2crit=13,362 α=0,1 P value = 0,499 Source: the authors.
Adopting the digital distribution provided by BL as a proxy for reliability, the Z-test and χ2 test results indicated that, preliminarily, there is no bias in the revenue data of companies with low EM degree in 2010. This result is compatible with the argument of Dechow and Dichev (2002) and Martínez‐Ferrero, Garcia‐Sanchez and Cuadrado‐Ballesteros (2013) and Martínez-Ferrero, Prado-Lorenzo and Fernández-Fernández (2013).
5
CONCLUSION
The aim of this exploratory study was to test whether a financial data set (operating expenses) of companies that manage earnings presents bias. We found that companies with high EM degree, according to the Dechow model, have abnormal financial patterns based on the first-digit analysis and this result is
R
ACE
, Unoesc, v
. 14, n. 1, p. 351-382, jan./abr
. 2015
compatible with Dechow and Dichev (2002) and Martínez‐Ferrero, Garcia‐Sanchez and Cuadrado‐Ballesteros (2013). Interestingly, we also found different results for the same test, with a confidence level of 90%, when we considered companies with high EM degree calculated by the Kothari model, and this fact contrasts with the apparent advantage of Kothari model over the Dechow’s regarding the reliability of the information generated.
The companies with low EM degree, according to both models, met the frequency expectations predicted by Benford’s Law. This fact suggests that our initial hypothesis about the existence of bias in the financial data set (operating expenses) can be confirmed using the Dechow model, but not when applying the Kothari model. And it is possible to suppose that the Dechow model (or modified Jones model) can be more accurate than the Kothari model in order to select companies that manage earnings and which financial data would be more propense to present bias as we assumed in our hypothesis, based on Martínez-Ferrero, Prado-Lorenzo and Fernández-Fernández (2013).
The purpose of this study was not to point out any specific theoretical improvement that could be made in the models, but contributes to the conceptual discussion of possible advantages and disadvantages of the models in identifying companies that manage earnings and brings new questions about the lower adherence of Kothari model to Benford’s Law than Dechow model.
Any results of non-compliance to Benford’s Law do not necessarily mean that there are cases of fraud or irregularities, but this fact might be a red flag and, therefore, a good indicator of attention. An in-depth audit can identify relevant factors influencing the respective nonconformity to BL and provide useful information to the organization’s stakeholders. On the other hand, compliance to BL is not guarantee that there is no risk of fraud or inappropriate actions in the data sets, but it is a more favorable condition with absence of bias and increases the degree of reliability of the analyzed data.
We suggest for further studies to be carried out by considering other financial variables and by increasing the sample size and the consideration of institutional, cultural and industry specific factors in order to identify other influences.
Explanatory note
1 The basis of EM practices has been established by the Agency and the Positive Accounting
theories. The conflict of interest arising from the separation between ownership and control (which is the basis of the Agency Theory) and information asymmetry between the two
R
ACE
, Unoesc, v
. 14, n. 1, p. 351-382, jan./abr
. 2015
parties create a vacuum where managers behave discretionarily, do not take into account shareholders’ interests and carry out EM practices. Positive Accounting Theory point out that accounting choice depends on firm characteristics as it is used to help the relationship between the managers and the stakeholders of firms, particularly the investors.
REFERENCES
AKERLOF, G. A. The market for “lemons”: quality uncertainty and the market mechanism, v. 84, n. 3, p. 488-500, Aug. 1970.
AMIRAM, D.; BOZANIC, Z.; ROUEN, E. Financial Statement Irregularities: Evidence from the Distributional Properties of Financial Statement Numbers. Working Paper, 2014.
BACHOO, K.; TAN, R.; WILSON, M. Firm value and the quality of
sustainability reporting in Australia. Australian Accounting Review, v. 23, n. 1, p. 67-87, 2013.
BALL, R. Accounting informs investors and earnings management is rife: Two questionable beliefs. Accounting Horizons, v. 27, n. 4, p. 847-853, 2013.
BALL, R.; SHIVAKUMAR, L. Earnings quality in UK private firms: Comparative loss recognition timeliness. Journal of Accounting and Economics, v. 39, n. 1, p. 83-128, 2005.
BENFORD, F. The law of anomalous numbers. Proceedings of the American Philosophical Society, n. 78, p. 551-572, 1938.
BHATTACHARYA, U.; DAOUK, H.; WELKER, M. The world price of earnings opacity. The Accounting Review, v. 78, n. 3, p. 641-678, 2003.
BLANCO, B.; GARCÍA, J. M.; TRIBÓ, J. A. The complementary between segment disclosure and earnings quality, and its effect on cost of capital. In: ANNUAL CONGRESS OF THE EUROPEAN ACCOUNTING ASSOCIATION, 32., 2009, Finland. Annals... Finland, 2009.
BURGSTAHLER, D.; DICHEV, I. Earnings management to avoid earnings decreases and losses. Journal of accounting and economics, v. 24, n. 1, p. 99-126, 1997.
BURGSTAHLER, D.; HAIL, L.; LEUZ, C. The importance of reporting incentives: Earnings management in European private and public firms. The Accounting Review, v. 81, n. 5, p. 983-1016, 2006.
R
ACE
, Unoesc, v
. 14, n. 1, p. 351-382, jan./abr
. 2015
CAHAN, S. F. The effect of antitrust investigations on discretionary accruals: A refined test of the political-cost hypothesis. Accounting Review, v. 67, n. 1, p. 77-95, 1992.
CHEN, F. et al. Financial Reporting Quality and Investment Efficiency of Private Firms in Emerging Markets. The Accounting Review, v. 86, n. 4, p. 1255-1288, 2011.
CHENG, Q.; WARFIELD, T. D. Equity incentives and earnings management. The Accounting Review, v. 80, n. 2, p. 441-476, 2005. CHEN, S.; BOUVAIN, P. Is Corporate Responsibility Converging? A
Comparison of Corporate Responsibility Reporting in the USA, UK, Australia and Germany. Journal of Business Ethics, v. 87, p. 299-317, 2009.
CHOI, T. H.; PAE, J. Business ethics and financial reporting quality: evidence from Korea. Journal of Business Ethics, v. 103, n. 3, p. 403-427, 2011. COHEN, D.; ZAROWIN, P. Accrual-based and real earnings management activities around seasoned equity offerings. Journal of Accounting and Economics, v. 50, n. 1, p. 2-19, 2010.
DATTA, S.; ISKANDAR-DATTA, M.; SINGH, V. Product market power, industry structure, and corporate earnings management. Journal of Banking & Finance, v. 37, n. 8, p. 3273-3285, 2013.
DAVIDSON, W. N.; XIE, B.; XU, W. Market reaction to voluntary announcements of audit committee appointments: The effect of financial expertise. Journal of Accounting and Public Policy, v. 23, n. 4, p. 279-293, 2004.
DEANGELO, L. E. Managerial competition, information costs, and corporate governance. The use of accounting performance measures in proxy contests. Journal of Accounting and Economics, v. 10, n. 1, p. 3-36, 1988.
DECHOW, P. M.; DICHEV, I. The quality of accruals and earnings: The role of accrual estimation errors. The Accounting Review 77, p. 35-59, 2002. Supplement.
DECHOW, P. M.; GE, W.; SCHRAND, C. Understanding earnings quality: A review of the proxies, their determinants and their consequences. Journal of Accounting and Economics, v. 50, n. 2-3, p. 344-401, 2010.
DECHOW, P. M.; SLOAN, R. G.; SWEENEY, A. P. Detecting earnings management. Accounting Review, v. 70, n. 2, p. 193-225, 1995.
R
ACE
, Unoesc, v
. 14, n. 1, p. 351-382, jan./abr
. 2015
DURTSCHI, C.; HILLISON, W.; PACINI, C. The effective use of Benford’s law to assist in detecting fraud in accounting data. Journal of Forensic Accounting, v. 17-34, 2004.
FOMBRUN, C. J.; GARDBERG, N. A.; BARNETT, M. L. Opportunity platforms and safety nets: Corporate citizenship and reputational risk. Business and Society Review, v. 105, n. 1, p. 85-106, 2000.
FRANCIS, J. et al. “The market pricing of accrual quality”. Journal of Accounting and Economics, v. 39, n. 2, p. 295-327, 2005.
FRANZ, D. R.; HASSABELNABY, H. R.; LOBO, G. J. Impact of proximity to debt covenant violation on earnings management. 2012.
GAO, P. A measurement approach to conservatism and earnings management. Journal of Accounting and Economics, v. 55, n. 2, p. 251-268, 2013.
GARCÍA-OSMA, B.; ALBORNOZ NOGUER, G.; CLEMENTE, G. A. La investigación sobre “earnings management”. Revista Española De Financiación y Contabilidad, v. 34, n. 127, p. 1001-1034, 2005.
GARGOURI, R. M.; SHABOU, R.; FRANCOEUR, C. The relationship between corporate social performance and earnings management. Canadian Journal of Administrative Sciences/Revue Canadienne Des Sciences De l’Administration, v. 27, n. 4, p. 320-334, 2010.
GEYER, D. Detecting fraud in financial data sets. Journal of Business & Economics Research, v. 8, n. 7, p. 75-83, 2010.
GRAHAM, J. R. ; HARVEY, C. R. ; RAJGOPAL, S. “The economic implications of corporate financial reporting”. Journal of Accounting and Economics, n. 40, p. 3-73, 2005.
GUNNY, K. A. The Relation Between Earnings Management Using Real Activities Manipulation and Future Performance: Evidence from Meeting Earnings Benchmarks. Contemporary Accounting Research, v. 27, n. 3, p. 855-888, 2010.
HAZARIKA, S. J. ; KARPOFF, M.; NAHATA, R. International corporate
governance, CEO turnover and earnings management. J. Financ. Econ., v. 104, n. 1, p. 44-69, 2012.
HEALY, P. M. The effect of bonus schemes on accounting decisions. Journal of Accounting and Economics, v. 7, n. 1-3, p. 85-107, 1985.
R
ACE
, Unoesc, v
. 14, n. 1, p. 351-382, jan./abr
. 2015
HEALY, P. M.; WAHLEN, J. A review of the earnings management literature and its implications for standard setting. Paper prepared for discussion at the 1998 AAA/FASB Financial Reporting Issues Conference. Accounting Horizons, n. 13, p. 365-383, 1999.
HENSELMANN, K.; DITTER, D.; SCHERR, E. XBRL and Benford’s Law – A Perfect Symbiosis in Detecting Earnings Management? In: ANNUAL RESEARCH WORKSHOP ON STRATEGIC AND EMERGING
TECHNOLOGIES IN ACCOUNTING, AUDITING AND TAX, 22., 2013, Anaheim, USA. Annals… Anaheim, USA: AAA Annual Meeting, 2013. HILL, G.O. Substation load distribution monitor system. U.S. Patent, n. 5,p. 406,495, Abr. 1995.
HOLTHAUSEN, R. W.; LARCKER, D. F.; SLOAN, R. G. Annual bonus schemes and the manipulation of earnings. Journal of Accounting and Economics, v. 19, n. 1, p. 29-74, 1995.
HOPE, O. K.; THOMAS, W. B.; VYAS, D. Financial reporting quality of US private and public firms. The Accounting Review, v. 88, n. 5, p. 1715-1742, 2013.
HÜRLIMANN, W. Benford’s law from 1881 to 2006: a bibliography. Cornell Library, 2006.
INTERNATIONAL ACCOUNTING STANDARDS BOARD. Conceptual framework phase A: objective and qualitative characteristics. United Kindom: IASB, 2011.
ISLAM, M. A.; ALI, R.; AHMAD, Z. Is modified Jones model effective in
detecting earnings management? Evidence from a developing economy. Int. J. Econ. Finance, v. 3, n. 2, p. 116-125, 2011.
JOHNSON, G. C. Using Benford’s law to determine if selected company: characteristics are red flags for earnings management. Journal of Forensic Studies in Accounting and Business. p. 39-65, 2009.
JONAS, G. J.; BLANCHET, J. Assessing quality of financial reporting. Accounting Horizons, v. 14, n. 3, p. 353-363, 2000.
JONES, J. J. Earnings management during import relief investigations. Journal of Accounting Research, v. 29, n. 2, p. 193-228, 1991.
KIM, B. H.; LISIC, L. L.; PEVZNER, M. Debt covenant slack and real earnings management. Working Paper, United States: American University and George
R
ACE
, Unoesc, v
. 14, n. 1, p. 351-382, jan./abr
. 2015
KIM, Y.; PARK, M. S.; WIER, B. S. Is earnings quality associated with corporate social responsibility? The Accounting Review, Forthcoming, 2011.
KOTHARI, S.; LEONE, A. J.; Wasley, C. E. Performance matched
discretionary accrual measures. Journal of Accounting and Economics, v. 39, n. 1, p. 163-197, 2005.
LAMBERT, R.; Leuz, C.; Verrecchia, R. E. Accounting information, disclosure, and the cost of capital. Journal of Accounting Research, v. 45, n. 2, p. 385-420, 2007.
LECLERC, G. et al. Accountability, performance reporting, comprehensive audit: an integrated perspective. Ottawa: CCAF-FCVI, 1996.
LIN, F.; WU, S. Comparison of cosmetic earnings management for the developed markets and emerging markets: Some empirical evidence from the United States and Taiwan. Economic Modelling, v. 36, p. 466-473, 2014.
LU, H.; Richardson, G.; Salterio, S. Direct and Indirect Effects of Internal Control Weakness on Accrual Quality: Evidence from a Unique Canadian Regulatory Setting. Contemporary Accounting Research, v. 28, n. 2, p. 675-707, 2011. MAHER, M.; AKERS, M. Using Benford’s Law to detect fraud in the insurance industry. International Business & Economics Research Journal, v. 1, n. 7, 2002.
MARANJORY, M. The role of discretionary accruals in earnings management: Evidence from Tehran Stock Exchange. Management Science Letters, v. 3, n. 9, p. 2399-2404, 2013.
MARTÍNEZ-FERRERO, J. Consequences of financial reporting quality on corporate performance. Evidence at the international level. Estudios de Economía, v. 41, n. 1, p. 50, 2014.
MARTÍNEZ-FERRERO, J.; BANERJEE, S.; GARCÍA-SÁNCHEZ, I. M. Corporate social responsibility as a strategic shield against costs of earnings management practices. Journal of Business Ethics, p. 1-20, 2014. MARTÍNEZ-FERRERO, J.; GARCÍA-SÁNCHEZ, I. M.; CUADRADO-BALLESTEROS, B. Effect of financial reporting quality on sustainability information disclosure. Corporate Social Responsibility and
Environmental Management. 2013. Disponível em: <http://onlinelibrary.wiley. com>. Acesso em: 20 Mar. 2014.
R
ACE
, Unoesc, v
. 14, n. 1, p. 351-382, jan./abr
. 2015
MARTÍNEZ-FERRERO, J.; PRADO-LORENZO, J. M.; FERNÁNDEZ-FERNÁNDEZ, J. M. Responsabilidad social corporativa vs. responsabilidad contable. Revista de Contabilidad, v. 16, n. 1, p. 32-45, 2013.
MATHEWS, M.; PERERA, M. Accounting Theory and Development. London: Chapman & Hall, 1991.
MONEVA, J. M.; LLENA, F. The environmental disclosures in the annual reports of large companies in Spain. European Accounting Review, v. 9, n. 1, p. 7-29, 2000.
MONTERREY MAYORAL, J. A.; SÁNCHEZ SEGURA, A. ¿Cómo afectan los impuestos a la calidad del resultado? Evidencia empírica en las empresas españolas no cotizadas. Revista De Contabilidad, v. 12, n. 1, p. 117-140, 2008.
NAVARRO-GARCIA, J. C.; MADRID-GUIJARRO, A. The Influence of Improvements in Accounting Standards on Earnings Management: The Case of IFRS. Australian Accounting Review, v. 24, p. 154-170, 2014.
NELSON, M. W.; SKINNER, D. J. How should we think about earnings quality? A discussion of “earnings quality: evidence from the field”. Journal of Accounting and Economics, v. 56, n. 2, p. 34-41, 2013.
NEWCOMB, S. Note on the Frequency of Use of the Different Digits in Natural Numbers. American Journal of Mathematics, v. 4, n. 1-4, p. 39-40, 1881. NIGRINI, M. An Assessment of the Change in the Incidence of Earnings Management Around the Enron-Andersen. Review of Accounting & Finance, v. 4, n. 1, p. 92, 2005.
NIGRINI, M.; Mittermaier, L. J. The use of Benford’s Law as an aid in analytical procedures. Auditing, v. 16, n. 2, p. 52, 1997.
PAULO, E.; CAVALCANTE, P. R. N.; LAPA DE MELO, I. I. Qualidade das informações contábeis na oferta pública de ações e debêntures pelas companhias abertas brasileiras. Brazilian Business Review, v. 9, n. 1, p. 1-26, 2012. PERRY, S. E.; WILLIAMS, T. H. Earnings management preceding management buyout offers. Journal of Accounting and Economics, v. 18, n. 2, p. 157-179, 1994. PINKHAM, R. S. On the distribution of first significant digits. The Annals of Mathematical Statistics, v. 32, n. 4, p. 1223-1230, 1961.
QUICK, R.; WOLZ, M. Benford’s Law in German financial statements. Finance India, v. 19, n. 4, 2005.
R
ACE
, Unoesc, v
. 14, n. 1, p. 351-382, jan./abr
. 2015
RAUCH, B.; GOETTSCHE, M.; EL MOUAAOUY, F. Libor Manipulation-Empirical Analysis of Financial Market Benchmarks Using Benford’s Law, 2013. ROYCHOWDHURY, S. Earnings management through real activities
manipulation. Journal of Accounting and Economics, v. 42, n. 3, p. 335-370, 2006.
SCHIPPER, K. Commentary on earnings management. Accounting Horizons, v. 3, n. 4-5, p. 91-102, 1989.
SCOTT, W. R. Financial Accounting Theory. 5. ed. New Jersey: Prentice, 2009. TEOH, S. H.; WELCH, I.; WONG, T. J. Earnings management and the
underperformance of seasoned equity offerings. Journal of Financial Economics, v. 50, n. 1, p. 63-99, 1998.
THE CANADIAN AUDITING AND ASSURANCE STANDARDS BOARD. The Canadian Standard on Quality Control: CSQC1. Toronto: CICA, 2011. THOMAS, E. W. Further evidence on the extent of cosmetic earnings
management by U.S. firms. Acad. Account. Financ. Stud. J., v. 16, n. 3, p. 57-64, 2012.
WATTS, R.; ZIMMERMAN, J. L. Positive accounting theory. New Jersey: Prentice-Hall, 1986.
WATTS, R.; ZIMMERMAN, J. L. Towards a positive theory of the determination of accounting standards. The Accounting Review, v. 53, n. 1, p. 112-134, 1978. WISEMAN, S. Digit distributions: what digits are really being used in hospitals? Proceedings of the fourth York doctoral symposium on computer science. UK: University of York, Oct. 2011.
ZAHRA, S. A.; PRIEM, R. L.; RASHEED, A. A. The antecedents and
consequences of top management fraud. Journal of Management, v. 31, n. 6, p. 803-828, 2005.
ZANG, A. Evidence on the trade off between real manipulation and accrual manipulation. The Accounting Review, v. 87, n. 2, p. 675-703, 2012.
FERRERO, Jennifer Martínez; BALLESTEROS, Beatriz Cuadrado; MILANI FILHO, Marco Antonio Figueiredo. The link between earnings management and digital pattern. RACE, Revista de Administração, Contabilidade e Economia, Joaçaba: Ed. Unoesc, v. 14, n. 1, p. 351-382, jan./abr. 2015. Disponível em: <http:// editora.unoesc.edu.br/index.php/race>.
Ferrero, J. M., Ballesteros, B. C., & Milani Filho, M. A. F. (2015). The link between earnings management and digital pattern. RACE, Revista de Administração, Contabilidade e Economia, 14(1), 351-382. Recuperado em dia/mês/ano, de http:// editora.unoesc.edu.br/index.php/race