THE CORRELATION BETWEEN DEXA AND CDEXA METHODS
IN BONE MINERAL ABSORPTIOMETRY*
Cláudio Gilberto Defavori1, Gabriel Adrian Sarriés2
OBJECTIVE: To study the interchangeability of the bone mineral density results between Hologic® dual en-ergy x-ray absorptiometry (DEXA) and Cromox® computed dual enen-ergy conventional x-ray absorptiometry (CDEXA) equipments. MATERIALS AND METHODS: Thirty-eight femoral necks and 31 lumbar spines of 43 patients underwent bone mineral density measured by both equipments in a diagnostic imaging center. The Cromox®equipment was calibrated with a reference Cromox® phantom for bone absorptiometry. RESULTS: A strong correlation between results obtained from the two devices was found for each skeletal site.The linear correlation coefficient measured for the right femoral neck was r = 0.920, p < 0.0001, and r = 0.923, p < 0.0001 for the lumbar spine L2-L4 vertebrae. Considering the relevance of the Tscore result in the clinical practice for bone densitometry, the mean difference of the Tscore between devices was calculated, resulting in an arithmetic mean ∆∆∆∆∆Tscore = 0.191 for hips and an arithmetic mean ∆∆∆∆∆Tscore = 0.228 for the lumbar spines. The skeletal status is established according to the World Health Organization definition as normal, osteopenia or osteoporosis. The skeletal status concordance between devices was higher than 76% for hips and higher than 77% for spines; and higher than 96% when considering concordance in at least one of the two sites. CONCLUSION: The linear correlation coefficients obtained are very close to the interna-tional references among gold standard devices, reported as r > 0.95. For both sites, the arithmetic mean difference in Tscore between devices is low – lower than the least significant variance.
Keywords: Dual energy x-ray absorptiometry; Dual energy radiographic absorptiometry; Computed x-ray densitometry; Correlation; Interchangeability.
A correlação de métodos DEXA e CDEXA em absortimetria mineral óssea.
OBJETIVO: Estudar a intercambiabilidade dos resultados de densidade mineral óssea entre máquinas de absortimetria de raios-x em duas energias (DEXA) Hologic® e de absortimetria computadorizada de raios-x convencionais em duas energias (CDEXA) Cromox®. MATERIAIS E MÉTODOS: Para 38 casos de quadril e 31 casos de coluna lombar avaliados em 43 pacientes atendidos em um centro de diagnóstico por imagem, medidas de densidade mineral óssea foram realizadas em ambas as máquinas. A máquina Cromox®foi cali-brada usando-se o phantom Cromox®de referência para absortimetria óssea. RESULTADOS: Forte correla-ção entre os resultados obtidos nas duas máquinas foi encontrada para cada sítio do esqueleto.O coeficiente de correlação linear medido para o colo femoral direito foi r = 0,920, p < 0,0001, e r = 0,923, p < 0,0001 para as vértebras L2-L4 da coluna lombar. Como o resultado expresso em Tscore é importante na prática clí-nica em densitometria óssea, a diferença média em Tscore entre as máquinas foi calculada, resultando em média aritmética de ∆∆∆∆∆Tscore = 0,191 para o quadril e média aritmética de ∆∆∆∆∆Tscore = 0,228 para a coluna. Estado esquelético é estabelecido de acordo com a definição da Organização Mundial da Saúde como nor-mal, osteopenia ou osteoporose. A concordância de estado esquelético entre as máquinas foi superior a 76% para o quadril e superior a 77% para a coluna, e superior a 96% quando se considerou concordância em ao menos um dos dois sítios. CONCLUSÃO: Os coeficientes de correlação linear obtidos são muito pró-ximos das referências internacionais entre máquinas padrão-ouro, reportados como r > 0,95. Para ambos os sítios, a diferença média aritmética em Tscore entre as máquinas é pequena, menor que a menor variação significativa.
Unitermos: Absortimetria de raios-x em duas energias; Absortimetria radiográfica em duas energias; Densi-tometria por raios-x computadorizada; Correlação; Intercambiabilidade.
Abstract
Resumo
* Study developed at CPA Radiologia, Piracicaba Unit, Piraci-caba, SP, Brazil.
1. MD, Radiologist at CPA Radiologia, Piracicaba, SP, Brazil. 2. Doctor Professor, Department of Exact Sciences at Escola Superior de Agricultura Luiz de Queiroz – Universidade de São Paulo (ESALQ-USP), Piracicaba, SP, Brazil.
Mailing address: Dr. Cláudio Gilberto Defavori. Avenida Vinte, 812. Rio Claro, SP, Brazil, 13500-250. E-mail: claudio@unimedrc. com.br
Received November 9, 2005. Accepted after revision Novem-ber 27, 2006.
INTRODUCTION
Dual energy x-ray absorptiometry (DEXA) is a technique widely utilized for measuring mass and bone mineral density (BMD). Computed dual energy conven-tional x-ray absorptiometry (CDEXA) is different from DEXA in the way x-rays absorption data acquisition is performed,
but the mathematical algorithms utilized for absorptiometry data processing are similar.
data; lower total investment allowing a more disseminated and comprehensive use in the population; estimated radiation doses of 1.3 mSv and 2.6 mSv, respectively, for hip and spine assessment, and a probable increase in the diagnostic specificity, con-sidering the feasibility of an individualized radiological analysis. It is necessary to know if results obtained for subjects with the CDEXA system may be reliably inter-changed with results for the same subjects with a DEXA device, as previously done for comparison between absorptiometry techniques(1,2).
The present study was aimed at compar-ing lumbar spine and femoral neck BMD measurements with these devices in a populational sample, regardless race/eth-nicity, gender, age, body weight, or clini-cal status, to investigate the performance relation between both devices in a full-operational condition.
MATERIALS AND METHODS
DEXA studies were performed with a
Hologic® QDR 4500C apparatus, and
CDEXA studies, with a Cromox® CXD
3.2.1 system, calibrated with a Cromox®
reference phantom for bone absorptio-metry.
According to Blake et al.(3), the DEXA technology performs the scanning of the site in analysis, recording the x-ray beam power with dual kilovoltage components. This recording is performed by a solid-state sensor which detects the transmitted radia-tion and transfers the corresponding digi-tal value into a computer, generating two image matrices corresponding to the two photon energies. The mathematical treat-ment of absorptiometry data is performed through the analysis of two transmission equations for each pixel of the double im-age matrix of the site of interest, one equa-tion for each of the two x-ray beam kilo-voltages. For each photon energy, an equa-tion with exponential relaequa-tion between at-tenuation and transmitted radiation energy is converted into a linear equation by ap-plication of a logarithmic function. Once the relation between the soft tissues attenu-ation coefficients for both energies is de-fined, and once the bone mineral compo-nent attenuation coefficients for both
ener-gies are known, the two resulting linear equations present only two unknown mag-nitudes corresponding to the densities per area of bone mineral component and soft tissues. The resolution of the linear algebric system defines the two densities per area on each pixel of the image matrix. The inte-gration in area of density of the bone min-eral component, followed by the division of the integrated value by the total area, results in the BMD arithmetic mean of the site evaluated.
According to the manufacturer’s infor-mation, the CDEXA technology also pro-vides the two image matrices by exposure of the site analyzed by x-ray beams to two photon energies, through the operation of the bulb with two kilovoltages. The radia-tion beam energy is recorded on conven-tional radiographic films. Aiming at con-trolling variations both in the characteris-tics of the bulb emission and films chemi-cal processing, chemi-calibration metal phantoms are submitted to radiological exposure si-multaneously with the patient. The trans-ference of absorptiometry data into the computer is made by means of radiographic films digitization by a scanner with solid-state sensors, which catch the luminosity transmitted and transfer the corresponding values into the computer, constructing two image matrices corresponding to the pho-ton energies. The values of these image matrices are adjusted according to the phantoms response to radiation, so the absorptiometry data are corrected for a pattern of x-ray emission. The manufac-turer informs that the mathematical treat-ment of the absorptiometry data is per-formed as previously described for the DEXA technique, until the BMD arith-metic mean for the site analyzed is ob-tained.
According to Steel et al.(4), the effective radiation doses to the patient, in fan beam DEXA for studying hip and lumbar spine, are respectively 56 µSv and 59 µSv, and may reach 74,7 µSv, according to Maher(5). With the CDEXA technology, where the images acquisition is made on conven-tional radiographic films, the estimated effective radiation doses for the hip and lumbar spine assessment are respectively 1.3 mSv and 2.6 mSv. This estimation is made because the CDEXA technique
re-quires two images from each site (gener-ated in two kilovoltages), and the typical, individual effective dose for acquisition of lumbar spine images is 1.3 mSv, according to the U.S. Food and Drug Administra-tion(6), resulting in an effective radiation dose of 2.6 mSv for lumbar spine evalua-tion. The dose required for generation of a hip image corresponds to 50% of the dose required for lumbar spine, so the total ef-fective radiation dose for hip assessment is 1.3 mSv.
The comparison between the absorptio-metry techniques has taken into consider-ation the results of density/area in gram units of bone mineral component/cm² of the lumbar spine (L2 to L4 vertebrae) and right femoral neck. The anteroposterior projection was adopted for lumbar spine assessment; and for the proximal femur, the orthogonal projection (the usual position-ing for bone densitometry) achieved by means of 30° internal rotation of the foot was adopted.
According to the manufacturer’s
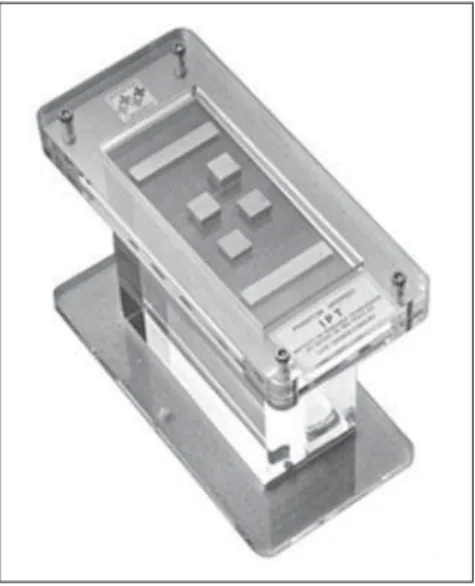
infor-mation, the Cromox® reference phantom
for bone absorptiometry (Figure 1) includes four plates of oven-dried bovine bone specimens with regular thickness, whose mass and area were measured by the me-trology laboratory of Instituto de Pesquisas Tecnológicas (IPT) in São Paulo, SP, Bra-zil. The specimens were kept in the oven for drying until their mass presented a
Figure 1. Cromoxreference phantom in bone
variation of less than 1% along an eight-hour interval. The drying process was com-pleted in 50 hours. The mass/area ratio pro-vides a bone density in g/cm² for calibra-tion of absorptiometry results.
Forty-three volunteers, with no distinc-tion of race/ethnicity, gender, age, body weight or clinical status, who had accepted the terms of agreement to participate in the present study, were evaluated during the period between March/2003 and June/ 2003. The patients were included in the study regardless their clinical or physical status, since the study was aimed at com-paring the performance of the two equip-ment units under adequate operational con-ditions for achievement of reliable results. For the right hip, the patients´ ages ranged between 48 and 84 years (mean and stan-dard deviation = 63.0 ± 9.5), while for the lumbar spine, ages ranged between 48 and 79 years (mean and standard deviation = 60.4 ± 8.6). Forty-one pairs of results for right hip and 32 pairs for lumbar spine were obtained by the DEXA and CDEXA sys-tems, however not all the patients contrib-uted with results for both sites (hip and lumbar spine).
The rejection criteria adopted for exclu-sion of pair of results of BMD measure-ments by both equipment units were: a) site thickness (abdominal or coxofemoral) > 24 cm; b) interference from soft tissues: ex-cess of gas on the lumbar spine vertebrae or overlapping of abdominal fat and femo-ral neck; c) results clearly non-compatible with the radiological evaluation of the site, in any of the equipment units. Additionally,
excess of gas on the Cromox® metal
phan-tom, inherent to the CDEXA method, was considered as a rejection criterion. Once these criteria were applied, two pairs of results for hip affected by soft tissues in-terference (overlapping of abdominal fat and femoral neck), one pair of results clearly non-compatible with the radiologi-cal evaluation of the hip, and one pair of results of hip where the presence of exces-sive gas on the lumbar vertebrae was ob-served were excluded from the study, and the remaining 38 pairs of results for hip, and 32 pairs of results for lumbar spine were compared by regression analysis. However, some discrepancies in the posi-tioning of the patients on both devices were observed (lack of strict observance of the 30° for internal rotation of the foot, as well as the lumbar spine alignment was not strictly reproduced). Despite the known influence of clothing elastic bands, feces and little abdominal gas on densitometry results, data from many patients have not been included since these items were not considered as rejection criteria. These oc-currences may affect the correlation of re-sults obtained by both equipment units.
Montgomery’s(7) regression and linear
correlation techniques were utilized for statistical data analysis calculated by supplementary regression and correlation
macros(8) with Microsoft Microsoft Excel
and Statistic Analysis System (SAS) appli-cations(9), and tested by Gauss and Markov mathematical models assumptions of inde-pendence, normality and null hypothesis rejection.
RESULTS
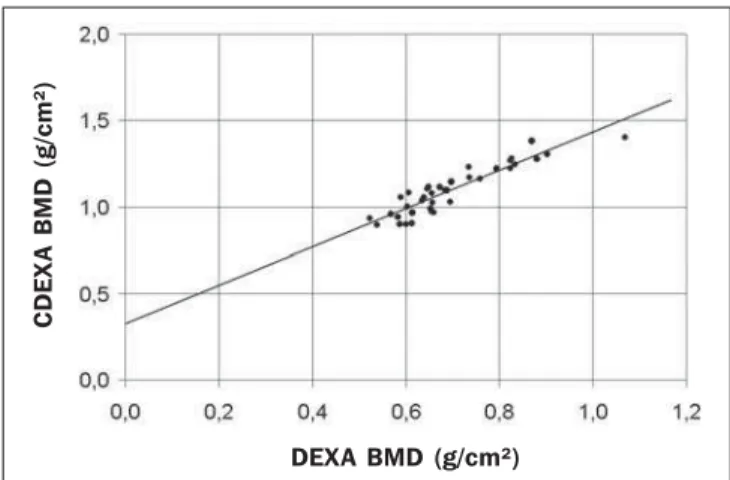
The comparison between BMD mea-surements with both densitometry devices is shown on Figure 2 for the femoral neck, and Figure 3, for the lumbar spine.
For the femoral neck, the linear regres-sion function for the group (n = 38, t-Stu-dent distribution) is:
BMDCDEXA = 0.326 + 1.105 BMDDEXA (1)
where: BMDCDEXA and BMDDEXA are,
re-spectively, the BMD values measured by CDEXA and DEXA; the correlation coef-ficient for femoral neck is r = 0.920, p < 0.0001. The data distribution and the re-gression line are shown on Figure 2.
For the lumbar spine, the linear regres-sion function for the group (n = 31, t-Stu-dent distribution) is:
BMDCDEXA = –0.025 + 1.616 BMDDEXA (2)
where the correlation coefficient is r = 0.923, p < 0.0001. The data distribution and the regression line are shown on Fig-ure 3.
In the clinical practice, the results ex-pressed as Tscore are significant for evalu-ating bone densitometry studies, since the publication of the World Health Organiza-tion (WHO) Study Group report, according to Blake et al.(3). The T
score adimensional parameter is defined by the equation:
Tscore = (BMD measured – mean BMD in young adults) / young adults SD (3)
where: young adults SD is the standard deviation for the young adults population.
Figure 3. Comparison between BMD measurement of lumbar spine by DEXA
and CDEXA systems. The regression line is shown with r = 0.923, p < 0.0001,
BMDCDEXA = –0.025 + 1.616 × BMDDEXA.
Figure 2. Comparison between BMD measurement of femoral neck by DEXA
and CDEXA systems. The regression line is shown with r = 0.920, p < 0.0001,
BMDCDEXA = 0.326 + 1.105 × BMDDEXA.
C
D
E
X
A
B
M
D
(
g
/c
m
²)
DEXA BMD (g/cm²)
C
D
E
X
A
B
M
D
(
g
/c
m
²)
Even if there is a BMD correlation, Tscore measured in both systems are compatible only if the values for mean BMD in young adults and young adults SD are appropri-ate, these reference values for young adults for both systems being obtained from their respective results reports. The mean BMD calculation in young adults corresponds to the BMD/young adults percentage ratio in the site, while the young adults standard deviation corresponds to the BMD
differ-ence/mean BMD in young adults/Tscore
ra-tio in the site. For each site, the value ob-tained for each of these parameters is the respective arithmetic mean among the whole group results.
The arithmetic mean of the Tscore differ-ence (∆Tscore arithmetic mean) is calculated for the group, the ∆Tscore adimensional pa-rameter being defined as:
∆Tscore = Tscore CDEXA – Tscore DEXA (4) and calculated for each patient, resulting in a ∆Tscore arithmetic mean = 0.019l for the femoral neck and ∆Tscore arithmetic mean = 0.228 for the lumbar spine.
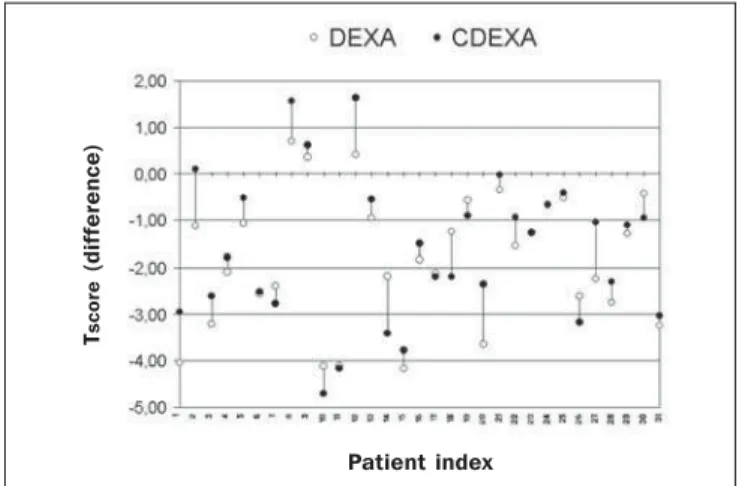
The ∆Tscore graphic representation is shown on Figure 4 for the femoral neck and Figure 5 for the lumbar spine, where the pa-tients are indexed 1 to 38 (hip group), and 1 to 31 (lumbar spine group).
Aiming at investigating how the results provided by both devices can agree as re-gards the classification of the patient’s skel-etal status according to the WHO criteria, as normal, osteopenia and osteoporosis, as
reported by Blake et al.(3), the results for each site were compared through the skel-etal status parameter (SkS):
SkS = normal, when Tscore≥ –1.00 SkS = osteopenia, when Tscore < –1.00 and
Tscore≥ –2.50
SkS = osteoporosis, when Tscore < –2.50 (5)
Agreement as regards skeletal status is defined as the same skeletal status classi-fication for results obtained by both sys-tems for a same patient, according to the mentioned mathematical criterion. Based on this definition, agreement as regards skeletal status was found in 76.3% of pairs of results for hips (n = 38), and in 77.4% for lumbar spine (n = 31). It is important to note that some pairs of BMD results present differences of decimals or centesi-mals of Tscore unit, but they are sufficient for determining different skeletal status.
Another alternative method for evaluat-ing agreement as regards skeletal status is considering the results of a same skeletal status obtained in both devices for a same patient and for at least one of the sites evaluated. In this case, agreement as re-gards skeletal status was found in 96.2% of pairs of results for hips and/or lumbar spine of the 26 patients submitted to measure-ments of both sites.
DISCUSSION
BMD results were linearly correlated with r = 0.920 for femoral neck and r =
0.923 for lumbar spine, similarly to the cor-relation coefficient r ≥ 0,95 reported by Faulkner et al.(10) in a comparison between DEXA Lunar and Hologic systems. Statis-tically, a correlation coefficient > 0.9 is very significant, expressing a small disper-sion for results obtained in both devices for the same patients. Therefore, measure-ments performed in a device may be ob-tained in the other with small mean statis-tical differences. The correlation occurs at the same level both for hip and lumbar spine, since the correlation coefficients for both sites are very similar. This means that the significant correlation between the two methods is non-specific for the other site. The ∆Tscore arithmetic means for hip and lumbar spine are very low, and not statisti-cally significant, since these values corre-spond to a BMD variation lower than the least significant change (LSC) which is the lower BMD variation considered as statis-tically significant according to the Interna-tional Society for Clinical Densitometry (ISCD). Using the algorithm offered by the
ISCD(11), the LSC is determined for each
device and for each site. For the CDEXA device, with 30 pairs of results, the LSCs were 0.088 g/cm² for hip, and 0.123 g/cm² for lumbar spine, resulting in ∆Tscore LSC = 0.39 for hip, and ∆Tscore LSC = 0.62 for lum-bar spine., according to the equation:
∆Tscore LSC = LSC / young adults SD (6)
According to the same algorithm, the LSC corresponds to 2.77 times the variance
Figure 4. Graphic visualization of Tscore and ∆Tscore for femoral neck
demon-strates little differences in Tscore between DEXA and CDEXA results (∆Tscore arith-metic mean = 0.191), except for some few cases, probably because of op-erational errors like ROI variations and patients positioning (internal rotation of the foot).
Figure 5. Graphic visualization of Tscore and ∆Tscore for lumbar spine
demon-strates little differences in Tscore between DEXA and CDEXA results (∆Tscore arith-metic mean = 0.228), except for some few cases, probably because of varia-tions in the abdominal gas and feces distribution and L2 to L4 vertebrae align-ment.
T
sc
o
re
(
d
if
fe
re
n
c
e
)
Patient index
T
sc
o
re
(
d
if
fe
re
n
c
e
)
coefficient (VC) at 68% confidence level. for the DEXA system, VC = 1.8% is re-ported by Blake et al.(3), allowing the cal-culation of the LSC for each site, resulting in ∆Tscore LSC = 0.45 for the hip, and ∆Tscore
LSC = 0.49 for the lumbar spine, by means
of the equation (6). The ∆Tscore arithmetic mean = 0.191 for the femoral neck and
∆Tscore arithmetic mean = 0.228 for the lum-bar spine are lower than ∆Tscore LSC values for these sites in both systems, that is to say, they are sufficiently low to consider as adequate the interchangeability between Tscore results found through both systems.
Figures 4 and 5 show constant, very little differences in Tscore, except for some few cases of patients with indices 14, 16, 24 and 27 for hip, and patients with indi-ces 2,12,14, 20 and 27 for lumbar spine. For these cases, the not so little differences in Tscore probably occur as a result of opera-tional errors such as variation in the defi-nition of regions of interest (ROIs) and patient positioning (internal rotation of the foot, for the hip), variations in abdominal gas and feces distribution, and vertebrae L2 to L4 alignment (for the lumbar spine). In CDEXA devices, the inaccuracy of lumbar spine results because of the presence of abdominal gas and feces may be minimized if the images are rejected upon visual in-spection of the radiographs, and the patient is submitted to a new radiographic expo-sure after appropriate intestinal prepara-tion.
The skeletal status parameter is intro-duced for the understanding of the inter-changeability between the two methods in the clinical practice, since the first clinical interpretation of densitometry results is performed according to the WHO defini-tions. Considering the strictness of the WHO classification as regards status tran-sition (normal/osteopenia, Tscore = –1.00;
osteopenia/osteoporosis, Tscore = –2.50), an eventually non-elevated level of agreement is expected, even in comparisons between results from the same device, as a function of results deviation because of the device accuracy. With results classified according to the WHO categorization for each site, agreement as regards skeletal status does not occur for 24% of patients who had their hips evaluated, and for 23% of patients who had their lumbar spine evaluated. The agreement rate increases as the results are non-specifically classified for each site, i.e., considering as agreement as regards skeletal status the agreement in at least one of the two sites evaluated. Agreement as regards skeletal status is not found in only 4% of the patients evaluated by both sys-tems when at least one of the two sites (hip or lumbar spine) is considered.
For conversion of BMD values mea-sured by CDEXA into DEXA scale, the appropriate equation obtained by linear regression for the femoral neck group is:
BMDDEXA = –0.143 + 0.767 BMDCDEXA (7)
with p < 0.0001, while for the lumbar spine group the appropriate equation is:
BMDDEXA = 0.143 + 0.527 DMOCDEXA (8)
with p < 0.0001.
However, there is a necessity for addi-tional studies involving a higher number of cases and with a more strict control over patients positioning and definition of ROI in the software for BMD measurement by both equipment units to evaluate the cor-relation between the devices when submit-ted to tests with a higher reproducibility of operational procedures.
Acknowledgments
The authors thank the manufacturers of
the Cromox CXD 3.2.1 system for
provid-ing technical information and license for utilization of the software during the study, allowing the processing of paired densito-metric studies and those performed in the
Hologic QDR 4500C system owned by
the author. The present study has been de-veloped as a previous condition for the
evaluation and acquisition of the Cromox
CXD 3.2.1 system by the author.
REFERENCES
1. Blake G, Rodin A, Fogelman I. A comparative study of dual photon absorptiometry and dual energy X-ray absorptiometry. J Bone Mineral Res 1989;4 Suppl. 1:S398.
2. Adachi JD, Webber CE. The interchangeability of radioisotope and X-ray based measurements of bone mineral density. Br J Radiol 1991;64:217– 220.
3. Blake GM, Wahner HW, Fogelman I. The evalu-ation of osteoporosis: dual energy X-ray absor-ptiometry and ultrasound in clinical practice. 2nd ed. London, UK: Martin Dunitz, 1999. 4. Steel SA, Baker AJ, Saunderson JR. An
assess-ment of the radiation dose to patients and staff from a Lunar Expert-XL fan beam densitometer. Physiol Meas 1998;19:17–26.
5. Maher KP. Department of Medical Radiations Science, RMIT University, Australia. [cited 2006 June 5]. Available in: http://homepage.mac.com/ k i e r a n m a h e r / d i g r a d / D R P a p e r s / DEXA_Dosimetry.html
6. U.S. Food and Drug Administration, Center for Devices and Radiological Health. Whole body scanning using computed tomography (CT). What are the radiation risks from CT? [cited 2006 June 5]. Availabble from: http://www.fda.gov/ cdrh/ct/risks.html
7. Montgomery DC. Introduction to statistical qual-ity control. New York: John Wiley & Sons, 1991. 8. McFredries P. Excel 5 super book. Rio de Janeiro:
Berkeley Brasil Editora, 1994.
9. SAS Institute Inc. SAS/STAT guide for personal computers. 6th ed. Cary: SAS Institute, 1996. 10. Faulkner KG, Roberts LA, McClung MR.
Dis-crepancies in normative data between Lunar and Hologic DXA systems. Osteoporos Int 1996;6: 432–436.