M
ASTER OF
S
CIENCE IN
FINANCE
M
ASTERS
F
INAL
W
ORK
PROJECT
EQUITY RESEARCH
:
C
HINA
V
ANKE
C
O
.,
L
TD
S
ANG
J
INLAMU
M
ASTER OF
S
CIENCE IN
FINANCE
M
ASTERS
F
INAL
W
ORK
PROJECT
EQUITY RESEARCH
:
C
HINA
V
ANKE
C
O
.,
L
TD
S
ANG
J
INLAMU
S
UPERVISOR
:
JOÃO
CARVALHO
DAS
NEVES
Abstract
The Residential Housing Market in China has more than 30 years of development
history. Due to the reform and liberalization in 1980’s, Deng Xiaoping started to
define real estate as commodity in China. In 1987, Shenzhen conducted the first
public land auction, symbolizing the official commercialization of Chinese real estate.
Vanke, one year later, entered the real estate industry. After more than 20 years, it
has become the largest residential developer
in China, and is known as the “city real
estate and service provider”. From Vanke, we can see the epitome of development of
all Chinese real estate companies. The economic downturn and the changing world
pattern are the major concerns for Chinese real estate developers in the recent years.
These concerns are reflected by Vanke, which is the reason why I choose Vanke for
Master Final Work equity research.
This report adopts the research report format recommended by the CFA Institute.
The full text includes 8 parts including Research Snapshot, Business Description and
Management and Corporate Governance. It analyzes finance and management of
Vanke in the past four years and forecasts the operations for the next five years.
Generally, Vanke's operational development is stable. Persisting in high asset
turnover strategy, it has about 20% ROE on the period analyzed. In terms of leverage,
in the past two years, Vanke has increased its debt level from 16.36% to 17.09%.
Besides developing the real estate market, during the last years, Vanke entered in
new segments of the real estate market such as real estate services and rental
housing.
April 24, 2019 is the current date valuation and 2020YE is the target time for price
forecast. The valuation uses DCF as the main method, and Relative valuation as
auxiliary method. As a result, the target price is RMB 43.97. Compared with current
price at April 24, 2019 of RMB 29.60, presents an upside potential of 48.54%.
However, there are significant potential risks. The GDP growth rate deceleration and
population are two macroeconomic risks which have long-term and profound impacts.
Also, real estate tax legislation and further real estate restrictions are the two most
substantial political risks. Finally, the recommendation for Vanke is BUY with medium
risk.
JEL classification: G10; G18; G32; G34; G35.
Keywords: Equity Research; Valuation; Real Estate; Rental Housing; Deceleration;
Population.
Acknowledgements
This research is the final dissertation for Master in Finance at ISEG, University of
Lisbon.
Firstly, I would be thankful to Professor. João Carvalho das Neves for his invaluable
support, guidance and availability throughout the project.
In addition, I would like to thank Dr. Ví
ctor Barros for his encouragement, guidance
and support during the introduction course of ER.
I am also very graceful to all the professors during the Master Courses for giving me
such great and selfness help.
Finally, I would like to express my appreciation and love to my parents, to my friends,
to all the faculty members of ISEG for their kind assistance and cooperation offered
during my project.
Sang Jinlamu
Index
Abstract
i
Acknowledgements
ii
Index
iii
List of Figures
iv
List of Tables
vi
1.
Research Snapshot
1
2.
Business Description
2
3.
Management and Corporate Governance
3
4.
Industry Overview and Competitive Positioning
5
5.
Investment Summary
10
6.
Valuation
11
7.
Financial Analysis
15
8.
Investment Risks
17
Appendices
1
Appendix 1: Statement of Financial Position
1
Appendix 2: Income Statement
2
Appendix 3: Cash Flow Statement
3
Appendix 4: Key Financial Ratios
4
Appendix 5: Common-Size Statement of Financial Position
5
Appendix 6: Common-Size Income Statement
6
Appendix 7: Forecasting Assumptions
7
Appendix 8: Business and Corporate Structure
9
Appendix 9: Vanke’s Sales and Rental Housing Revenue Forecast
10
Appendix 10: Vanke DCF Analysis
11
Appendix 11: Terminal Assumption
12
Appendix 12: Vanke Three Stage DDM Analysis
13
Appendix 13: Vanke Multiple Valuation Analysis
14
Appendix 14: Vanke DCF Method Robustness Test
16
Appendix 15: Vanke DCF Monte Carlo Simulation
18
Appendix 16: Vanke and Baoneng Shareholding Battle
19
Appendix 17: China’s Urbanization Rate
20
Reference
21
List of Figures
Figure 1. Vanke’s cash and net debt
1
Figure 2. Vanke revenue segments
2
Figure 3. Revenue per segment
2
Figure 4. Sale area (sq. m)
2
Figure 5. Number of employees (K)
2
Figure 6. Vanke liquidity
3
Figure 7. Vanke RH Revenue (Mn RMB)
3
Figure 8. Shareholder’s structure
4
Figure 9. Real GDP Growth & CPI Growth & M2 Growth
5
Figure 10. Nominal GDP & M2
5
Figure 11. Household debt (% of GDP)
5
Figure 12. Per capita disposable income g
5
Figure 13. Natural population data
6
Figure 14. Population growth
6
Figure 15. Land sales
6
Figure 16. Construction data
6
Figure 17. Primary Transaction volume
7
Figure 18. Privative home index (YoY%)
7
Figure 19. Construction cost
7
Figure 20. Monetized resettlement of shelter reform process
7
Figure 21. Talent inflow of four new tier 1 cities, first quarter of 2018
8
Figure 22. Reverse repo add-in of central bank (Bn RMB)
8
Figure 23. Reserve requirement ratio
8
Figure 24. Porter’s Five Forces Analysis
9
Figure 25. Vanke rental housing market shares
11
Figure 26. Vanke rev. segments and PD rev.g.
11
Figure 27. Rental market indicators growth
12
Figure 28. Vanke’s sales indicators growth
12
Figure 29. Commodity housing market
12
Figure 30. Vanke land acquisition volume and price
13
Figure 31. Vanke’s CAPEX
13
Figure 33. Vanke’s WACC
14
Figure 34. China urbanization rate
14
Figure 35. Vanke Rev. g & NI g& Cost of Rev.g
15
Figure 36. Dupont analysis
15
Figure 37. Vanke inventory turnover
16
Figure 38. Vanke liquidity ratio
16
Figure 39. Vanke debt structure
16
Figure 40. Vanke dividends and payout ratio
16
Figure 41. Vanke Risk Matrix
17
Figure 42. RMB/USD exchange rate
17
Figure 43. Major cities' house price-to-income ratio 2018
17
Figure 44. China social debt ratio
17
Figure 45. Local governments debt
18
Figure 46. Vanke net gearing ratio
18
Figure 47. Vanke landbank (Mn Sq.m.)
18
Figure 48. Intensive stage of the battle
19
Figure 49. Monte Carlo Sensitivity distribution
19
List of Tables
Table 1. Vanke market data
1
Table 2. Vanke’s price target
1
Table 3. Financial highlights
1
Table 4. Vanke board members
3
Table 5. Vanke supervisory committee
3
Table 6. Vanke senior management
4
Table 7. Average annual economic profit bonus (Mn)
4
Table 8. SWOT analysis
9
Table 9. PESTLE analysis
10
Table 10. Target price by method
10
Table 11. DCF Valuation
10
Table 12. WACC assumptions
14
Table 13. Multiple valuation
15
Sang Jinlamu([email protected],) Master in Finance
Vanke: Steady development, long-term
transformation
(YE2020 Price Target of RMB 43.97 (+48.54%); recommendation is to BUY with Medium Risk)
The final recommendation for Vanke Co., Ltd here is BUY with a YE2020 target price of RMB 43.97 and an upside potential of 48.54% in comparison with the last closing price of RMB 29.60 on April 24th, 2019 with medium risk. The company’s revenue has grown steadily over the years. Holding a lot of cash and maintaining a relatively low net debt ratio, it owns a high risk-awareness in between the rivals. Facing the downturn of the domestic economy, the industrial transitional dilemma, and the hindered long-term revenue growth of real estate market, Vanke adopted the direction of “Steady development, long-term transformation”.
Revenue growth decelerates
Considering the overall economic and real estate market downturn, the annual growth rate of revenue for 2019F-2023F is forecast to fall stably from 13.86% to 2023F GDP growth rate of 8.58% through five years.
ROE will continue stable
As an industry benchmark, Vanke has kept a ROE ratio around 20% for many years. In the explicit period forecast, the ROE of Vanke will still maintain this advantage.
Keeps high cash ratio
The probability of new big debt plans will decrease in the future due to the ending of HK MTN Programme and two RMB Corporate Bonds Plans, so it is forecasted that cash ratio will be reduced from very beginning in the forecasting period, while it will keep in a reasonable range and start to increase soon.
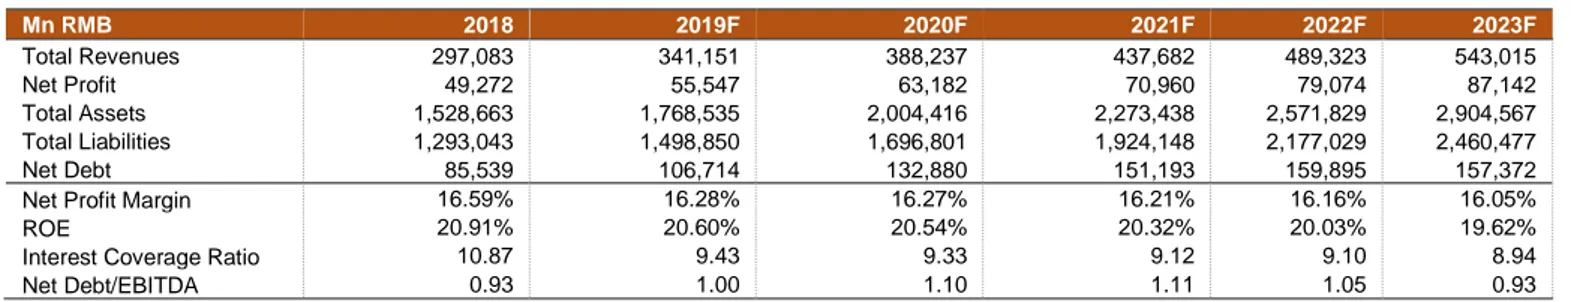
Table 3. Financial highlights
Source: Author
1.
Research Snapshot
Table 2. Vanke’s price target
Source: Author
Valuation Target Price
DCF ¥43.97 Multiples ¥45.70 Mn RMB 2018 2019F 2020F 2021F 2022F 2023F Total Revenues 297,083 341,151 388,237 437,682 489,323 543,015 Net Profit 49,272 55,547 63,182 70,960 79,074 87,142 Total Assets 1,528,663 1,768,535 2,004,416 2,273,438 2,571,829 2,904,567 Total Liabilities 1,293,043 1,498,850 1,696,801 1,924,148 2,177,029 2,460,477 Net Debt 85,539 106,714 132,880 151,193 159,895 157,372
Net Profit Margin 16.59% 16.28% 16.27% 16.21% 16.16% 16.05%
ROE 20.91% 20.60% 20.54% 20.32% 20.03% 19.62%
Interest Coverage Ratio 10.87 9.43 9.33 9.12 9.10 8.94
Net Debt/EBITDA 0.93 1.00 1.10 1.11 1.05 0.93
China Vanke
Co., Ltd
Buy
Medium risk
April 2019Shenzhen Stock Exchange
Figure 1. Vanke’s cash and net debt
Source: Vanke annual reports
0.13 0.14 0.14 0.15 0.15 0.16 0.16 0 50000 100000 150000 200000 250000 300000 350000 400000 450000 500000 2018 2019F2020F2021F2022F2023F Cash and cash equivalents (Mn RMB) MV debt (Mn RMB) Cash ratio 15 20 25 30 35 7/3/2018 8/3/2018 9/3/2018 10/3/2018 11/3/2018 12/3/2018 1/3/2019 2/3/2019 3/3/2019 4/3/2019
Table 1. Vanke market data
Source: Bloomberg
Market Profile
Closing price (April 24th) ¥29.60 52-week price range ¥20.4 - ¥33.6
Shares outstanding 11.04B Market capitalization 326.76B Avg. Volume 61.46M P/E 9.73 P/B 2.06 ROE 21.68
China Vanke Co., Ltd., established in 1984, headquartered in Shenzhen, entered
the real estate industry in 1988. In 1993, the residential property development was identified as the core business of the company. Initially Vanke focused on the Shenzhen property market. Till 2006, its business has covered more than 20 cities focusing on the economic circles of the Pearl River Delta, the Yangtze River Delta and the Bohai Rim. The company was the second listed private company in the stock exchange of Shenzhen and it is also the largest urban and rural development and living services provider in terms of volume in China. Furthermore, Vanke has built its presence in 7 cities outside of Mainland China, namely, Hong Kong, Singapore, New York, San Francisco, Seattle, London and Kuala Lumpur. In July 2016, the Group was first listed on Fortune Global 500, ranking 356th. In 2017, the Group ranked 307th.
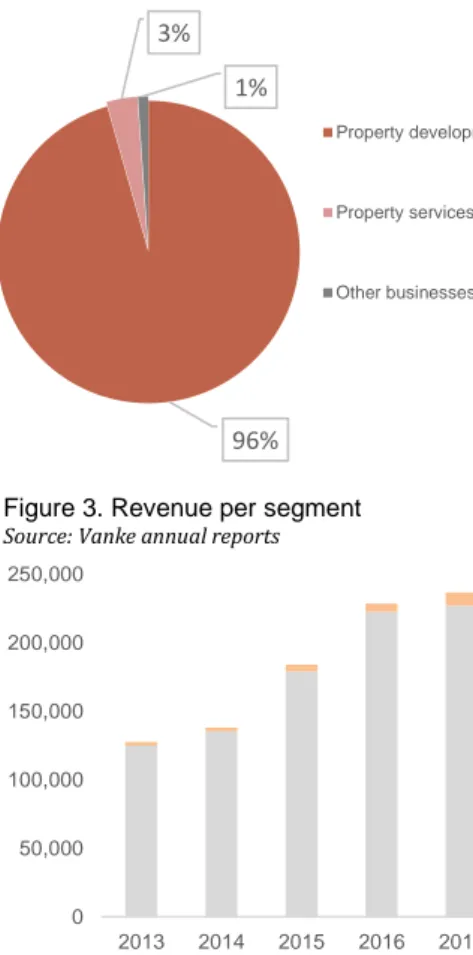
The core business of the Group includes property development, property service and other business (Figure 3). The Property Development is the significantly core segment of the company, which represent 96% of the group revenue in 2018 (Figure 2). In 2019, the new construction area of the existing projects of the Group is expected to be 36.090 million sq. m. It is estimated that the area to be completed in 2019 will be 30.766 million sq. m. By geographical regions, the booked area from the Southern Region, Shanghai Region, Northern Region and Central and Western Region accounted for 23.64%, 29.84%, 24.00% and 21.49%, respectively, of the total booked sales derived from the Group’s property development business in 2018 (Figure 4).
Property services business adheres to the development strategy of
“simultaneous development of the residential and commercial sectors” of the company. In 2018, as a subsidiary company, Vanke Service achieved revenue of RMB9.80 billion, representing a year-on-year increase of 36.1%. Vanke Service was also named “Top 1 in China’s Top 100 Comprehensive Property Services Enterprises” for nine consecutive years.
In 2018, the Group further enhanced its positioning to “urban and rural development and living services provider”, on the basis of consolidating the inherent advantages of residential properties development and property services.
Employee
In the recent years, the staff size of Vanke has gone through a highly increasing process. As at 31 December 2018, there were 104,300 employees on the Group’s payroll (Figure 5), representing an increase of 34.2% from that of the previous year. The average age of the employees was 31.1 and the average year of service was 2.3 years. Among which 68,709 employees were male, and 35,591 employees were female.
Company Strategies
Operating efficiency: Vanke seeks to launch and sell the properties in an efficient
and disciplined manner, to extend the application of technological products and innovative technology in each business scenarios in order to achieve a high project operating efficiency, as well as to provide quality products and services to address the genuine demand of customers.
Advanced property services: along with the property pre-sale and after-sale
processes, Vanke has actively learned from Pulte Homes, which is one of the top four real estate companies in the United States. The company applies technological tools to effectively respond to the changing customer service needs,
2.
Business Description
Figure 3. Revenue per segment
Source: Vanke annual reports
0 50,000 100,000 150,000 200,000 250,000 2013 2014 2015 2016 2017 Property Sales (Mn RMB) Others(Mn RMB)
Figure 4. Sale area (sq. m)
Source: Vanke annual reports
0 5,000,000 10,000,000 15,000,000 20,000,000 25,000,000 2014 2015 2016 2017 2018 Central and Western Region Northern Region Shanghai Region Southern Region
Figure 5. Number of employees (K)
Source: Vanke annual reports
0 10 20 30 40 50 60 70 80 2012 2013 2014 2015 2016 2017 Figure 2. Vanke revenue segments
Source: Vanke annual report 2018
96% 3% 1% Property development Property services Other businesses
including division in detail by characters of customers and lifelong service to cultivate customer loyalty.
Liquidity-emphasis: under the influence of economic downturn, Vanke seeks to
maintain a stable liquidity level by cautious leverage control (Figure 6), in order to ensure the flexibility in financing. It strives to maintain a healthy financial position and a leading credit rating in the industry
Prudent management of investment: the company will broaden resource
acquisition channels, pay attention to the opportunity for acquiring quality resources through merger and acquisition and support sustainable development by paying attention to nonlinear development opportunities.
Vanke’s “industrialization 2.0”: updating and upgrading production system of
development business, Vanke has accomplished the concept of “enhancing quality and efficiency, and reducing reliance on labor and environment pollution”, to elevate overall construction capability. Practically, it extends the application of technological products and innovative technology in each business scenario.
Rental housing business: In 2018, Vanke upgraded the rental residential
business to its core business, and continued to increase the layout of rental housing around the core cities and improve the opening efficiency and quality of the acquired projects. Up to now, Vanke's long-term rental apartment business covers 35 major cities, with a cumulative opening of more than 60,000. The average occupancy rate of projects with more than 6 months of operation is about 92%.
Responsibility and risk prevention system: to ensure safety at work and
maintain the bottom-line for quality and moral standards, each of the company’s business unit will establish risk prevention system applicable to their specific business nature, to contain material exposure, particularly those less likely high-risk incidents. Meanwhile, Vanke realizes correspondence of responsible persons to related activities. That is, each of their business group and business unit will complete organizational realignment and realize correspondence of responsible persons to related activities,
In accordance with the Company Law of the People’s Republic of China, the Rules Governing the Listing of Securities on The Stock Exchange of Hong Kong Limited, the Standards on Corporate Governance of Listed Companies, the Articles of Association of the Company and other relevant regulations, abided by its corporate values of simplicity, transparency, standardization and responsibility, the company has established a corporate governance structure with complete functions.
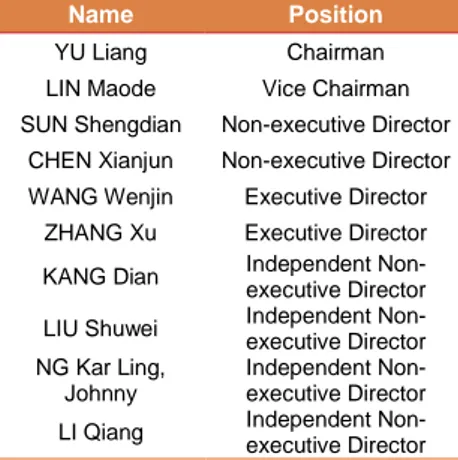
The management team is composed by the Board of Directors, Supervisory Committee, three other committees and senior management team. The Board consists of 10 members (Table 4), including one chairman, one vice-chairman. At least one-third of the Board members are independent, and at least one independent director shall be a professional accountant. The Board of Directors is accountable to the General Meeting of Shareholders, exercising the right of decision-making regarding business operations. The Supervisory Committee
consists of shareholder representatives and staff representatives (Table 5). Supervisors assumed by the Company’s staff representatives shall not be less than one-third of the total number of supervisors. The supervisory committee comprises three supervisors, including a chairman. The Supervisory Committee is
3.
Management and Corporate Governance
Table 4. Vanke board members Source: Vanke annual report 2018Name Position
YU Liang Chairman
LIN Maode Vice Chairman
SUN Shengdian Non-executive Director
CHEN Xianjun Non-executive Director
WANG Wenjin Executive Director
ZHANG Xu Executive Director
KANG Dian Independent
Non-executive Director
LIU Shuwei Independent
Non-executive Director NG Kar Ling,
Johnny
Independent Non-executive Director
LI Qiang Independent
Non-executive Director
Figure 6. Vanke liquidity
Source: Author 0 0.5 1 1.5 2011 2012 2013 2014 2015 2016 2017 Cash Ratio Current Ratio
Table 5. Vanke supervisory committee
Source: Vanke annual report 2018
Name Position
XIE Dong Chairman
ZHENG Ying Member
ZHOU Qingping
Employee representative member
Figure 7. Vanke RH Revenue (Mn RMB)
Source: Vanke’s annual reports
0 2000 4000 6000 8000 10000 12000
accountable to the General Meeting of Shareholders. In addition to inspecting and supervising financial affairs and senior management's duty fulfillment, the Board of Supervisors also organizes inspections to the subsidiaries, strengthening the supervision of their operations. Additionally, there are three other committees: Audit Committee, Remuneration and Nomination Committee, Investment and Decision-Making Committee. All such committees shall consist of directors. The main responsibility of those three committees are supporting the board in related issue and governance, researching on the company's long-term development strategy and making recommendations on major investment decisions. Apart from this, the Company has one senior management team (Table 6).
The remuneration of the Company’s senior management members was
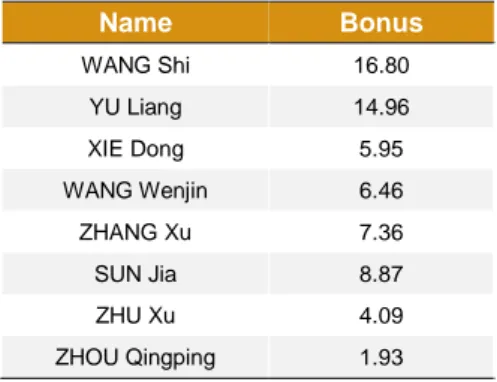
determined not only with reference to market level but also in accordance with the growth in the overall operating results of the Company. In January 2018, the company's economic profit bonus plan was considered and approved at the Fourth Meeting of the Eighteenth Session of the Board (Table 7). Nowadays the Group’s remuneration system consists of fixed salary, annual bonus and economic profit bonus.
In relation to the General Meeting of Shareholders, this organ of the Company lawfully exercise its powers as follows: i) decide on the business policies and investment plans of the Company; ii) elect and replace directors/supervisors and decide on the remuneration of the directors/supervisors; iii) consider and approve the report of the board and the supervisor committee; iv) make a resolution on the increase or decrease of the registered capital and the issuance of bonds by the Company; v) amend the Company’s Articles of Association; etc..
Shareholder Structure
After the so-called most intense equity battle between Vanke and Baoneng (Jushenghua & Foresea Life Insurance) in China’s history has come to an end in 2017, SZMC (Shenzhen Metro Group Co., Ltd.), with 14.07% of Vanke’s shares transferred from China Evergrande, became the largest shareholder of the Group (Figure 8) with a total stake in Vanke of 29.38% instead of China Resources and Baoneng. Baoneng now occupies the second place by 13.16%. As we can see, the Vanke’s mix ownership structure presents an obvious character of dispersion. Along with the stock market downturn in 2016, Vanke’s shareholder structure became more fragile and vulnerable than ever before.
Social Responsibility
Responding to national appeals of “housing occupation instead of vicious speculation, and equal emphasis on rent and purchase”, since 2017, Vanke have attempted to transform certain old buildings in urban villages into long-term rental apartments to provide a higher quality living environment for young people working in the cities. Meanwhile, the company served as the chief editor and editing member of 9 national, industry and local standards, and obtained over 120 domestic and internal technical patents.
As for environmental protection, Vanke incorporated the goal of “building an excellent green business” into its corporate vision as early as 2008. Over the years, Vanke has continuously explored ecological planning design, green development and construction and innovation and upgrade to green and eco-friendly technology. In 2011, Vanke entered into the Enterprise Initiative of Biodiversity Conservation. In 2014, it participated in the WWF Climate Savers Program and became the world's first real estate climate saver. In 2016, Vanke worked with the Alxa SEE Conservation to initiate the Real Estate Industry Green Supply Chain Action to
Table 6. Vanke senior management
Source: Vanke annual report 2018
Name Position
ZHU
Jiusheng President and CEO
WANG Wenjin
Executive vice president and CRO
ZHANG Xu Executive vice president
and COO
Figure 8. Shareholder’s structure
Source: Vanke annual report 2018
SZMC
HKSCC Nominees Limited Jushenghua
AnBang Life Insurance
Guosen Securities Foresea Life Insurance-HaiLiNianNian CMS Wealth HKSCC
Central Huijin Asset Management Foresea Life Insurance-JuFu Product Others
Table 7. Average annual economic profit bonus (Mn)
Resource: Vanke documents
Name Bonus WANG Shi 16.80 YU Liang 14.96 XIE Dong 5.95 WANG Wenjin 6.46 ZHANG Xu 7.36 SUN Jia 8.87 ZHU Xu 4.09 ZHOU Qingping 1.93
motivate upstream and downstream enterprises to fulfill environmental protection responsibilities
Industry Overview
Macroeconomic
In recent years, China has been enjoying the reputation as the engine of the world economy. However, it is now broadly admitted in domestic opinion that our economy now faces a serious deceleration tendency because of several essential factors like trade conflicts, real estate industry slows down and heavy industry overcapacity. Starting from the last year’s real GDP growth rate result of 6.6% (Figure 9), today economists give a prediction of 6.2% for 2019. Along with two big core points related to limited financing for private companies and state-owned enterprise debt risk, the deceleration pressure seems will stay in the next whole year. The economy-stability strategy and policy are gradually implemented. Those methods include expansion of infrastructure investment, de-capacity and property incentive to private companies. As far as we know, a loose monetary policy will be implemented step by step to help revitalize the real economy in the future. It is predicted that exists a high possibility for Chinese economic growth to bottom out in the second quarter of 2019, though the long-term slowing down risk will still exist.
Money supply
In 2008, the sub-prime crises in the US spread to domestic economy of China. Under the regulation and control of central bank, the M2 in China has presented a large volume. Since then, accompanying with several times of cut in RRR (requirement reserve ratio) and QE (quantitative easing), the M2 in China has step in a high-level progress in relation to GDP (Figure 10). According to analysts, besides direct influence of money policy, there is a large volume of M2 comes from the “production” and “re-investment” in the real estate market, which indicated a relatively high leverage ratio of the domestic loans in the recent years, and can be partly proved by the household debt in percentage of GDP (Figure 11). A large volume of money deviated from the real economy. Actually, from 2008 on, except for those short pick-ups between 2011 and 2012 and between 2014 and 2015 due to the macro-control by government, the growth rate of M2 has always been decreasing. In the recent two years, the growth rates of M2 were even lower than the sum of real GDP and CPI growth rates, which represents a scenario of credit squeeze. Briefly speaking, the old loan was too big and the new loan lacks dynamic.
Per capita disposable income growth
In 2018, the per capita disposable income of the national residents was RMB 28,228, with an increase of 8.7% over the previous year. After deducting the price factor, the actual increase was 6.5% (Figure 12). In the past few years, our per capita disposable income has been growing, but the overall growth rate has declined. Studies have shown that the increase in per capita disposable income of urban residents in China is the Granger reason for the development of the real estate industry. This effect is obvious, and the development of the real estate industry has no obvious effect on the increase in per capita disposable income of urban residents.
Population
4.
Industry Overview and Competitive Positioning
Figure 9. Real GDP Growth & CPI Growth & M2 GrowthSource: NBS (5.00) 0.00 5.00 10.00 15.00 20.00 25.00 30.00
Annual CPI Growth (YoY%) Annual GDP Growth (YoY%) Money Supply M2 (YoY%)
Figure 10. Nominal GDP & M2
Source: NBS 0 20000 40000 60000 80000 100000 120000 140000 160000 180000 200000 GDP (Bln) Money Supply M2 (Bln)
Figure 12. Per capita disposable income g
Source: NBS 6.00 7.00 8.00 9.00 10.00 11.00 12.00 2014 2015 2016 2017 2018 Per capita disposable income growth (%) Rural per capita disposable income growth (%)
Urban per capita disposable income growth (%)
Figure 11. Household debt (% of GDP)
Source: NBS 0 10 20 30 40 50 60
In 2016, the Chinese government fully liberated the second children in every family. From the statistical data, it can be found out that only in 2017, the birth rate has got a small pick-up, while, from 2018, the birth rate continued to decrease (Figure 13). Behind the situation, a too high housing price level and high parenting cost impedes the second child plan, which for sure will impact the long-term development of real estate market of China.
“Age before it gets rich” is the core topic in public opinion of China. The aging problem is especially grave in the big Chinese rural area. In the recently years, there has been a large flow of migration from rural area to urban area in China (Figure 14). Along with the macro-policy of regional coordinated development and construction of big central cities, the majority of opportunities has gone into the 1 and tier 2 cities, which in a certain degree, intensify the migration and aging problem of rural and those impacts even spreads to the 3 and lower tier cities.
Land
In 1982, the National People's Congress passed a newly revised constitution, which clearly defined the land ownership system for the first time and added the clause that “the land of the city belongs to the state”. Under the state system, land supply is monopolistic. Due to the lack of competition from other land supply entities, the pressure of population inflow is more reflected in the rise of land prices and house prices.
Since 2013, the land sales volume basically entered a long-term descending process (Figure 15). Although in recent two years it has started to rise with limited growth rate, in last six months, the increase of abortive land auction cases has proved the tendency to cooldown. On the contrary, the land sales value has kept in an increasing form, to a proportion of three times in comparison with 2008. According to analysts, the decreased land supply has a highly high correlation with the surge of housing prices in 2016.
Residential Market of Housing
The newly constructed resident houses have reached a negative growth rate between 2014 and 2015 due to inventory reducing tendency, which leads to a negative growth of constructed volume in the recent two years. What worth noting is that in 2018, the newly started house area reached growth rate of 19.7% (Figure 16). This number implicates the closing of inventory-reducing policy.
From the sales volume and prices of resident housing (Figure 17,18), it can be observed that 2013 and 2016 are two hot years of real estate market, which, respectively, has reached annual growth rates of 17.5% and 22.4% in sales volume. In 2013, the growth jumped because of the credit easing and land price increase. Between 2014 and 2015, the market seems starts to cool down due to the economic downturn pressure, market differentiation and supply exceeding demand, however, in 2016 the market passed a short highly warming stage, after that, the growth rate of sales volume fell rapidly (Figure 17).
The sharply rise in 2016 seems abnormal. There are several factors reasonable to explicate that, for example, the land supply decreases, the inventory reducing process entering the final stage, which lead to supply and demand imbalance and the movement of population. However, a final non-ignorable factor turns to a famous but polemic policy: Monetized Resettlement of Shelter Reform, which was one member of the inventory-reducing policies family.
Entering 2017, in real estate market, the housing prices growth rate in tier 1 and tier 2 cities experienced a dramatic decline. This situation has been mitigated in 2018. It worth noting that in 2017, the 3 and lower tier cities’ housing price growth
Figure 15. Land sales
Source: NBS 0 50 100 150 200 250 300 350 400 450 0 0.2 0.4 0.6 0.8 1 1.2 1.4 1.6 1.8 20112012201320142015201620172018 Land Sales Volume (Mln sqm, YTD) right
Land Sales Value (Tln, YTD) left Figure 14. Population growth
Source: NBS (3.00) (2.00) (1.00) 0.00 1.00 2.00 3.00 4.00 2012 2013 2014 2015 2016 2017 2018
Total Population Growth (%) Urban Population Growth (%) Rural Population Growth (%) Figure 13. Natural population data
Source: NBS 0 5 10 15 20 25 1 9 9 0 1 9 9 2 1 9 9 4 1 9 9 6 1 9 9 8 2 0 0 0 2 0 0 2 2 0 0 4 2 0 0 6 2 0 0 8 2 0 1 0 2 0 1 2 2 0 1 4 2 0 1 6 2 0 1 8 Birth Rate(‰) Mortality(‰)
Natural population growth rate(‰)
Figure 16. Construction data
Source: NBS 0 1000 2000 3000 4000 5000 6000 2011 2012 2013 2014 2015 2016 2017 2018
Newly Started (Mln sqm, YTD) Under Construction (Mln sqm, YTD) Completed (Mln sqm, YTD)
rate went through strange increasing rather than decreasing, which present a hysteretic quality (Figure 18).
The construction and building material cost
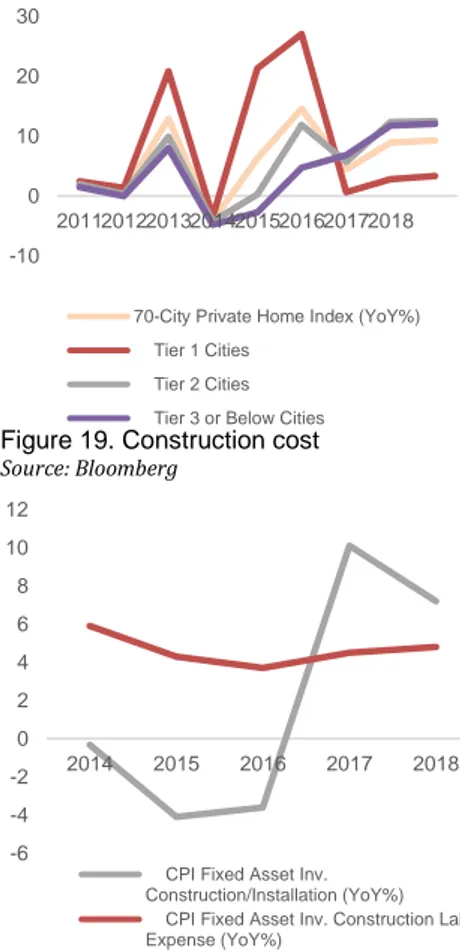
In 2017, the construction cost has risen dramatically. Relatively, the labor expense keeps rising steadily. Overall, real estate development costs growth has experienced a sharp rise in 2017 and began to fall back in 2018 (Figure 19).
Real Estate Policy Revision and Prediction
As we already mentioned before, Chinese real estate market discipline is not completely the same as that of occidental market due to various factors. Among them, “land-ownership belongs to the state” and lack of real estate tax are two of the most obvious characteristics. Although recently, there seems appear some reform on these factors. All in all, the government policies play an important role in the market.
Excess-inventory-reducing process
After the global financial crisis from 2008, Chinese government implemented a series of incentive measure included loose monetary policy. Between 2009 and 2011, China has experienced completely house prices rise and housing bubble, which promoted the supply stepped in excessive growth. Between 2011 and 2015, for the reason of restricted purchase limit and unreasonable layout of real estate enterprises, the inventory of real estate accumulated rapidly. In 2015, the central government proposed direction of excess-inventory- reducing in the Residential Market of Housing market. In 2016, under the double impact of inventory-reducing and population movement to the tier 1 and 2 cities, the house price of those cities has experienced a suddenly and sharply rise.
Monetized Resettlement of Shelter Reform involves the demolition of old
buildings and the resettlement of the original residents in cities. There are two current practices in China: physical placement and monetization. The monetized resettlement is compensated in the form of cash, allowing the demolished residents to purchase houses on the market without geographical restrictions (Figure 20). Since 2015, the “three-year plan for sheds reform”, especially to increase the proportion of monetization in sheds, is equivalent to government funding to support the purchase of houses, making real estate in the third- and fourth-tier cities extremely hot, and even driving the price of first- and second-tier cities in 2016. Compared with the obvious decline of the first- and second-tier cities in 2017, the third- and fourth-tier cities keep increasing, and the financial risks contained therein cannot be ignored. Aware of the existence of such risks, the state tightened the approval of PSL (Pledged Supplementary Lending) in 2018. The Monetized Resettlement of Shelter Reform may become the past.
Real estate purchase restriction policy
Historically, real estate purchase restrictions have almost coincided with Residential Market of Housing. Since the commercialization of housing in 1987, the real estate industry experienced the initial barbaric growth and ushered in the first government regulation. In 1993, the Hainan property bubble burst. At the same time, it opened the chapter of the young Chinese real estate market purchase restriction policy.
Policies such as the “National Ten Articles” in 2010, the “National Eight Articles” in 2011, the “New Five Articles in 2013” and the 2015 hotspot cities. As an administrative means, the purchase restriction policy mainly aims to directly curb the demand for real estate investment or speculation, and make the real estate industry develop towards the goal of meeting the basic housing needs of residents. At the same time, the purchase restriction policy is an important way to control
Figure 18. Privative home index (YoY%)
Source: Bloomberg -10 0 10 20 30 20112012201320142015201620172018
70-City Private Home Index (YoY%) Tier 1 Cities
Tier 2 Cities Tier 3 or Below Cities
Figure 20. Monetized resettlement of shelter reform process
Source: The author
Figure 19. Construction cost
Source: Bloomberg -6 -4 -2 0 2 4 6 8 10 12 2014 2015 2016 2017 2018
CPI Fixed Asset Inv. Construction/Installation (YoY%) CPI Fixed Asset Inv. Construction Labour Expense (YoY%)
Figure 17. Primary Transaction volume
Source: Bloomberg 0 200 400 600 800 1000 1200 1400 1600 2011 2012 2013 2014 20152016 2017 2018 Total Sales Volume (Mln sqm, YTD) Pre-Sold Volume (Mln sqm, YTD) Ready-for-Sale Volume (Mln sqm, YTD)
inflation and reduce the real estate bubble. However, each regulation is subject to the situation, and when the house price goes down, the restriction will be cancelled directly or indirectly. Such policies have not solved the fundamental problems in the real estate market. It is necessary to further reform the implementation of the purchase restriction policy in the future.
Urban talent introduction policy
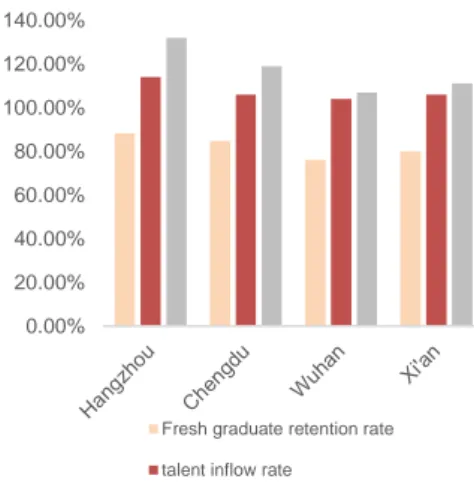
In 2018, more than 100 cities of different levels across the country issued talent policies. In particular, second-tier cities have become the talent introduction cities with highest intension (Figure 21). In 2019, there were 16 cities that issued various policies for talent introduction and settlement. Lin Bao, a researcher at the Institute of Population and Labor Economics of the Chinese Academy of Social Sciences, believes that the "capture of talents" is closely related to changes in the demographic situation. Lin Bao pointed out that after China's 15-59-year-old working-age population began to decline in 2012, the demographic dividend began to decline. From 2017 to 2018, it may be the turning point for the economically active population to begin to decline. The occurrence of this "talent battle" indicates that the impact of demographic changes has begun to be transmitted to second-tier cities, new first-tier cities and even first-tier cities. This has further spurred the red warning of the long-term forecast of the real estate market in the third- and third-tier cities.
Prediction: Steady Growth, Alert to Gray Rhinoceros
After experiencing a rapid increase in real estate prices and a bubble, domestic households, enterprises, and government debt ratios have risen. At the same time, since the United States launched the Sino-US trade war, the trade has been limited, and the dollar's foreign exchange reserves have been seriously challenged. Systemic financial risks now cannot be ignored. Since then, domestic policies have begun the reducing of excess inventory, supply-side structural reform, regulation of the real estate market, stabilization of finance, and boosting the real economy. Coordinated with GDP growth for long-term regulation, and slowly squeeze out the real estate bubble in a mitigating manner. At present, the real estate inventory-reducing process is nearing completion. Accompanied with the talent policy, population orientation and the expected loose monetary policy (Figure 22, 23),
first- and second- tier cities are expected to develop steadily, but in the short
term, there is almost no possibility of skyrocketing.
Moreover, we must be alert to the emergence of gray rhinoceros.
Since 2011, the real estate tax legislation has been repeatedly mentioned in the official statement. In the 2018 government work report, it was proposed to "stably promote real estate tax legislation." Observing from various sources, it is an indisputable fact that real estate tax is about to be launched soon.
The high social leverage is the second gray rhinoceros. In 2018, the leverage
ratio of the resident sector was 53.2%, the leverage ratio of the corporate sector was 153.6%, and the leverage ratio of the government sector was 37%. Although the momentum of de-leveraging of non-financial companies has increased since 2017, the total debt of industrial enterprises dominated by private enterprises has only increased by 2.9% in 2018, but the total liabilities of state-owned enterprises have increased by 16.0%. The proportion of state-owned enterprise debt to the entire non-financial corporate sector debt is rising. Government corporate leverage seems to be low, but if local implicit debt is taken into account, government sector leverage will exceed 90%, which deserves high alert.
Competitive Positioning
Figure 21. Talent inflow of four new tier 1 cities, first quarter of 2018
Source: Boss Direct
0.00% 20.00% 40.00% 60.00% 80.00% 100.00% 120.00% 140.00%
Fresh graduate retention rate
talent inflow rate
Highly educated talent inflow rate
Figure 22. Reverse repo add-in of central bank (Bn RMB)
Source: China Central Bank
0 100 200 300 400 500 600
Figure 23. Reserve requirement ratio
Source: China Central Bank
10.00% 12.00% 14.00% 16.00% 18.00% 20.00% 22.00% 24.00% 1 1 /2 9 /2 0 1 0 1 1 /2 9 /2 0 1 1 1 1 /2 9 /2 0 1 2 1 1 /2 9 /2 0 1 3 1 1 /2 9 /2 0 1 4 1 1 /2 9 /2 0 1 5 1 1 /2 9 /2 0 1 6 1 1 /2 9 /2 0 1 7 1 1 /2 9 /2 0 1 8
Large financial institution
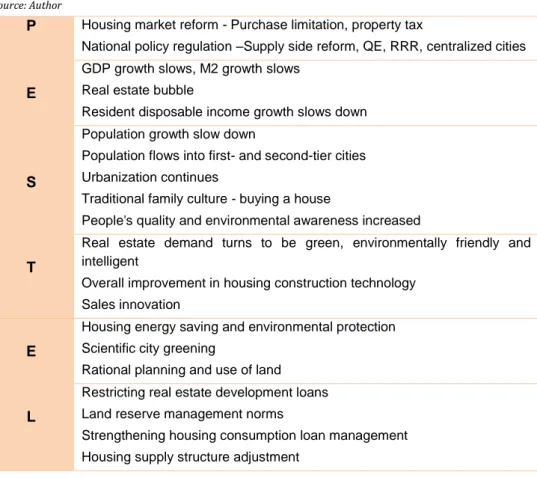
To evaluate Vanke’s s competitive position in the real estate market, a Porter’s Five Forces Analysis (Figure 24), a SWOT Analysis (Table 8) and a PESTLE Analysis (Table 9) were performed.
Porter’s Five Forces Analysis Threats of substitutes (low)
The product of real estate market is commercial residential building, the substitutes can be defined as policy-based low-rent housing, public rental housing, economically affordable housing, unit welfare housing and limited property housing, etc... As we can see, those housing mentioned above, basically do not form a significant dimension. As for limited property housing, its characteristic of high risk takes it out of treat consideration. So, the treat of substitutes is negligible.
Bargaining power of suppliers (middle high)
The real estate supply side mainly includes the government, raw material suppliers, designers, construction parties and property management service providers. In particular, the government as a supplier of land, the bargaining power of enterprises in the land market is very weak. However, in China's real estate market, raw material suppliers, designers, construction parties and property management service providers have weak bargaining power. In particular, Vanke is a leading domestic real estate company with higher bargaining power for suppliers.
Bargaining power of buyers (low)
In the real estate market of China, it is largely admitted that the demand was much higher than the supply, especially in the tier 1 and tier 2 cities market. The big gap between the rich and poor determined that the objective clients of real estate developers are those relatively wealthy people. In the wide Chinese territory, there are still so many people live a life under the low-income level. Combing those two factors above, the bargaining power of buyers are very small.
Threats of new entrants (low)
As we can see, the barrier to entry and quit the real estate market are very high. And in recent years, the control policy imposed by the government to the real estate market became more and more intensive. Accompanying with money squeeze and inventory-reducing tendency, the threats of new entrants are low
Rivalry (middle)
China's real estate industry is dominated by ten giants in the real estate market. If companies can combine cost leadership and differentiation, they will have a competitive advantage over companies that rely solely on a dominant strategy. Although the growth rate of the real estate industry started to slow down, the high fixed costs, strong regional and low industry concentration still make the competitiveness between existing competitors not so strong.
Strengths Weaknesses
Branded advantages
Market leader in real estate industry Innovated organizational structure Strong R&D capability
Advanced management model Good quality benefit growth
Land reserve below industry level Lack of government relationship Lack of attention to employees High asset-liability ratio
Opportunities Threats
Sufficient operating cash flow to expand market share
Large population move-in, large demand
The reforms on economic structure and restrictions on real estate industry by government
Figure 24. Porter’s Five Forces Analysis
Source: The author
Table 8. SWOT analysis
Urbanization continues
Country supports green real estate
High land cost Reduced profits
Expansion of other real estate giants
P Housing market reform - Purchase limitation, property tax
National policy regulation –Supply side reform, QE, RRR, centralized cities
E
GDP growth slows, M2 growth slows Real estate bubble
Resident disposable income growth slows down
S
Population growth slow down
Population flows into first- and second-tier cities Urbanization continues
Traditional family culture - buying a house
People's quality and environmental awareness increased
T
Real estate demand turns to be green, environmentally friendly and intelligent
Overall improvement in housing construction technology Sales innovation
E
Housing energy saving and environmental protection Scientific city greening
Rational planning and use of land
L
Restricting real estate development loans Land reserve management norms
Strengthening housing consumption loan management Housing supply structure adjustment
The recommendation for Vanke of this report is BUY, with a 2020YE target price of RMB 43.97 representing a 48.54% upside potential to the company’s stock price of RMB29.60 on April 24th, 2019, with medium risk.
Vanke's main business, the real estate industry, has occupied the largest part of Vanke's revenue. Although the company has a long-term transformation plan, it can be predicted that real estate will remain the core business within five years. Due to the real estate bubble and its huge impact, Chinese government seeks a soft landing in real estate market. It is predicted in the report that in 2023F, Vanke's real estate revenue growth rate be same as the 2023F GDP growth rate. As China is currently in the middle and late stages of urbanization, real estate demand is still not low in the short term, but in the long run, it will inevitably usher in a stage of sudden decline in demand. It is expected that this stage will appear around 2030, so the choice of terminal growth rate will inevitably be in a lower interval.
The exposure on rental housing and other new business markets will help Vanke go through the difficult long-term transformation. In the next two decades, the transformation of real estate enterprises has become an industry-recognized direction. With the role of real estate developers and excellent property managers, Vanke will have a great advantage in entering the group rental industry. The market share of Vanke in rental housing market is forcasted to grow by 5% in 2019F–2023F (Figure 25).
5.
Investment Summary
Table 9. PESTLE analysis
Source: Author
Table 10. Target price by method
Source: Author
Valuation Target Price
DCF ¥43.97 Multiples ¥45.70 Table 11. DCF Valuation Source: Author Price Target MN RMB¥ # Shares Outstanding/m 11302.00 Net debt MV 96,102 Equity Value 707,765 Target Price ¥43.97 Price on 2019-4-24 ¥29.60 Upside Potential 48.54%
Inventory turnover is a very important indicator in Chinese real estate companies. Due to various restrictions on the real estate, the real estate industry's inventory turnover rate has dropped significantly in recent years. Combined with the forecast of real estate revenue, the probability of a significant rebound in inventory turnover in the future is very low. It is expected that Vanke’s inventory turnover will maintain steady in the next five years.
Since Vanke almost finished its three major big plans for bonds financing, combined with the current economic situation, it is expected that the probability of adding large financing plans in the future will be relatively low, which will affect Vanke's cash holdings. Vanke will still issue long-term and short-term debt, but with smaller dimension, and it is predicted that the new debts issued, except for those residual unreleased bonds in old plans, to be all in RMB.
Valuation Method
The final target price of this report chooses the results of the DCF, in which uses the method of discounting cash flow. And starting from the final target D/V ratio, use the market values moving backwards method to find the annual predicted WACC value. Finally, we find the target price of RMB 43.97. The Multiple is also used as an auxiliary valuation method, in which arrives at the target price of RMB 45.70.
Investment Risk
The real estate industry is an industry highly influenced by macro indicators. Downside GDP growth and population growth will bring huge challenges to real estate revenue growth. The exchange rate risk brought about by the Sino-US trade conflict will affect Vanke’s leverage system with US dollar bond liabilities. At the same time, the high social debt ratio and the existence of the real estate bubble are also very sharp risks. Land policy affects house prices from the supply side, and real estate taxation, environmental policies, real estate financing supervision and restrictions on purchases directly affect the development of the real estate industry. Finally, Vanke's own shareholding issue and lower land stocks compared to the peer companies are not negligible.
Since the long-term development of China's real estate industry is a core factor, the main valuation method of the report is the DCF method. The purpose is to implement as many assumptions that corresponds the current situation as possible, in the short-term and long-term, in order to bring the final valuation to a reasonable range. In addition to the DCF method, we use the Multiples method as supplement and reference.
Total Revenue
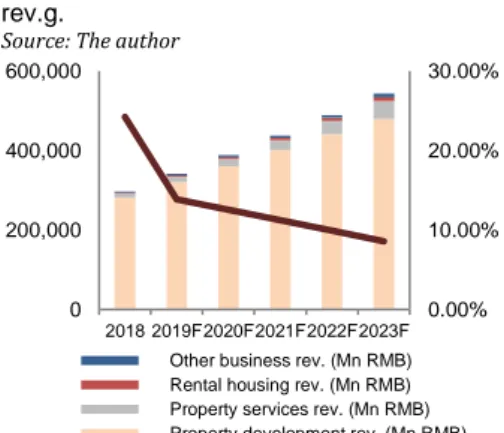
The revenue of Vanke was divided in four parts: Property development revenue, Property service revenue, Rental housing revenue and other business revenue. In fact, only the property development revenue stands for a significant volume (Figure 26). However, since the company has a long run transformation plan and the property service and rental housing service sectors are indeed two factors full of potential, here we also take them into consideration.
Property development revenue
In the past ten years, due to the frenzied growth of the real estate market, which has affected the development of the other industries, the government's restrictions
6.
Valuation
Figure 25. Vanke rental housing market shares
Source: The author
0 20,000 40,000 60,000 80,000 100,000 120,000
Vanke rental housing rev.(Mn RMB) China rental income (Mn RMB)
Figure 26. Vanke rev. segments and PD rev.g.
Source: The author
0.00% 10.00% 20.00% 30.00% 0 200,000 400,000 600,000 2018 2019F2020F2021F2022F2023F Other business rev. (Mn RMB) Rental housing rev. (Mn RMB) Property services rev. (Mn RMB) Property development rev. (Mn RMB) Property development rev. growth
on real estate have been strengthened year by year. Since 2017, the popularity of the real estate speculation has been sharply reduced. Combined with the long-term growth of population decline, macroeconomic factors such as economic downturn, it can be predicted that the overall real estate industry growth rate in the future will experience a substantial decline and stabilize for many years. The real estate industry has been positioned as a pillar industry in the country before, and the existence of the real estate bubble and its huge impact are indisputable facts. Now the direction of domestic real estate orientation is to seek a soft landing, that is, through the annual GDP growth, combined with the steady low-speed development of the real estate industry, the bubble will be squeezed out. This is a long-term strategy. Therefore, this report predicts that in 2023F, Vanke's real estate revenue growth rate will be parallel to the forecast GDP growth rate in the same year (Figure 26).
For the prediction of PD rev. growth rate in 2019F, we applied a booked area/area completed ratio that corresponds to the historical tendency, which is 73.14% for 2019F. Using the area completed predicted data from 2018 annual report, we can easily get the 2019F booked area. Since in the future five years, the ASP will keep steady, we simply applied the ASP for Housing Market in 2018 as that of 2019F. Finally, we reach the PD rev. of 338274 Mn RMB in 2019F, which stands for a growth rate of 13.86%. See more details in Appendix 9.
Rental housing revenue/sales
Vanke entered the rental market in 2017. From the latest two bonds issued by the rental market, it can be deducted that the entire company attaches great importance to it. Since the rental housing market is greatly affected by macro factors, this report predicts Vanke's rental housing revenue using the market share method:
𝑉𝑎𝑛𝑘𝑒 𝑅𝐻𝑀 𝑟𝑒𝑣𝑒𝑛𝑢𝑒 𝐹 = 𝑉𝑎𝑛𝑘𝑒 𝑅𝐻𝑀 𝑠ℎ𝑎𝑟𝑒 𝐹 ∗ 𝐶ℎ𝑖𝑛𝑎 𝑅𝐻𝑀 𝑟𝑒𝑣𝑒𝑛𝑢𝑒 𝐹
For Vanke RHM share F, it is simply assumed that the relevant growth rate keeps a fixed pace of 5%.
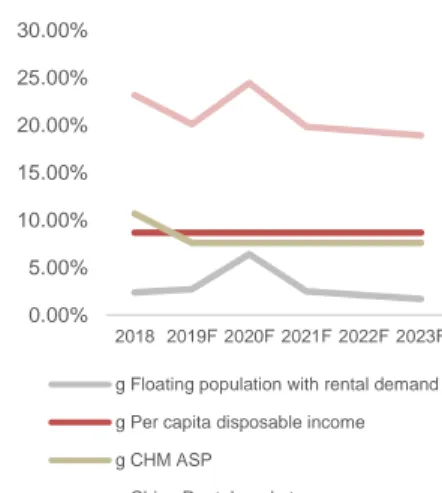
Also, three indicators of Floating population with rental demand growth, Per capita disposable income growth and Commodity housing market ASP growth are introduced as the base of China rental housing market growth F (Figure 27).
𝑑 𝐶ℎ𝑖𝑛𝑎 𝑅𝐻𝑀 𝑟𝑒𝑣𝑒𝑛𝑢𝑒
= (1 + 𝑑 𝐹𝑙𝑜𝑎𝑡𝑖𝑛𝑔 𝑝𝑜𝑝𝑢𝑙𝑎𝑡𝑖𝑜𝑛 𝑤𝑖𝑡ℎ 𝑟𝑒𝑛𝑡𝑎𝑙 𝑑𝑒𝑚𝑎𝑛𝑑)
∗ (1 + 𝑑 𝑃𝑒𝑟 𝑐𝑎𝑝𝑖𝑡𝑎 𝑑𝑖𝑠𝑝𝑜𝑠𝑎𝑏𝑙𝑒 𝑖𝑛𝑐𝑜𝑚𝑒) ∗ (1 + 𝑑 𝐶𝐻𝑀 𝐴𝑆𝑃) − 1 For detailed forecast of the three indicators please check Appendix 9.
Property service and other business revenue/sales
Since the two sectors of Property service and other business are in a steady growth process all the year round, it is simply assumed that these two parts will maintain future growth at the rate of the previous year, 36.06% and 25.88%, respectively.
Property Development Sales
A very hallmark feature of China's real estate industry is that the relationship between sales and revenue is not as close as that of other industries. This is because the Chinese real estate industry has a long sales cycle and special revenue recognition standards. Since most real estate companies operate in a pre-sale manner, most of the pre-sales will be delayed for a certain number of years to confirm revenue. However, since sales are directly related to the operation of real estate companies, their correlation is high. Therefore, sales are also forecasted in this report to make reference to some operational indicators (Figure 28). For more information check Appendix 9.
Figure 27. Rental market indicators growth
Source: The author
0.00% 5.00% 10.00% 15.00% 20.00% 25.00% 30.00% 2018 2019F 2020F 2021F 2022F 2023F
g Floating population with rental demand g Per capita disposable income g CHM ASP
g China Rental market
Figure 28. Vanke’s sales indicators growth
Source: The author
-2.00% 0.00% 2.00% 4.00% 6.00% 8.00% 10.00% 12.00% 14.00% 2019F 2020F 2021F 2022F 2023F
g CHM sales area g CHM ASP g Vanke sales
Figure 29. Commodity housing market
Resource: Author 0 5,000,000 10,000,000 15,000,000 20,000,000 25,000,000 0 200 400 600 800 1,000 1,200 1,400 1,600 1,800 2,000 CHM sales area (Mn sq.m.) CHM sales value (Mn RMB)
Since most of the real estate companies that operate in first- and second-tier cities in China basically do not have so much difference in their operating methods, the forecast for sales is also based on market forecast and market share forecasts (Figure 29):
𝑉𝑎𝑛𝑘𝑒′𝑠 𝑃𝐷 𝑠𝑎𝑙𝑒𝑠 𝐹 = 𝑉𝑎𝑛𝑘𝑒 PD 𝑚𝑎𝑟𝑘𝑒𝑡 𝑠ℎ𝑎𝑟𝑒 𝐹 ∗ 𝐶ℎ𝑖𝑛𝑎 𝐶𝐻𝑀 𝑠𝑎𝑙𝑒𝑠 𝐹
𝐶ℎ𝑖𝑛𝑎 𝐶𝐻𝑀 𝑠𝑎𝑙𝑒𝑠 𝐹 = 𝐶𝐻𝑀 𝑠𝑎𝑙𝑒𝑠 𝑎𝑟𝑒𝑎 𝐹 ∗ 𝐶𝐻𝑀 𝐴𝑆𝑃 𝐹
For the data of market ASP 2019F, the corresponding report of the Chinese Academy of Sciences Forecast Center is referenced, in which launches the prediction of 7.6% increase in commodity housing market ASP in 2019F. Due to the long-term stationary of CHM, it is also assumed that from 2019 to 2023, the annual growth rate of CHM ASP will stay 7.6% YoY. For the forecast of market
sales area, we refer to the Chinese Academy of Sciences Forecast Center’s report,
and the growth rate of -0.84% CAGR is applied. Vanke’s commodity housing market shares forecast assumes that the market share growth rate for the next five years is equal to the average of the market share growth rate of the previous four years of 4.08%.
Cost
As we know, the cost of real estate company include: acquisition cost of land, aggregate cost of development, materials and supplies, wages and other direct expenses and an appropriate proportion of overheads and borrowing costs capitalized, etc., in which the cost of land and cost related to construction are two of the costs that occupy large proportions. From the figure 30, we can conclude that recently, Vanke has implemented a strict control on land acquisition cost, which can just cancel the impact of construction cost increasing. So, for cost forecasting, we simply assume that all the costs grow in line with revenue or sales, by the stable historical ratio. More in detail, cost of revenue is assumed to be related to the growth of revenue due to time lag between PD revenue and sales. However, other expenses like Selling and marketing expenses, General and administrative expenses and other operational expenses were assumed to be in line with total sales since those costs usually are confirmed in the same years that they occurred.
CAPEX
Due to the existence of disposal, inventory transformation in real estate industry. it is not advisable to simply use d PP&E + Dep. as the substitution of CAPEX. So, in the report we simply assume that CAPEX changes along with revenue by a fix ratio of 1.98%. Also, the annual depreciation is considered equivalent to the maintenance CAPEX, the corresponding value of the growth CAPEX then can be derived (Figure 31). Finally, in the terminal column, we assume that terminal CAPEX and terminal depreciation normalized each other mutually.
D&A
Depreciation's predictions are based on addition, while amortization is based on predictions of Intangible asset addition and the other long-term assets addition. The annual depreciation is a fixed percentage of addition for this year. The same is true for amortization. See the Appendix 8 for more detailed assumptions.
Debt strategy
The report details Vanke's long-term and short-term debts. In conjunction with its financing plan, we do a debt projection in the next five years. So far, Vanke has launched a total of three bond financing plans, including a dollar plan and two RMB plans. HK MTN Programme is a US dollar bond program inherited from Bestgain Real Estate Lyra Limited (one of Vanke's subsidiaries in HK). It has been incremented from the initial USD 3.2B to the current USD 7B. The other two RMB
Figure 31. Vanke’s CAPEX
Source: The author
0.00 2000.00 4000.00 6000.00 8000.00 10000.00 12000.00 2018 2019F 2020F 2021F 2022F 2023F Maintenance CAPEX (Mn RMB) Growth CAPEX (Mn RMB)
Figure 32. Vanke debt evolution
Source: The author
0 50000 100000 150000 200000 250000 300000 350000 Long-term debt (Mn RMB) Short-term debt (Mn RMB) Total net debt (Mn RMB)
Figure 30. Vanke land acquisition volume and price
Source: Annual reports
40 42 44 46 48 50 2017 2018 0 1000 2000 3000 4000 5000 6000 7000 8000 9000
Annual land acquisition GFA L (Mn sq.m.)
Annual land accquisition unit price R (RMB/sq.m.)
plans are domestically issued RMB Corporate Bonds. Among them, the newest two tranches are 2019 corporate bonds specialized in rental housing issued to qualified investors in public under the RMB Corporate Bonds. Therefore, in terms of debt, the overall forecast is that Vanke will not carry out huge financing plans, but financing will still proceed. It is expected that the future debt will develop according to a certain proportion of the revenue (Figure 32). Among them, according to historical data, for long-term borrowing the proportion is 40.71% of the same year and for long-term bonds 15.85%. For short-term borrowing the proportion is 23.27% of the same year, and for short-term bonds is 8.09%. In addition to the remaining bonds in the three big plans, we predict that the future new debt will be all RMB debt. In terms of interest rates, refer to the various Vanke debt interest rates coming this year, assuming a long-term borrowing interest rate of 5%, a short-term borrowing rate of 3%, and a long-term bond rate of 3.5%, short-term bond rate of 2.5% in the next five years.
WACC assumption
In the DCF method, we used the way of discounting FCFF by WACC. The WACC in the report was obtained using the moving backwards method, which implicates reaching the WACC of different periods by the assumed terminal WACC. Since WACC is closely related to the company's D/V ratio, we can deduce that the actual WACC changes every year (Table 12). By assuming a target number of 0.15 to Vanke's terminal D/V ratio, we reach a terminal β of 1.13 and a terminal WACC of 11.05%. In this way, the terminal FCFF can be discounted to 2023F, and added to the 2023F FCFF to obtain the EV of 2023F. Then deducted the 2023F debt market value to get the corresponded Equity market value. So, the D/V and E/V ratios of 2023F are easy to calculate, the 2023F WACC is obtained under all the assumptions of cost of equity, cost of debt and tax rate (Figure 33). The steps above are repeated until discounted to the target year. Each year’s debt market values were calculated from debt structure projection (See Appendix 10 for the detailed process).
Cost of equity was calculated using a multi-factor model with market risk premium, risk free rate and β of the company. By removing the influence of leverage in β in current year, we get the unlevered β. After applying the leverage ratio of each year to unlevered β, we get each year’s β. To estimate the cost of debt, we use the weighted average interest rate on all the debt for each year according to the debt projection structure.
Tax Rate – Land Appreciation Tax
The LAT is another Chinese Characteristic in real estate market. It is another principal tax imposed besides income tax for the property developers. Basically, the purpose of LAT is to restrict the abnormal development of real estate market, and the relevant tax base of LAT is very similar to the operational income. That is why in Vanke’s annual reports the LAT was included in the income tax item in the income statements, which is also the fundamental reason why the marginal tax rate applied in our report is that high. Land appreciation tax is levied from 30% to 60% on gain on disposal of landed properties with reference to the percentage of appreciated value over the deductible amount.
The effective tax rate is deduced directly by Tax/EBT.
Terminal g assumption
Based on the prediction of China's urbanization rate, we can conclude that in 2030, China's urbanization rate reached 70% (see Appendix 17 for the detailed forecasting process). Referring to the urbanization process of other countries, after the urbanization rate exceeds 70%, the real estate industry will be affected and
Table 12. WACC assumptions
Source: Author WACC 2020F Terminal Cost of equity 12.56% 12.45% Rf 3.34% 3.34% MRP 8.19% 8.19% Unlevered β 0.81 0.81 β 1.05 1.11 Cost of debt 4.06% 4.17% Marginal tax rate 43.41% 43.41%
D/V 0.33 0.40
E/V 0.67 0.60
Figure 34. China urbanization rate
Source: LI Shantong, GAO Chunliang
52.00% 54.00% 56.00% 58.00% 60.00% 62.00% 64.00% 66.00% 68.00% 70.00% 72.00% 2 0 1 7 2 0 1 8 2 0 1 9 2 0 2 0 2 0 2 1 2 0 2 2 2 0 2 3 2 0 2 4 2 0 2 5 2 0 2 6 2 0 2 7 2 0 2 8 2 0 2 9 2 0 3 0
China urbanization rate
Figure 33. Vanke’s WACC
Source: The author
0.00% 2.00% 4.00% 6.00% 8.00% 10.00% 12.00% 14.00% 2019F 2020F 2021F 2022F 2023F TV Ke Kd WACC