A Work Project, presented as part of the requirements for the Award of a Master’s Degree in Finance from the NOVA – School of Business and Economics.
BUYBACKS: SHORT-TERM EFFECT AND FUTURE IMPLICATIONS FOR THE UNITED STATES STOCK MARKET
ANTÓNIO MARIA MIRANDA SEQUEIRA ALGARVIO DE CASTRO – 31732 A project carried out as part on the Master of Finance Program, under the supervision of:
Martijn Boons 04-12-2018
1
TABLE OF CONTENTS
ABSTRACT ... 2
Purpose of the project ... 2
Introduction and current state ... 2
Literature Review and Hypothesis Literature Review ... 5
Hypothesis Development ... 10
Empirical Studies ... 10
Data and Methodology ... 11
Abnormal Returns ... 12
Real EPS vs. No Repurchase EPS ... 13
Probability of default and Capital Deterioration ... 13
Empirical Results and Discussion Abnormal Returns ... 14
Real EPS vs. No Repurchase EPS ... 17
Probability of default and Capital Deterioration ... 18
Corporate Conditions and General Electric Case ... 22
Conclusion ... 25
2
ABSTRACT
The main purpose of this work was to analyze the impact of stock buybacks on the American stock market. Firstly, the abnormal returns on the days following a repurchase transaction were calculated, and evidence was found that there are positive cumulative average abnormal returns on the days following it. Additionally, the Earnings-per-Share’s impact was analyzed indicating that there is some inflation of this metric due to buybacks. Finally, the evolution of the firms’ financial strength was analyzed, allowing to conclude that this buyback trend is harming the companies’ balance sheets and might endanger them in the future.
Keywords: Share Buybacks, Credit Ratings, Earnings-per-Share.
1. Purpose of the project
The main objective of this Directed Research Internship with BIG – Banco de Investimento Global is to dissect the Standard & Poor’s 500 Index companies and to find out what impact did the buybacks trend had in the past years, and how can it impact the market in the future.
2. Introduction and Current State
A share buyback is essentially a program on which the company agrees to buy back some of its shares from the market, thus rewarding investors in a different way than the traditional dividends. Share Buybacks are a more flexible and way of compensating investors than dividends, due to the fact that investors usually believe that when a firm announces that it will pay dividends, these would continue in the future, which is not the case when we consider stock buybacks. Additionally, buybacks are more tax efficient than dividends. So, instead of distributing cash through a dividend payment, the company repurchases its own stocks from the market, decreasing the number of shares outstanding, and so, benefiting its current shareholders with a higher share of the company. Share buybacks have been rising since the
3
1980s, when companies in the United States of America decided to adopt this strategy in a much more meaningful way, surpassing dividend payments for the first time (in US $) in 1998. Since then, these have been following economic cycles, setting the record in 2007 when it reached about $589 billion, following with a steep decline during the years of 2008 and 2009 due to the global financial crisis. Share repurchases are much more volatile than dividend payments as a way of remunerating shareholders, due mostly to the increased stickiness of dividends. This buyback activity has been booming in 2018 due to the corporate tax reform – US Tax Cuts and Jobs Act - released in December 2017 by the President of the U.S.A, Mr. Donald J. Trump, that approved a decline in the corporate tax rate from 35% to 21%, which boosted US companies’ profits and also their cash holdings. Apart from this, this tax reform also allowed American companies to repatriate overseas profits back to the USA at a one-time tax rate of 15.5%, in order to remove the incentive of keeping cash overseas to avoid double taxation. This led to a massive inflow of cash into the American companies, which a recent study by the Federal Reserve estimated to have been nearly $300 Billion of the $1 Trillion held in foreign countries. Another reason that has helped the increase of corporate buybacks has been the historically low interest rates set by the Federal Reserve, due to the monetary easing process that had been followed since the crisis. This allowed companies to borrow at low rates, permitting an easier and more unrestricted access to funds, therefore facilitating the conduction of leveraged repurchase programs by companies. These three incentives have been the main drivers of the increase in activity.
According to data provided by Standard & Poor’s, up until the end of the second quarter of 2018, companies included in the S&P 500 Index had already spent about $379 billion in share buybacks, which in annualized terms ($759 billion dollars) means that the previously set record in 2007 is on its way of being offset by this year’s activity.
4
Buybacks have been under the radar, not only due to exponentially increasing volumes, but also, due to some market sentiment that these may have been used as earnings manipulation and as a way of managers cashing out their stock options. On the 11th of June of 2018, Commissioner Robert J. Jackson Jr., a SEC Commissioner, gave a speech at the Center of American Progress, sharing some thoughts on his team’s research on stock buybacks and asking for a reexamination of buyback rules, which haven’t been updated since 2003. His team, after proper study, found evidence that on half of the companies studied, “…at least one executive sold shares in the month following the buyback announcement.”, and also that “…during the eight days following a buyback announcement, executives on average sell more than $500,000 worth of stock each day…”, way larger when compared to the $100,000 worth on the days before the buyback. This allowed the Commissioner and his team to conclude that, the effort that has been made over the years to tie long-term firm performance with executive compensation has been ineffective, since managers are now more focused on short term gains than in maximizing firm and shareholder value. This conclusion and the possible changes in the rules that may occur in the next years may alter how buybacks have been used in the past years as an earnings management tool.
With that being said, it is important to analyze the market reaction to buybacks, what is the impact on the firm’s Earnings per Share, and finally, how balance sheets have been evolving
Figure 1: Total buybacks for the S&P 500 companies, in $ billions. Source: Yardeni Research Report, Stock Market Indicators: S&P 500 Buybacks & Dividends
5
over the past years during this trend. Furthermore, it’s important to analyze if the large increase in debt, and decrease in capital (that works as a buffer during downturns), may lead to negative impacts if a major downturn happens in the next year.
3. Literature Review and Hypothesis 3.1. Literature Review
a) Why are firms conducting buybacks?
As mentioned, share repurchases have been increasing exponentially over the past years. However, the reasons why firms are pursuing them are thought to be different than when it was first established in the classic theories behind it. The first idea behind share repurchases was that companies would do it in order to signal the market that its stock was undervalued compared to the current market price, which has been known as the Signaling Theory. This idea was first introduced in the Modigliani and Miller Theorem (1961) that states that when markets are inefficient, companies may signal new information to the market through changes in their payout policy. Later, it was reinforced in the papers written by Vermaelen (1984), Bhattacharya (1979), Miller and Rock (1985) that mention the positive indication that managers give to the market about future earnings and cash flows when conducting repurchase of common stock, supported by actual abnormal increases in the firms’ Earnings per Share (EPS).
Another reason used to explain the use of share repurchases is the mitigation of agency costs, meaning the company attempt of reducing the possibility of the manager acting in his own interest at the expense of shareholders, a problem firstly introduced by Jensen & Meckling (1976). Companies with large free cash flows may diminish this problem by conducting buybacks. This issue could lead managers to invest it in low return projects or to waste cash, and so, by repurchasing stocks using excess cash (Jensen, 1986), the company is able to
6
mitigate that. This way the company is able to get the money back to shareholders and prevent the misuse of resources.
Further studies have identified additional reasons on why companies would conduct share repurchase programs, and additionally which factors are more important when they do so. Bens, Nagar, Skinner and Wong (2003), studied if stock repurchase decisions are in any way affected by the desire of executives to offset the dilutive effect of employee stock options on the company’s EPS. Additionally, due to the fact that an earnings surprise has a large positive impact on a company’s stock returns, consistent with the previous studies conducted (Bartov, Givoly & Hayn, 1999) that state that firms that meet or beat analysts’ EPS expectations are in average rewarded with a return almost 3% higher than the companies that are not able to do so, it was important to study if repurchase are being used as an earnings manipulation device. So, the premise that executives are more expected to conduct share repurchases when earnings fall short of the prior growth rates was tested, and again, robust findings were made to sustain this statement (Bens, Nagar, Skinner and Wong., 2003).
Brav, Graham, Harvey and Michaely (2005) conducted two dozens of in-depth interviews and surveys on 384 CFOs, in order to understand the main reasons that affected their decisions on dividends and share repurchases. After being asked the importance of increasing EPS on their share repurchase decisions, 75% of them either answered important or very important. Additionally, half of the CFOs also stated that they would consider share repurchases in the future as a way of boosting their companies’ EPS.
Guthrie (2017) explored the negative sides of buyback programs, focusing on the usage of buybacks by executives holding stock options for wealth transfers between them and the company. Evidence was found that by conducting share buybacks, there is in fact a wealth transfer from shareholders to executives that hold stock options.
7
b) Ways of Repurchasing Stock
Open Market Repurchase
An open market repurchase is the most standard way of a company buying back its shares. It consists on an operation in the open market, usually through a broker over a period of time, and has been the largest method in use when firms conduct share repurchases. Firms may also have a share repurchase program, repurchasing shares at specified dates in time.
Tender Offer
A company may also repurchase stocks by presenting a tender offer, at a fixed price, to the company’s shareholders, usually offering a premium relative to the current market price. This premium will act as an incentive for shareholders to tender their shares, instead of holding on to them, even though they do not have the obligation, but the option to sell their shares to the company or not.
Dutch auction
A Dutch auction is somewhat similar to a tender offer; however, instead of offering a fixed price, it will set a range of prices, with the minimum being above the market price. The shareholders will then place bids on how many shares are they willing to sell to the company, and at what price. Then the firm will start accepting bids by the minimum level, climbing up the price until it reaches the amount of shares the firm intended to buy in the first place. When it reaches the desired number of shares, every shareholder that placed a bid equal or smaller than the accepted price, will be paid that same price.
8
Another method which has been increasing in usage when conducting share repurchase programs is called Accelerated Share Repurchase (ASR), which only received further attention due to the need of disclosure of derivative instruments since 2003. For the years between 2013 and 2015 it represented about 10% of all common share repurchases and is now the second most used method of share repurchase in absolute dollar amounts in the US (Teague and Dolly King, 2017). An ASR, allows a company to very rapidly decrease its share count, and works as a combination between a Treasury Stock Purchase and a Forward Contract between the company and an Investment Bank. In the inception of the contract the firm pays upfront for the value of the shares which are borrowed by the bank from its clients, and additionally enters in a forward sale agreement, agreeing to sell back the shares to the bank at the end of the contract. At the settlement date, the Investment Bank buys the shares back from the company with the company either paying or receiving the difference between the initial and the average price during the life of the contract.
c) Impact on EPS of individual stocks and Index-Wise
In order to understand the true impact of share repurchases on the S&P 500 Index’s EPS, it is first important to acknowledge this impact on individual stocks. Hribar, Jenkins and Johnson (2004), provide a good framework to this matter by explaining how repurchases affect both the numerator and the denominator in the EPS calculation. Considering the denominator effect, meaning the decrease in the shares outstanding, it would impact the EPS positively since for the same value of Earnings, the decrease in the outstanding shares would mean an increase in the EPS. In terms of the numerator effect, the amount of cash used to fund the repurchase will possibly have some effect on future earnings as well (by decreasing future net income by the forfeited return on the cash used, or interest paid on the cash used to fund the repurchase). Bens, Nagar, Skinner and Wong (2003) state that buybacks only increase EPS, when the return or interest paid on the cash used, is lower than the inverse of the firm’s
Price-9
to-Earnings Ratio (P/E Ratio), meaning the Earnings-Yield at the time the buyback occurs. With that being said, it is now possible to conclude that repurchases only have an accretive effect on the firm’s EPS if the forfeited return is smaller than its Earnings-Yield, but it also depends on the timing of the repurchase which is able to strengthen or weaken this effect (Hribar, Jenkins and Johnson, 2004).
Considering an index-wise approach, it is commonly claimed, that the EPS of the S&P 500 Index is enlarged due to this buyback activity, however this does not seem to be true, and is therefore important to demystify these claims. This happens due to the nature of the index, how it is constructed and how the accounting metrics at the end of each quarter are computed. Resorting to the Standard & Poor’s, “S&P 500: Buybacks and the impact of share count reduction” document, we learn that, before reporting any metrics at the end of each quarter, the index weights and divisor are adjusted according to each firm’s shares outstanding. That way it prevents any abnormal variations in the calculated metrics due to any corporate action such as share repurchases, stock splits or other that could affect its shares outstanding or market capitalization.
d) Abnormal Returns following Stock Repurchases Programs Announcements
Multiple research papers have studied the effect of the announcement of stock repurchase programs on US companies’ returns on the days before and after the event day, trying to find out the possible existence and significance of abnormal returns on those event windows. Ikenberry et. al (1995), using a sample of 1239 observations (from 1980-1990) and considering the 2 days prior and the 2 days after a repurchase, concluded that firms had significant average cumulative abnormal returns of about 3.5%. A further study by Grullon and Michaely (2002), which studied 4443 repurchase events during the 17 years between 1980 and 1997, and using an event window of the day before the event and the day after, also
10
reached a similar conclusion as Ikenberry, reaching also a significant average cumulative abnormal return of about 2.57%. The latest study, considering a more recent sample of 2395 transactions (from 2007-2011) of Lee, Park and Pearson (2015), an event window of 2 days prior to the event and two days after, reaching a significant average cumulative abnormal return of about 1.37%. Comparing this return with the one Ikenberry found out in 1995, there is a large discrepancy of about 2.2 p.p., which suggests that the market is currently responding in a different manner to share repurchase transactions than it did in the past, indicating a decrease in the market reaction to this kind of event.
3.2. Hypothesis Development
a) Abnormal Returns following Share Repurchase Transaction
The main idea of this study is to contribute, using a more recent sample, to this research topic, in order to analyze the possible existence of abnormal returns following open-market share repurchase, and if so, to what extent.
H1: There are no average abnormal returns on the day of the event.
H2: There are no average cumulative abnormal returns between the day before the event to a day after.
H3: There are no average cumulative abnormal returns between two days prior to the event to two days after.
3.3.Empirical Studies
a) Real EPS vs. No Repurchase EPS
The idea of market manipulation, by manipulating earnings with buybacks is currently one of the major concerns in the United States Stock Market, and considering the hypothesis that the firms’ Earnings per Share (EPS) are inflated due to the buyback trend of the past year, it is
11
relevant to assess the impact of this in past quarters by making a proxy of what would the EPS of each company be if it wouldn’t have performed share buybacks.
b) Firm’s Z-Score and Buybacks
Buybacks have been signaled as sources of capital deterioration and increase in debt, that way, it is relevant to assess the possibility that firms are endangering their balance sheets by conducting these buybacks. Having said that, the comparison of the evolution of buybacks and the average firms’ empirical credit ratings is relevant to assess possible future implications in the market.
4. Data and Methodology
The financial data used to analyze all the subjects in this study was retrieved from Wharton Research Data Services, more specifically from Compustat – Capital IQ’s database. Additionally, the repurchase events’ dates were retrieved from the Bloomberg Terminal.
In order to analyze the existence of cumulative abnormal returns on the day of the event, as well as on the days after, a sample consists of 3353 repurchase transactions from the current S&P 500’s companies, from 2004 until the third quarter of 2018.
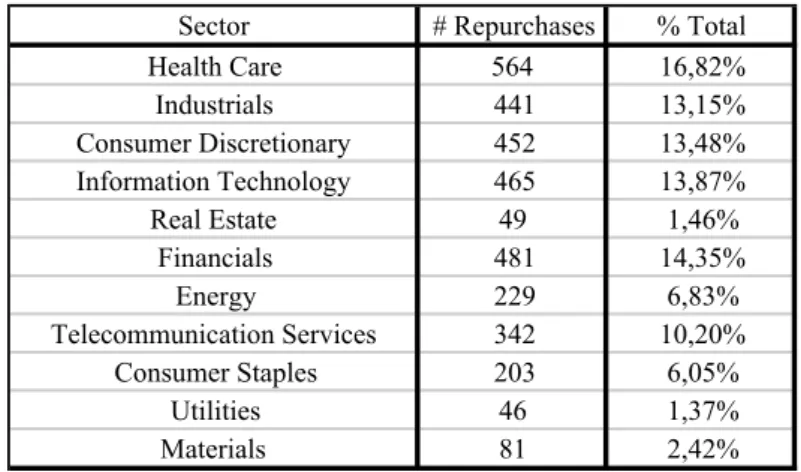
The distribution of these events per sector and per year is as follows:
Figure 2: Total number of repurchase events per year in the selected sample.
Figure 3: Total number of repurchase events divided by sector in the selected sample.
Sector # Repurchases % Total
Health Care 564 16,82% Industrials 441 13,15% Consumer Discretionary 452 13,48% Information Technology 465 13,87% Real Estate 49 1,46% Financials 481 14,35% Energy 229 6,83% Telecommunication Services 342 10,20% Consumer Staples 203 6,05% Utilities 46 1,37% Materials 81 2,42% Year # Repurchases 2004 162 2005 182 2006 205 2007 348 2008 164 2009 107 2010 228 2011 285 2012 159 2013 304 2014 281 2015 271 2016 203 2017 185 2018 166
12
4.1.Abnormal Returns
The methodology used for this analysis was a standard event study as performed by Fama, Fisher, Jensen and Roll (1969), and developed by MacKinlay (1997). Additionally, to test for the significance of both average abnormal and average cumulative abnormal returns the cross-sectional statistic test, the BMP t-statistic, proposed by Boehmer, Masucemi and Poulsen (1991) was used, due to its proven robust results in conventional event studies acknowledged in Harrington and Shrider (2007).
The first step was to calculate the standard daily returns for the 500 companies inserted in the sample, as well as the stock returns for the index. This was done for the time frame comprising the beginning of January of 2003 up until the 22nd of November of 2018. This way, the real returns were established, which can then be compared with the expected daily returns to calculate the abnormal ones.
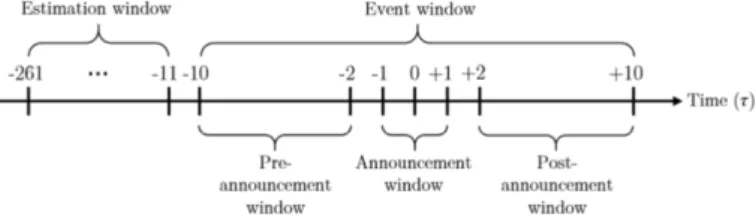
In order to get the parameters used to estimate the expected daily returns, the 250 days returns before the event window of each stock i were regressed using an OLS regression against the S&P 500 Index (Ticker: SPX). The event window to analyze the abnormal returns was established as the 21 days comprising the 10 days before the event, the event day and the 10 days after the event, like Bratli and Rehman (2015) did.
Proceeding with the analysis, and after getting the beta estimations for each stock i, before each event window, the expected daily returns were estimated using the market model:
Figure 4: Explanation of estimation and event window for the event study. Source: Bratli and Rehman (2015).
13
E (Ri,t) = 𝛼i + 𝛽i Rm,t (1)
Where the above-mentioned formula represents the expected daily return for stock i at time, and R(m,t) stands for the average market return during the estimation window. Considering all the aforementioned data, is now possible to compute the abnormal returns according to the Market Model, for each day during the event window, with the following formula:
AR i,t = Ri,t – (𝛼i + 𝛽i Rm,t) (2)
Which calculates the abnormal returns for each stock i at day t during the event window.
Finally, the Cumulative Average Abnormal Returns were calculated using the following formula:
𝐶𝐴𝐴𝑅 𝜏1, 𝜏2 =,+ -.𝐴𝑅
-+ ,
/ i,t (3)
where both 𝜏 mean the beginning and end of the desired window.
4.2.Real EPS vs. No Repurchase EPS
In order to evaluate the possible inflation of a firm’s Earnings per Share, a framework created by Oded and Michel (2008) was used. Oded and Michel (2008), returned the cash used in buybacks to the firm, which is then used to invest in T-Bills and generate additional returns. At the same time, the shares repurchased are re-added to the total shares outstanding (ignoring the timing effect, assuming that all the repurchases are made at the beginning of each quarter), to offset the inflating effect on EPS of decreasing the shares outstanding. That way, a new EPS value is calculated, that can be compared to the real one.
14
In order to analyze the probability of default of the 500 companies included in the S&P 500, the Standardized Altman Z-Score Model firstly introduced by Altman (1968) as the Altman Z-Score Model, and later developed and revised by Altman and Hotchkiss (2006), allowing to measure the probability of default for any company. The model intends to quantify the probability of default given the following set of financial ratios: Working Capital to Total Assets, Retained Earnings to Total Assets, EBIT to Total Assets and Equity to Debt. These ratios are then weighted by the parameters defined in the model (6.56, 3.26, 6.72 and 1.05 respectively), and then in the end, 3.25 is added to the result of weighting the financial ratios. The final number will allow a correspondence between the company’s Standardized Altman Z-Score and its Standard & Poor’s Credit Rating, which is a measure of its probability of default. An Standardized Altman Z-Score smaller than 5.65 indicates that a company has the empirical financial strength of a speculative company and should be rated BB+ or lower. On the opposite side, if larger than 5.65, the company is considered to be investment grade and should be rated between BBB- and AAA. After getting the Standardized Altman Z-Score for each company in each quarter, a simple average was computed in each quarter, and a time series generated representing the 500 companies in the index.
Finally, this time series and the total buybacks per quarter are graphed in order to assess the relation over the past years.
5. Empirical Results and Discussion
5.1. Abnormal Returns
Having calculated the abnormal returns for the 10 days prior to the transaction, the event day and the 10 days after the transaction, it was then possible to compute the cumulative ones and to establish a pattern for them. The following graph allows for the acknowledgment of the average cumulative abnormal returns, as well as for the 95% confidence interval thresholds:
15
As mentioned in the methodology section, the abnormal returns and the average cumulative abnormal returns were tested using a BMP t-test, a cross-sectional test, returning the following results:
Considering these results it is possible to verify if the formulated hypotheses are set to be rejected or not. Considering a 1% significance level, there are in fact abnormal returns on the day of the event, yielding a significant abnormal return of 0.25% and indicating that there is actually a positive market response, with companies returning a higher return following an open market share repurchase than the market model predicts. With that being said, it is possible to reject the null hypothesis, since there are in fact positive abnormal returns.
Moving on to the average cumulative abnormal returns and considering the first analyzed event window, which comprises the time frame between the day before the event and the day after it. Coincident with the findings of Grullon and Michaely (2002), however with smaller
-0.60% -0.40% -0.20% 0.00% 0.20% 0.40% 0.60% -10 -9 -8 -7 -6 -5 -4 -3 -2 -1 0 1 2 3 4 5 6 7 8 9 10
Average Cumulative Abnormal Returns
CAR Average Conf Level Up Conf Level Down
0,40% 10 0,05% 2,139 3,247%**
Day Avg. AR t-test for AR p-value
0 0,25% 5,595 0,000%***
Figure 5: Cumulative Abnormal Returns during event window using the selected sample (in % terms).
Figure 6: Average Abnormal Returns and Average Cumulative Abnormal Returns and considering the multiple time periods studied and their significance tests.
(-1,+1) (-2,+2)
Average CAR 0,68% 0,59%
t-test 9,389 7,049
16
magnitude than with the sample used by them which found abnormal returns of 2.57%, there are in fact significant positive cumulative abnormal returns during this time frame of about 0.68%. Also, when considering the time frame of 2 days before the event to 2 days after, it is possible to conclude exactly the same. The results signal a positively significant average cumulative abnormal return of 0.58%, which compared with the findings of both of the authors stated on the literature review, are much smaller since Ikenberry (1995) had found abnormal returns during the same days of 3.5% with an older sample (from 1980-1990), and Lee, Park and Pearson (2015), with a more recent sample (from 2007-2011), of about 1.37%. The reasons behind these findings might be related with the banalization of share repurchase programs in the past years, and the market sentiment that these might be used as earnings manipulation. Additionally, the main reason of why share repurchases were conducted in the past, to signal the market of undervaluation, had a big impact on the market, which is not the case today since that is not the main reason of why firms do it. However, the market response continues to be positive, and even tough mitigated, there are still abnormal returns following open-market share repurchases.
Additionally, it is interest to acknowledge the differences between sectors to try to understand in which sectors is this more meaningful and in which ones is this effect more relevant. Considering the event window comprising the time frame between the day before and the day after the event, there is a large difference between sectors, with companies included in the Materials sector, setting the largest cumulative average abnormal return of 1.58%. Furthermore, the Information Technology and Consumer Discretionary sectors also register large significant cumulative average abnormal returns of 1.48% and 0.972%. On the other hand, the Real Estate sector with negative cumulative average abnormal returns of about -0.09% during the same time frame signaling that the above-mentioned conclusions do not apply to all sectors, and that differences between sectors indeed exist.
17
5.2. Real EPS vs. No Repurchase EPS
Following the analysis above, the mitigation of abnormal returns following a share repurchase and since valuations are at record high, the reason why firms are conducting share buybacks may not be the same as before. Therefore, I will proceed analyzing the possibility of EPS inflation for individual firms. This is relevant since, as mentioned in the literature review section, Brav, Graham, Harvey and Michaely (2005) concluded that 75% of the surveyed executives claimed that EPS inflation was one of the main drivers of share repurchases.
By conducting the framework used by Oded and Michel (2008) on the 500 companies of the S&P 500 Index, over 6 quarters, since the first quarter of 2017 until the second one of 2018, it is possible to assess the EPS inflation due to buybacks. The adjusted EPS if no repurchase would have happened was calculated for each company in each quarter, and the difference in percentage terms was computed. Then, in order to evaluate the impact in the average S&P 500 company EPS, these differences were then weighted according to the firms’ current weights in the index and summed.
According to the data, it is possible to acknowledge a declining, however positive impact over the six quarters of buybacks on the firms’ Earnings per Share. Over the past six quarters, there is an average cumulative impact of about 2.76%, and so an average of 0.46% per quarter on the firms’ EPS. Concerning these values, it is worthy of acknowledgment that repurchases are indeed inflating earnings per share over the past quarters, and therefore, boosting valuations for the companies in the index.
The overheat of valuations, and the large amounts of debt incurred in the last years are signals that companies may be using buybacks to boost and support the market, and try to extend the current bull market. Given the positive response by the market in the short-term and the accretive effect on EPS that will probably generate additional share price returns, executives are acknowledging the possibilities of the usage of buybacks as an earnings manipulation tool,
18
just as Brav, Graham, Harvey and Michaely (2003) had previously found. Furthermore, it is fair to assume that the stop of this trend would mean that the market might be affected in a negative way, with declining share prices; however, this could benefit companies and its shareholders in the long run.
5.3. Probability of default and Capital Deterioration
While increasing buybacks at this fast pace, companies are reducing their equity values since in an accounting perspective, companies reduce their cash holdings by the amount of the share repurchase made, while at the same time increase their treasury shares account, which is negative equity. Additionally, the fact that companies are repurchasing stock at the level of Price-to-Book ratio at historical highs (3.3x for the S&P 500 Index), means that the value destruction ability of buybacks is even larger since companies are paying much more than their book value, the money spent repurchasing stock could be destroyed. At the same time, companies are conducting most of this repurchase programs using cheap debt due to the historically low interest rates of the past years.
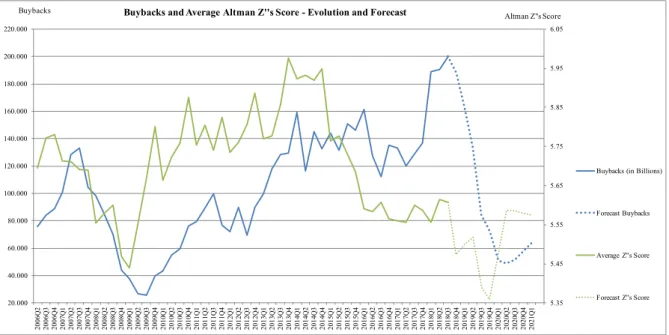
5.35 5.45 5.55 5.65 5.75 5.85 5.95 6.05 20.000 40.000 60.000 80.000 100.000 120.000 140.000 160.000 180.000 200.000 220.000 2006Q 2 2006Q 3 2006Q 4 2007Q 1 2007Q 2 2007Q 3 2007Q 4 2008Q 1 2008Q 2 2008Q 3 2008Q 4 2009Q 1 2009Q 2 2009Q 3 2009Q 4 2010Q 1 2010Q 2 2010Q 3 2010Q 4 2011Q 1 2011Q 2 2011Q 3 2011Q 4 2012Q 1 2012Q 2 2012Q 3 2012Q 4 2013Q 1 2013Q 2 2013Q 3 2013Q 4 2014Q 1 2014Q 2 2014Q 3 2014Q 4 2015Q 1 2015Q 2 2015Q 3 2015Q 4 2016Q 1 2016Q 2 2016Q 3 2016Q 4 2017Q 1 2017Q 2 2017Q 3 2017Q 4 2018Q 1 2018Q 2 2018Q 3 2018Q 4 2019Q 1 2019Q 2 2019Q 3 2019Q 4 2020Q 1 2020Q 2 2020Q 3 2020Q 4 2021Q 1
Buybacks and Average Altman Z''s Score - Evolution and Forecast
Buybacks (in Billions)
Forecast Buybacks Average Z''s Score Forecast Z''s Score Altman Z''s Score Buybacks Buybacks
19
With that being said, whereas companies are increasing their expense on buybacks and focusing on short-term gains and shareholder satisfaction, they are at the same time putting their long-term perspectives at risk, by levering up their balance sheets and decreasing equity. If a major downturn happens in the following years, companies may not have the necessary slack, nor the equity buffers needed to go through a recession.
By looking at the Figure 8, that compares the trends that the companies’ probability of default, as measured by their Altman Z’’s Score, and the buybacks per quarter, there is a very similar relationship between both variables between the 4th quarter of 2009 and the 4th quarter of 2014. Since then, companies’ scores have been deteriorating; reaching almost the minimum levels they did in 2009, during the last financial crisis, signaling that companies are riskier and have less financial strength. This seems to have happened due to the decrease in the equity to debt ratio since 2014. From 2009 to 2014, following the crisis, companies had the need to de-lever and capitalize, in order to recover from the recession’s impact, so the equity to debt ratio was mostly unchanged through those years.
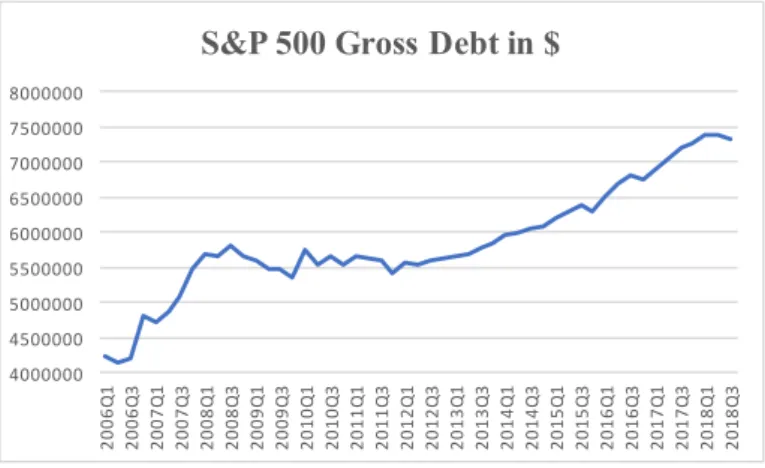
Since 2015, companies started levering up their balance sheets (Figure 9), taking advantage of cheap debt, and therefore boosting their leverage ratios, so decreasing their financial health and consequently their empirical credit ratings. At the same time this happens, buybacks are keeping up the upward trend reaching record levels during this year, with companies claiming
4000000 4500000 5000000 5500000 6000000 6500000 7000000 7500000 8000000 2006Q 1 2006Q 3 2007Q 1 2007Q 3 2008Q 1 2008Q 3 2009Q 1 2009Q 3 2010Q 1 2010Q 3 2011Q 1 2011Q 3 2012Q 1 2012Q 3 2013Q 1 2013Q 3 2014Q 1 2014Q 3 2015Q 1 2015Q 3 2016Q 1 2016Q 3 2017Q 1 2017Q 3 2018Q 1 2018Q 3
S&P 500 Gross Debt in $
20
lack of investment opportunities as the main reason they are conducting this extreme level of share repurchases. The main concern related to Figure 8 is the fact that since we are at the top of an economic cycle, the companies’ financial strength should also be booming, and so their Standardized Altman Z-Score should be similar to the ones prior to the last financial crisis. However, it is possible to assess that those are already in a declining trend almost reaching the same values of 2009. Considering the possibility of a recession in the following years, we can expect a deceleration of buyback expenses and also the harming of the average Standardized Z-Score, just as it did in the last crisis. It was then possible to forecast the possible evolution in Figure 8, assuming a similar crash in the market.
In order to analyze this evolution, and confirm the statements made, it is worthy of deconstructing the average scores, so as to understand which of the financial ratio(s) used to calculate them are decreasing, and harming the companies’ financial strength. By doing so, it is possible to acknowledge whether companies are becoming less profitable, levering up, decreasing their retained earnings or their operational efficiency and short-term financial health, and so, what is the real reason that is endangering companies in the S&P 500 Index. The graph below allows for this analysis since 2006:
70.00% 75.00% 80.00% 85.00% 90.00% 95.00% 100.00% 105.00% 110.00% 1.50% 6.50% 11.50% 16.50% 21.50%
Standardized Altman Z-Score decomposition
WCP/ASSETS RE/ASSETS EBIT/ASSETS BOOK EQ/DEBT Figure 10: Decomposition of Altman Z’’s Score by the 4 financial ratios that compose it.
21
Considering the evolution of the financial ratios used to compute the score, two of them can be held responsible of harming the companies’ financial strength in the past years: Working Capital to Assets, and with a more abrupt downward trend, the Book Equity to Debt. Both ratios are currently at lower values then the ones registered during the last financial crisis, signaling that companies are more levered, with equity only comprising, on average, 75% of debt, and following a downward trend due to the above-mentioned reasons. At the same time, companies have been decreasing their liquidity and short-term financial health by decreasing the WCP/Assets ratio, with the WCP representing, on average, only 8.86% of Total Assets on the 2nd quarter of 2018.
Figure 11 allows for the matching between the firms’ Standardized Altman Z-Score and their empirical credit ratings. By now and since the 4th quarter of 2015, it is possible to conclude that the average company in the S&P 500 index, is already considered to be BB+ rated, meaning that it is not even considered to be investment grade, while it has been whether BBB or BBB- since the economy picked up following the last financial crisis, so above the investment threshold. In case a recession happens, as stated in Figure 8, it is predicted that companies will reach a worse state than they did in 2009, with the Average Standardized Z-Score falling to 5.35, still BB+ according to Figure 11, but already close to the lower bound of downgrading to BB.
22
5.4. Corporate Conditions and General Electric Case
This last point to be considered relates to share buybacks in the sense that acquisitions in the past years have been growing, just as dividends and buybacks. Therefore, companies are reducing their equity buffers to compensate investors with large payout ratios or conducting acquisitions. Consequently, it is relevant to relate buybacks and goodwill, to really assess the impact of the current situation and to assess further developments.
Additionally, one must consider the Goodwill evolution over the past years, since it accounts for a very large part of Equity and total Assets for the S&P 500 Index companies, mostly due to rising M&A activity over the past years, with it accounting to about 42.8% of total
combined equity, and 10% of total assets. The graph below allows for a relation between this value and the one recorded prior to the last financial crisis, which is already surpassed, since its maximum value was set at 42.6% before the market fell. A forecast of a possible evolution of this ratio if a drawdown similar to the one happened in 2009 is presented below.
Lower Bound Upper Bound Rating
8,15 8,15 AAA 7,60 8,15 AA+ 7,30 7,60 AA 7,00 7,30 AA-6,85 7,00 A+ 6,65 6,85 A 6,40 6,65 A-6,25 6,40 BBB+ 5,85 6,25 BBB 5,65 5,85 BBB-5,25 5,65 BB+ 4,95 5,25 BB 4,75 4,95 BB-4,50 4,75 B+ 4,15 4,50 B 3,75 4,15 B-3,20 3,75 CCC+ 2,50 3,20 CCC 1,75 2,50 CCC-1,75 1,75 D Figure 11: Empirical matching between Std. Altman Z-Scores and Credit Ratings.
23
This can be seen as another red flag, since while the Equity to Debt Ratio is at its bottom; the Goodwill to Total Equity and to Total Assets is at record levels. If a major downturn tends to happen, goodwill will suffer a write-down as it normally does since the premiums paid when conducting acquisitions are not justified with corresponding cash flows during those times, as it happened in 2008 and 2009, when almost $161 Billion of Goodwill (1% of the S&P 500’s total market cap) were impaired. If that in fact happens, a major share of the companies’ equity buffer will also be destroyed. The impairment of goodwill will be reflected in the companies’ results, endangering their Retained Earnings and Reserves accounts, which are their main sources of stability.
On Figure 13 it is possible to see, if a downturn similar to the one in 2009 happens in the next two years, in the same % of Equity as it did, this would mean that companies would see a write-down of almost $300 Billion. This is especially relevant when real-life cases of share
32.00% 34.00% 36.00% 38.00% 40.00% 42.00% 44.00% 2006Q 1 2006Q 2 2006Q 3 2006Q 4 2007Q 1 2007Q 2 2007Q 3 2007Q 4 2008Q 1 2008Q 2 2008Q 3 2008Q 4 2009Q 1 2009Q 2 2009Q 3 2009Q 4 2010Q 1 2010Q 2 2010Q 3 2010Q 4 2011Q 1 2011Q 2 2011Q 3 2011Q 4 2012Q 1 2012Q 2 2012Q 3 2012Q 4 2013Q 1 2013Q 2 2013Q 3 2013Q 4 2014Q 1 2014Q 2 2014Q 3 2014Q 4 2015Q 1 2015Q 2 2015Q 3 2015Q 4 2016Q 1 2016Q 2 2016Q 3 2016Q 4 2017Q 1 2017Q 2 2017Q 3 2017Q 4 2018Q 1 2018Q 2 2018Q 3 2018Q 4 2019Q 1 2019Q 2 2019Q 3 2019Q 4 2020Q 1 2020Q 2 2020Q 3 2020Q 4 2021Q 1
Goodwill to Total Equity
-180000 -160000 -140000 -120000 -100000 -80000 -60000 -40000 -20000 0 2006Q 1 2006Q 2 2006Q 3 2006Q 4 2007Q 1 2007Q 2 2007Q 3 2007Q 4 2008Q 1 2008Q 2 2008Q 3 2008Q 4 2009Q 1 2009Q 2 2009Q 3 2009Q 4 2010Q 1 2010Q 2 2010Q 3 2010Q 4 2011Q 1 2011Q 2 2011Q 3 2011Q 4 2012Q 1 2012Q 2 2012Q 3 2012Q 4 2013Q 1 2013Q 2 2013Q 3 2013Q 4 2014Q 1 2014Q 2 2014Q 3 2014Q 4 2015Q 1 2015Q 2 2015Q 3 2015Q 4 2016Q 1 2016Q 2 2016Q 3 2016Q 4 2017Q 1 2017Q 2 2017Q 3 2017Q 4 2018Q 1 2018Q 2 2018Q 3 2018Q 4 2019Q 1 2019Q 2 2019Q 3 2019Q 4 2020Q 1 2020Q 2 2020Q 3 2020Q 4 2021Q 1
Goodwill Impairment - S&P 500 Index
Figure 13: Goodwill impairment per quarter since 2006 for S&P 500 companies In Millions of $.
24
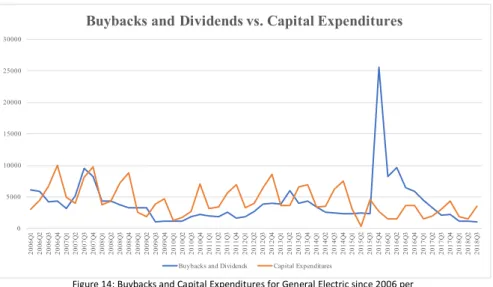
buybacks going wrong are considered, since those are not allowing companies to prepare themselves to tough times that are usually followed by Goodwill impairments. Recently, General Electric (GE), once the most valuable company in the world, has been going through tough times following large payout ratios, which resulted in lower capital expenditures and investment in Research and Development. Since 2006 up until now, GE payed out a very large 130% of their net income in both dividends and share repurchases, therefore, at the same time reducing their capital expenditures, resulting in less innovation and less investment in the company’s business, confirmed by the graph below.
The high volumes of share buybacks conducted by the company, which between the 4th quarter of 2015 and the 2nd one of 2017 repurchased about $50 Billion of their own shares at an average price of about $30, means that according to the declining share price since then (currently sits at 7.50$), it is estimated that the company has burned down about $36 Billion of shareholder value during this period. Bearing in mind the large goodwill write-down on October of this year, of $23 Billion, the company finds itself decapitalized due to the large payout ratios, and in need of reducing leverage, however, without the necessary means to perform the required restructuring. The question arising is whether the company would be in a
0 5000 10000 15000 20000 25000 30000 2006Q 1 2006Q 2 2006Q 3 2006Q 4 2007Q 1 2007Q 2 2007Q 3 2007Q 4 2008Q 1 2008Q 2 2008Q 3 2008Q 4 2009Q 1 2009Q 2 2009Q 3 2009Q 4 2010Q 1 2010Q 2 2010Q 3 2010Q 4 2011Q 1 2011Q 2 2011Q 3 2011Q 4 2012Q 1 2012Q 2 2012Q 3 2012Q 4 2013Q 1 2013Q 2 2013Q 3 2013Q 4 2014Q 1 2014Q 2 2014Q 3 2014Q 4 2015Q 1 2015Q 2 2015Q 3 2015Q 4 2016Q 1 2016Q 2 2016Q 3 2016Q 4 2017Q 1 2017Q 2 2017Q 3 2017Q 4 2018Q 1 2018Q 2 2018Q 3
Buybacks and Dividends vs. Capital Expenditures
Buybacks and Dividends Capital Expenditures
Figure 14: Buybacks and Capital Expenditures for General Electric since 2006 per quarter.Values in Millions of $.
25
better place at the moment if it wouldn’t have performed these massive share repurchase programs.
6. Conclusion
Given the conducted event study and the additional studies it was possible to conclude what is the general impact of buybacks in the market in the past years. According to the results of the event study, it was possible to conclude that there are still cumulative abnormal returns on event windows defined close to a share repurchase transaction, even though, the effect is mitigated when compared to past studies with older samples. This happens mostly due to the fact that while companies in the past performed buybacks to signal the market of its undervaluation, now with the market sentiment that companies are overvalued, the reasons why firms are conducting buybacks are more obscure, which may lead investors to not react as abruptly as they did in the past. Additionally, following the above-mentioned conclusion, it was relevant to also measure the positive impact of share buybacks on the S&P 500 Index’s companies Earnings per Share on the past quarters, which is the main affected financial metric by share buybacks. The average impact of 0.46% per quarter signals that the market has been affected by buybacks, and possibly supported by it. Finally, after doing so, it was important to assess the impact of this trend on the companies’ balance sheets, since the increase in debt used to fuel these programs, might endanger and limit their long-term growth and financial health. It was possible to acknowledge the short-term myopia problem of executives, trying to boost earnings and the market by performing buybacks and deteriorating their balance sheets, with empirical credit ratings at their lowest since the last financial crisis.
As a future study recommendation, I would say that would be interesting to, in about two/three years’ time to go back in time and study this buyback craze, when the true consequences of this truly reflect in the market. Also, a rating outlook, considering the
26
relation of the possible rating downgrades happening in the next years with the buybacks conducted by the S&P 500 index companies would also be interesting.
The main limitation of this study is the lack of information and the abnormal behavior of buybacks of the past 2 years that do not allow deep statistical reliability testing, and variable relationship. Additionally, on the Earnings per Share impact assessment, the assumption that all buybacks are conducted at the beginning of each quarter is not entirely certain in all cases and is used as a simplification.
7. References
Altman, Edward. I. 1968. “Financial ratios, discriminant analysis and prediction of corporate bankruptcy”. Journal of Finance, 23(4), 189-209.
Altman, Edward. I., and Edith Hotchkiss. 2006. Corporate financial distress and
bankruptcy. Hoboken, N.J.: Wiley.
Bartov, Eli, Dan Givoly and Carla Hayn. 1999. “The Rewards to Meeting or Beating Earnings Expectations”. NYU Working Paper No. ELI BARTOV-02.
Bargeron, Leonce, Manoj Kulchania. and Shawn Thomas. 2010. “Accelerated Share Repurchases”. SSRN Electronic Journal.
Bens, Daniel A., Venky Nagar, Douglas J. Skinner and M.H. Franco Wong. 2003. “Employee Stock Options, Eps Dilution, and Stock Repurchases”. Journal of Accounting &
Economics, Vol. 36, No. 1-3, pp. 51-90.
Bhattacharya, Sudipto. 1979. “Imperfect Information, Dividend Policy, and ‘the Bird in the Hand’ Fallacy”. Bell Journal of Economics, 10, 259-270.
Bratli, Daniel and Obaidur Rehman. 2015. “The price impact and timing of actual share repurchases in Norway” Msc diss. NHH - Norwegian School of Economics
27
Boehmer, Ekkehart, Jim Masumeci and Annette B.Poulsen. 1991. “Event-study
methodology under conditions of event-induced variance”. Journal of Financial Economics Volume 30, Issue 2, December 1991, Pages 253-272
EFinanceManagement.2018. Sanjay Borad HUF.www.efinancemanagement.com/dividend-decisions/share-buyback-methods-advantages-and-disadvantages (accessed November 22, 2018)
Fama, Eugene F., Lawrence Fisher., Michael C. Jensen, and Richard Roll. 1969. “The Adjustment of Stock Prices to New Information” International Economic Review, Vol. 10.
Grullon, Gustavo and Roni Michaely. 2000. “The Information Content of Share Repurchase Programs”. SSRN Electronic Journal.
Guthrie, Graeme. 2017. “The Dark Side of Share Buybacks”. SSRN Electronic Journal. Harrington, Scott E. and David G. Shrider. 2007. “All Events Induce Variance: Analyzing Abnormal Returns When Effects Vary across Firms”. The Journal of Financial and
Quantitative Analysis. Vol. 42, No. 1 (Mar., 2007), pp. 229-256
Hribar, Paul, Nicole Thorne Jenkins and W. Bruce Johnson. 2004. “Stock Repurchases as an Earnings Management Device”. Journal of Accounting and Economics, vol. 41, issue 1-2, 3-27.
Ikenberry, David, Josef Lakonishok and Theo Vermaelen. 1995. “Market underreaction to open market share repurchases”. Journal of Financial Economics, 39(2-3), pp.181-208. Investopedia. 2018. IAC. www.investopedia.com/terms/a/accelerated-share-repurchase.asp (accessed 9 Oct. 2018).
Jensen, Michael. C. and William H. Meckling. 1976. “Theory of the Firm: Managerial Behavior, Agency Costs and Ownership Structure”. Journal of Financial Economics, 3(4), 56. Jensen, Michael C. 1986. “Agency Costs of Free Cash Flow, Corporate Finance, and
28
Lee, Inmoo, Yuen Park and Neil D. Pearson. 2015. “Repurchases Have Changed”. KAIST
College of Business Working Paper. Series No. 2015-022
Mackinlay, Craig. 1997. “Event Studies in Finance and Economics”. Journal of Economic
Literature, 35, 13-39.
Miller, Merton H. and Kevin Rock. 1985. “Dividend Policy Under Asymmetric Information,” Journal of Finance, 40, 1031-1051.
Miller, Merton H., and Franco Modigliani. 1961. “Dividend Policy, Growth, and the Valuation of Shares”. The Journal of Business, 34(4), 411.
Oded, Jacob and Allen Michel. 2008. “Stock Repurchases and the EPS Enhancement Fallacy”. Financial Analysts Journal, 64(4), pp.62-75.
Peg Horan, Margaret. 2012. “Are Buybacks Increasing EPS?”. Accounting & Taxation, 4(1), pp.11-24.
Teague, Charles E. and Tao-Hsien Dolly King. 2017. “Accelerated Share Repurchases: Value Creation or Extraction”.
Vermaelen, Theo. 1984. “Repurchase Tender Offers, Signalling and Managerial Incentives,”