Professora do Departamento de Economia da FEA-USP. E-mail: [email protected]. Endereço para contato: FEA/USP – Av.
Prof. Luciano Gualberto, 908. Cid. Universitária. CEP: 05508-010. São Paulo – SP. (Recebido em abril de 2005. Aceito para publicação em março de 2006).
FAbiAnA RoChA
Resumo
O objetivo deste artigo é mostrar que dados em painel podem ajudar a entender o puzzle de Feldstein-Horioka. O uso de dados em painel traria duas vantagens. Primeiro, faria com que fosse evitado o viés em direção à baixa mobilidade de capitais resultante do uso da média dos dados. Segundo, tornaria possível levar em conta efeitos específicos (heterogeneidade), como o tamanho do país. Usando dados em painel para o período 1960-1996 para 29 países em desenvolvimento, o impacto estimado da poupança sobre o investimento é bem menor, sendo possível concluir que existe um grau intermediário de mobilidade de capitais. Assim, o alto valor estimado para a correlação poupança-investimento parece resultar mais da existência de efeitos específicos individuais do país do que de baixa mobilidade de capitais. A estabilidade dos coeficientes estimados ao longo do tempo permanece, contudo, um puzzle.
PalavRas-chave
mobilidade de capitais, dados em painel, heterogeneidade, países em desenvolvimento
abstRact
The purpose of this paper is to show that the use of panel data can shed some light on the Feldstein-Horioka puzzle. The use of panel data would bring in two advantages. First, it would avoid the bias towards low capital mobility brought by the use of time-averaged data. Second, it would make possible to take into account specific effects (heterogeneity) like a country’s size. Pooling annual data for the period 1960-1996 for 29 developing countries, the estimated impact of saving on investment is considerably smaller and it is possible to conclude that there is some degree of capital mobility in developing countries. Therefore, the high estimated saving-investment correlation seems to be due more to the existence of specific individual country effects than to capital immobility. The coefficient stability through time remains a puzzle though.
KeywoRds
capital mobility, panel data, heterogeneity, developing countries
Jel classification
IntRoductIon
The empirical evidence on the effective degree of capital mobility in developing coun-tries is extremely scarce when compared to that for developed economies. This ha-ppens despite widespread acknowledgment of the importance of the extent of capital mobility in determining, for example, optimal monetary and fiscal policies (Fleming, 1962; Mundell, 1968), the exchange rate (Levich, 1985), the tax rate on income from capital (Feldstein and Horioka, 1980), and to analyze the inflationary tax (Easterly et al., 1995).
Feldstein and Horioka (1980) suggested the correlation between saving and invest-ment rates as a measure of the degree of capital mobility. Based on a sample of 16 OECD countries, they obtained evidence that saving and investment rates were highly correlated. They in turn concluded that the degree of capital mobility in industrialized countries was low, going against accepted wisdom that these countries had few res-trictions on capital flows. The Feldstein-Horioka puzzle refers to the empirical finding that estimates of the saving-investment correlation have remained high, despite the use of more recent data and different econometric techniques. Murphy (1984), Obstfeld (1986), Dooley et al. (1987) and Wong (1990) also found a close association between saving and investment for less industrialized and developing countries, although the estimated correlation was lower on average.
The paper is organized in five sections including this introduction. The first section summarizes the main evidence on capital mobility in developing countries in the existing literature. The second section presents the advantages that using panel data techniques may bring to the estimation of the saving-investment correlation. The third section contains a discussion of the results of the estimations, and the last sec-tion concludes.
1. PREvIous REsults FoR dEvEloPInG countRIEs
Feldstein and Horioka (1980) proposed evaluating the degree of capital mobility through the correlation between saving and investment, estimating the following cross-section regression:1
( / )
I Y
i= +
a
b S Y
( / )
i+
u
(1)where
( / )
I Y
is the ratio between gross domestic investment and gross nationalproduct (GNP),
( / )
S Y
is the ratio between gross national saving and GNP, iis acountry index, aand b represent the parameters to be estimated, and u is an error term. Under the null hypothesis of perfect capital mobility, b should be near zero, i.e., there should be no relation between saving and investment. National saving, then, should really be part of an international capital pool free to seek the best rate of re-turn. On the other hand, under the null hypothesis of perfect capital immobility, b should be equal to 1. In this case, all additional saving would go to finance domestic investment.
Using a sample of OECD countries, Feldstein and Horioka (1980) found an estimate for b equal to 0.89 for the period 1960-74. They interpreted this result as implying a low degree of capital mobility among industrialized countries, contradicting the belief that these nations have few barriers to capital flows.
Following Feldstein and Horioka, Dooley et al. (1987) estimated regression (1) us-ing cross-section data for developus-ing countries. Their estimates suggested a close association between saving and investment, indicating a low degree of capital mobil-ity. They found positive correlations for the ratios of saving and investment both in levels and in differences. They also estimated the equations separately for the periods 1960-73 and 1974-84, since a greater degree of capital mobility was expected for the latter period, when industrialized countries reduced their capital controls and the OPEC surpluses were recycled. Surprisingly, the correlations for the first period were
smaller than for the second. These results, nevertheless, appear robust to a variety of econometric objections. To deal with the argument of the political reaction of the government and endogeneity of saving, instrumental variables were included in the regressions.2 The results, though, were similar to those obtained using ordinary least squares regressions.
Various authors have also tested the saving-investment correlation for individual countries. Thus, equation (1) has been estimated for different countries using time series. Since investment and saving appear to have a unit root, the regressions have been carried out using the first difference of these variables to avoid the problem of spurious correlation. (Granger and Newbold, 1974). Mamingi (1997) and Montiel (1994) used the first difference of saving and of investment, but assumed that these are cointegrated, given that the intertemporal budget constraint does not allow sav-ing and investment to diverge permanently.3 Mamingi (1997) estimated a time series version of equation (1), adopting the fully modified OLS estimator (Phillips and Hansen, 1990). Montiel (1994), besides the regressions with variables in levels and in differences, estimated an error-correction version of the Feldstein-Horioka regres-sion. A simple specification is chosen, given the small number of observations: the first difference of investment is regressed in a constant, in the lagged residual of the regression from cointegration and the first difference of saving. The regressions were estimated using least squares and instrumental variables.
Bagnai and Manzocchi (1996) try to avoid imposing the cointegration hypothesis. They argue that since saving and investment are I (1), the hypothesis of Feldstein and Horioka of perfect capital immobility corresponds to the hypothesis that
( / )
S Y
i−
( / )
I Y
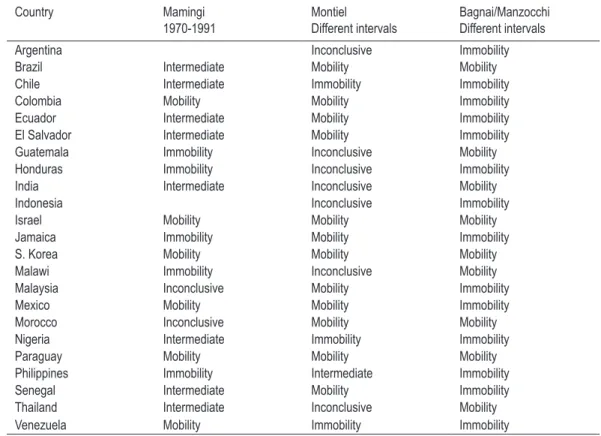
i is I (0). Given that by definition the difference between saving and investment is equal to the current account balance, if it is not possible to reject the hypothesis of the nonstationary of the current account , one can conclude that there is capital mobility.The evidence for developing countries using time series data is summarized in Table 1. The results indicate that although capital is far from being perfectly mobile, there is a certain degree of mobility. This, then, goes against common sense that says these countries maintain a significant legal restriction on capital movements (inflows and
2 The endogeneity of saving is one of the arguments presented in the literature to try to conciliate a high correlation between saving and investment and a high degree of capital mobility. A special form of endogeneity can arise from the reaction of the government to current account deficits. If the govern-ment does not like deficits in its current account (increases in I/Y in relation to S/Y), it responds by adopting a contractionist fiscal policy. Since national saving is the sum of private and public saving, national saving becomes endogenous through its public component. (Summers, 1988).
outflows). Nevertheless, there is no consensus regarding the extent of capital mobility in each country individually. Only two of the 23 countries (Israel and S. Korea) are classified equally by Mamingi (1997), Montiel (1994) and Bagnai and Manzocchi (1996). On the other hand, eight countries are classified differently by the three au-thors as to their levels of capital mobility (Ecuador, El Salvador, Guatemala, India, Malawi, Malaysia, Senegal and Thailand).
taBlE 1 – caPItal MoBIlItY In dEvEloPInG countR IEs: soME PREvIous REsults
Country Mamingi 1970-1991
Montiel
Different intervals
Bagnai/Manzocchi Different intervals
Argentina Inconclusive Immobility
Brazil Intermediate Mobility Mobility
Chile Intermediate Immobility Immobility
Colombia Mobility Mobility Immobility
Ecuador Intermediate Mobility Immobility El Salvador Intermediate Mobility Immobility Guatemala Immobility Inconclusive Mobility Honduras Immobility Inconclusive Immobility India Intermediate Inconclusive Mobility
Indonesia Inconclusive Immobility
Israel Mobility Mobility Mobility
Jamaica Immobility Mobility Immobility
S. Korea Mobility Mobility Mobility
Malawi Immobility Inconclusive Mobility Malaysia Inconclusive Mobility Immobility
Mexico Mobility Mobility Immobility
Morocco Inconclusive Mobility Mobility Nigeria Intermediate Immobility Immobility
Paraguay Mobility Mobility Mobility
Philippines Immobility Intermediate Immobility Senegal Intermediate Mobility Immobility Thailand Intermediate Inconclusive Mobility Venezuela Mobility Immobility Immobility
Notes: Previous results are presented only for countries that will be subsequently considered in this article. Mamingi (1997, Table 5). Montiel (1994, Table 2) (results of instrumental variables). Bagnai and Manzocchi (1996, Table 2). “Intermediate” means that both the hypothesis of perfect mobility and the hypothesis of perfect immobility were rejected. “Mobility“ means that only the hypothesis of perfect capital mobility was not rejected. “Immobility” means that only the hypothesis of perfect immobility was not rejected. “Inconclusive” means that it was not possible to discriminate between mobility and immobility.
non-correlated. Montiel (1994) conducted uncovered interest parity (UIP) tests for 48 countries during the period January 1985 to December 1990.4 Thirty-two countries
in the sample presented mean deviations that were different than zero.
The Euler equation tests establish that the expected marginal rates of substitution between current and future units of domestic currency should be equal for foreign and domestic residents. The results for the great majority of countries, according to Montiel (1994), indicate a high degree of capital mobility.
Finally, the consumption-smoothing approach uses the hypothesis of permanent in-come to assess capital mobility. If the degree of capital mobility is high, the economy as a whole should be able to completely smooth out consumption over the occurrence of shocks. This means that the current account should be used as a buffer to smooth out aggregate consumption in the case of shocks to national cash flow (output less investment less government expenditures). If cash flow is expected to grow on ave-rage over the long run, it is optimal for the country to accumulate debt by running current account deficits. If , on the other hand, long-run cash flow is expected to fall, it is optimal for the country to maintain a current account surplus (boost its saving) in order to be able to consume in the future at a level consistent with its permanent income. If the level and the volatility of current account movements are smaller than those forecasted under the full smoothing hypothesis, then capital has a low degree of mobility. Ghosh and Ostry (1995), using this approach, concluded that in 30 of 45 countries the null hypothesis that consumption is completely smoothed out vis-à-vis shocks could not be rejected, suggesting a relatively high degree of capital mobility in developing countries. Hussein and Mello Jr (1999) also used the intertemporal consumption-smoothing model to test the degree of capital mobility in developing countries. They found evidence of very mobile capital in nine of the countries in their sample (Chile, Greece, Ireland, Israel, Malaysia, Mexico, South Africa, South Korea and Venezuela).
2. PanEl data tEcHnIQuEs and tHE savInG-InvEstMEnt coRRElatIon
There are basically two arguments in the literature that try to reconcile the existence of a high correlation between saving and investment and the hypothesis of capital mobility. The first is the endogeneity of saving, implying that other factors could produce a correlation between saving and investment even when capital is mobile. Examples of these exogenous factors are: the pro-cyclicity of saving and investment, population growth (Summers, 1988; Obstfeld, 1986); productivity and other shocks
(Obstfeld, 1986); the presence of consumption of non-tradable goods (Murphy, 1986; and Wong, 1990); and the reaction of the government to current account imbalances (Summers, 1988; and Wong, 1990). To deal with this problem of endogeneity, Feldstein and Horioka (1980), Feldstein (1983), Tesar (1991) and others work with a cross-section analysis based on sample averages during the time period, trying to eliminate the influence of the economic cycle on the saving-investment correlation. Since I Y/ and S Y/ are pro-cyclical, the use of annual data implies an upward bias in the estimation of the coefficient b, and to avoid the problem it would be best to work with the mean of the data. Summers (1988) and Feldstein and Bacchetta (1991), in turn, add the variable to the regression. Finally, Feldstein and Horioka (1980), Frankel (1986, 1991) and Dooley et al. (1987) use instrumental variables.
According to Sinn (1992), however, the use of intertemporal models calls attention to a new empirical problem.
Assuming that public bonds mature in a period, the external budget constraint in period t can be written as:
M
t−
X
t+
r B
t t−1=
∆
B
t=
B
t−
B
t−1 (2)where
M
t represents imports,X
texports,B
t is external debt, andr
t is the interest rate (one period). Equation (2) corresponds to the usual external constraint, establish-ing that a current account deficit must be financed by issuestablish-ing new debt.Solving the sequence of type (2) period-to-period constraints yields the following equation:
B
r
tX
M
r
B
t
t t
n n n
0 1
1
1
1
1
=
+
−
+
+
= ∞
→∞
∑
(
)
(
)
lim
(
)
(3)occur with the difference between saving and investment.5 However, since the aver-ages over the long run of the saving/GNP ratio are approximately equal, the use of average data introduces a correlation between these two variables (see the appendix). Hence, cross-section regressions using the average of long-term investment and saving tend to erroneously signal a low degree of capital mobility.6
There are then, two opposing arguments. The economic cycle argument implies that when annual data are used, the coefficient b is greater than that calculated using the average of the data, while the intertemporal budget constraint argument suggests the opposite.
To avoid these two potential sources of bias, panel techniques are employed. The use of annual data tries to avoid the bias implied by the solvency argument and the inclu-sion of time dummies controls for temporal factors common to all countries (e.g., the international economic cycle).
The second argument for a high correlation between saving and investment even in the presence of capital mobility is given by the country-size effect. This appears in two versions. Murphy (1984) and Baxter and Crucini (1993) suggest that if a country is large enough to affect the world interest rate, an increase in its national saving will reduce international interest rates and consequently increase domestic investment. Harberger (1980), in turn, argues that “as countries become larger, they become more diversified and the need to borrow from abroad in the event of shock declines.”
If the country-size argument is important, the estimation of a regression in which the countries in the sample are treated identically in their capacity to influence in-ternational market conditions will imply a bias in the correlation coefficient. In this sense, the use of panel data brings the additional advantage of controlling for coun-try-specific effects such as size.
3. REsults
The sample is composed of a set of annual observations of the ratios of saving and investment from 1960 to 1996 for 29 developing countries: Argentina, Botswana, Brazil, Chile, Colombia, Ecuador, Egypt, El Salvador, Ghana, Guatemala, Honduras, Hong Kong, India, Indonesia, Israel, Jamaica, S. Korea, Malawi, Malaysia, Mexico,
5 The result of Sinn (1992) is derived for a stagnant (no-growth) economy, but his argument is also valid when there is growth.
Morocco, Nigeria, Pakistan, Paraguay, Philippines, Senegal, Singapore, Thailand and Venezuela. The data were obtained from the World Bank Indicators (1998). Domestic in-vestment corresponds to gross inin-vestment in the private sector and by the government, and saving to the sum of private sector and government saving. Both are divided by the gross domestic product (GDP) in order to convert them into rates. The data set ends in 1996 so the results can be compared to the cross-section estimates already available for developing countries, that do not consider samples much longer than this.
Initially, only whether country-specific effects exist is examined. In order to do so four estimation procedures are used: pooled, between, within and an error-com-ponents (random effects) model. The difference among the estimators derives from the importance given by each to individual and temporal dimensions. The pooled estimator assumes both individual homogeneity and temporal stability. The between estimator is obtained from the average ratios of saving and investment in the period for each country. In this way, it eliminates the temporal variability and emphasizes the dimension among countries. Just as the pooled estimator, the between one implies homogeneity among countries. Empirical studies, such as those discussed previously, generally used the between estimator with the argument that the economic cycle influences saving and investment in the same direction. The within estimator is cal-culated from the difference in the ratio of saving and investment and the averages over time for each country. It uses the variability among countries and takes into account the heterogeneity of the data. The random effects model incorporates heterogeneity among the countries in including a specific non-observable effect in the error term.
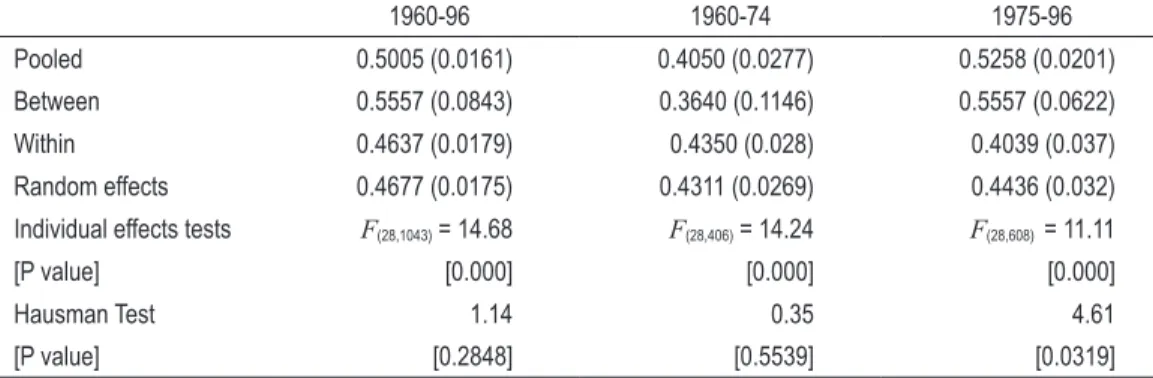
Table 2 shows the results of the different estimators for the sample period along with two sub-periods (1960-74 and 1975-96).
taBlE 2 – savInG-InvEstMEnt coRRElatIon coEFFIcIEnt
1960-96 1960-74 1975-96
Pooled 0.5005 (0.0161) 0.4050 (0.0277) 0.5258 (0.0201) Between 0.5557 (0.0843) 0.3640 (0.1146) 0.5557 (0.0622)
Within 0.4637 (0.0179) 0.4350 (0.028) 0.4039 (0.037) Random effects 0.4677 (0.0175) 0.4311 (0.0269) 0.4436 (0.032) Individual effects tests F(28,1043)= 14.68 F(28,406)= 14.24 F(28,608) = 11.11
[P value] [0.000] [0.000] [0.000]
Hausman Test 1.14 0.35 4.61
[P value] [0.2848] [0.5539] [0.0319]
Except for the period 1960-74, the correlation coefficient between saving and in-vestment for the between estimator is relatively high.7 Moreover, this estimator and
the pooled one present similar values in all sample periods. The within and random effects estimators are quite similar, although only in the period 1975-96 does the Hausman Test (Hausman, 1978) indicate that the random effects model is superior to the fixed effects one.
In any event, both the within and random effects estimates are statistically different from zero and one at the 1% level of significance, indicating rejection of both the hypothesis of perfect mobility and that of perfect immobility. However, the values are well below that considered a benchmark for industrial countries by Murphy (1984), which is 0.6.
The null hypothesis of the existence of an individual fixed effect is strongly accepted for the 29 countries for all the samples. The results indicate, then, that when the het-erogeneity of countries is specified, lower values of the saving-investment correlation are obtained. The question that remains unanswered is the persistence in the value of the estimated coefficient. Even though the within coefficient is lower in the second sub-interval than in the first, suggesting a relative increase in capital mobility over time, this change is not significant.8
In order to account for the effects of the economic cycle (supposing the existence of an international cycle), we estimated a least squares dummy variable(LSDV) model, extended to include the specific effect of time: 9
0
it i t it it
y = a + a + g + β′x + ε (4)
where yit is equal to I(i,t)/Y(i,t), xit is equal to S(i,t)/Y(i,t), the index i represents the country and t time. The model has a general constant and a “group” effect for each country. It assumes that the differences over the units can be captured by differences in the constant term, i.e., ai removes the fixed differences among countries (size). The model also has a “time” effect for each period. gt is included to eliminate time-related factors common to all the countries included in the sample.10
7 It is difficult to establish a period to divide the sample, since developing countries alternated periods of greater and lesser capital controls that do not necessarily coincide. We chose the mid-1970s because it is considered the main point of inflection in international capital flows.
8 Dooley et al. (1987) also did not find evidence of increased capital mobility after 1973, both for indus-trialized and developing countries. Indeed, the positive correlations between saving and investment appear to be higher in the period after 1973.
9 The random effects model including a specific time component along with individual effects é
' t
it it it i
y = a + bx + e +u +w . The estimate obtained, although not presented here, is very similar to that of the fixed effects model.
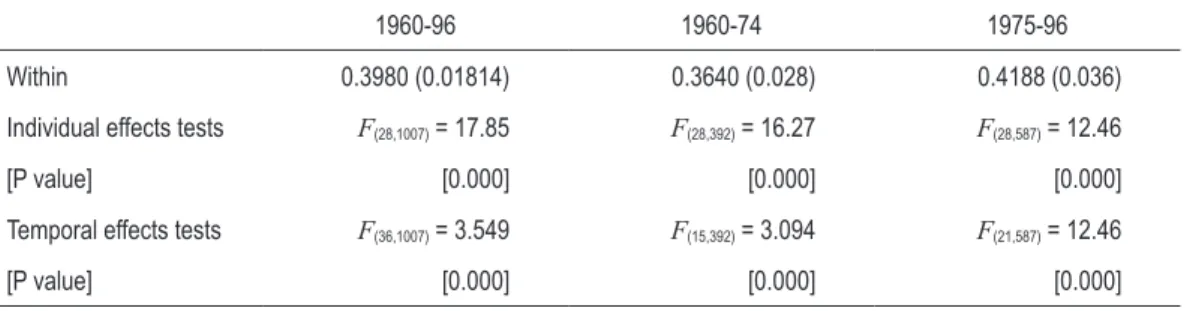
The estimates of equation 4 are presented in Table 3 below.
taBlE 3 – EstIM atEs oF tHE savInG-InvEstMEnt EQuatIon
1960-96 1960-74 1975-96
Within 0.3980 (0.01814) 0.3640 (0.028) 0.4188 (0.036)
Individual effects tests F(28,1007)= 17.85 F(28,392)= 16.27 F(28,587)= 12.46
[P value] [0.000] [0.000] [0.000]
Temporal effects tests F(36,1007)= 3.549 F(15,392)= 3.094 F(21,587)= 12.46
[P value] [0.000] [0.000] [0.000]
Note: Standard deviations in parentheses.
The estimated coefficients fall a bit. They are still statistically different from zero and one, indicating rejection of the hypotheses of perfect mobility and perfect immobility. The hypothesis of the existence of a specific fixed effect is accepted in all periods. If the country effects are considered separately, the hypothesis of no country effects is rejected at the 1% level (F statistic equals to 16.802). When a model with country effects is compared with another with country and time effects, the F statistic (5.916) indicates that the international economic cycle is also a significant element in the analysis.
conclusIons
It has been more than 25 years since Feldstein and Horioka (1980) established that averages of saving and investment- expressed as ratios of GDP- were highly correlated, and still there is interest in their puzzle.
time effects allows removal of fixed differences among countries (size) and temporal factors common to all countries (world economic cycle). Besides this, given that the intertemporal budget constraint implies that saving and investment are approximately equal when averaged data, it is possible to work with annual data. The basic idea is to verify if these properties of panel data methods may be in fact useful in the context of the Feldstein-Horioka debate.
aPPEndIX
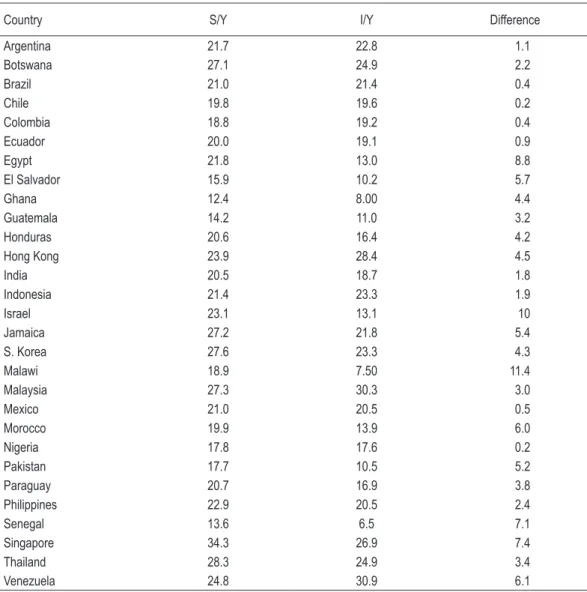
As can be seen in Table A.1, only in nine of the 29 countries in the sample is the di-fference between saving and investment greater than 5%. This is not to say, however, that these countries did not respond to international capital flows through movements in their current accounts. A good example is Chile. In 1981 there was a large increase in its current account, followed by a rapid decline in 1983. In reality, in two years it passed from current account deficit of 10% of GNP to a surplus of nearly 3% of GNP. However, as can be seen in the table, the difference between the saving/GNP ratio and the investment/GNP ratio is only 0.2% when mean data are considered.
taBlE a.1 – InvEstMEnt/GnP and savInG/GnP: avER aGE data
Country S/Y I/Y Difference
Argentina 21.7 22.8 1.1
Botswana 27.1 24.9 2.2
Brazil 21.0 21.4 0.4
Chile 19.8 19.6 0.2
Colombia 18.8 19.2 0.4
Ecuador 20.0 19.1 0.9
Egypt 21.8 13.0 8.8
El Salvador 15.9 10.2 5.7
Ghana 12.4 8.00 4.4
Guatemala 14.2 11.0 3.2
Honduras 20.6 16.4 4.2
Hong Kong 23.9 28.4 4.5
India 20.5 18.7 1.8
Indonesia 21.4 23.3 1.9
Israel 23.1 13.1 10
Jamaica 27.2 21.8 5.4
S. Korea 27.6 23.3 4.3
Malawi 18.9 7.50 11.4
Malaysia 27.3 30.3 3.0
Mexico 21.0 20.5 0.5
Morocco 19.9 13.9 6.0
Nigeria 17.8 17.6 0.2
Pakistan 17.7 10.5 5.2
Paraguay 20.7 16.9 3.8
Philippines 22.9 20.5 2.4
Senegal 13.6 6.5 7.1
Singapore 34.3 26.9 7.4
Thailand 28.3 24.9 3.4
REFEREncEs
Bagnai, A.; Manzocchi, S. Unit root tests of capital mobility in the less developed countries. Weltwirtschaftliches archiv, v. 132, n. 3, p. 545-557, 1996.
Baxter, M.; Crucini, M. Explaining saving-investment correlations. americanEconomic Review, 83, p. 416-436, 1993.
Dooley, M.; Frankel, J.; Mathieson, D. International capital mobility: what do sav-ing-investment correlations tell us? IMF staff Papers, v. 34, n. 3, p. 503-530, 1987.
Easterly, W. R.; Mauro, P.; Schmidt-Hebbel, K. Money demand and seigniorage maximizing inflation. Journal of Money, credit, and Banking, v. 27, n. 2, p. 583-603, 1995.
Feldstein, M. Domestic saving and international capital movements in the short run and the long run. the European Economic Review 21, p. 129-151, 1983.
Feldstein, M.; Bacchetta, P. National saving and international investment. In: Bern-heim, D.; Shoven, J. (eds.), national saving and economic performance. Chicago: University of Chicago Press, 1991, p. 201-220.
Feldstein, M.; Horioka, C. Domestic saving and international capital flows. Economic Journal, 90, p. 314-329, June 1980.
Fleming, J. M. Domestic financial policies under fixed and under floating exchange rates. IMF staff Papers, v. 9, n. 3, p. 369-380, 1962.
Frankel, J. International capital mobility and crowding-out in the U.S. economy: imperfect integration of financial markets or of goods markets? In:Hafer, R. (ed.), How open is the u.s.economy? Lexington: Lexington Books for the Federal Reserve Bank of St. Louis, 1986, p. 33-67.
_______. Quantifying international capital mobility in the 1980s. In: Bernheim, D.; Shoven, J. (eds.), nationalsaving and economic performance. Chicago: Chicago University Press, 1991, p. 227-260.
Ghosh, A. R.; Ostry, J. D. The current account in developing countries: a perspective from the consumption-smoothing approach. the World Bank EconomicReview, v. 9, n. 2, p. 305-333, 1995.
Granger, C. W. J.; Newbold, P. Spurious regression in econometrics. Journalof Econo-metrics, v. 2, n. 2, p. 111-120, 1974.
Harberger, A. C. Vignettes on the world capital market. american EconomicReview, v. 70, Papers and Proceedings, p. 331-337, 1980.
Hausmann, J. Specification tests in econometrics. Econometrica, p. 1251-1271, No-vember 1978.
Levich, R. M. Empirical studies of exchange rates: price behavior, rate determina-tion and market efficiency. In: Jones, R. W.; Kenen, P. B. (eds.), Handbook of international economics, v. II. Amsterdan: Elsevier, 1985.
Mamingi, N. Saving-investment correlations and capital mobility: the experience of developing countries. Journal of Policy Modeling, v. 19, n. 6, p. 605-626, 1997.
Montiel, P. Capital mobility in developing countries: some measurement issues and empirical estimates. World Bank Economic Review, v. 8, n. 3, p. 311-350, 1994.
Mundell, R. A. International economics. New York: MacMillan, 1968.
Murphy, R. G. Capital mobility and the relationship between saving and investment in OECD countries. Journal of International Money and Finance, v. 3, p. 327-342, 1984.
_______. Productivity shocks, non-traded goods and optimal capital accumulation.
European Economic Review, 30, p. 1081-1095, 1986.
Obstfeld, M. Capital mobility in the world economy: theory and evidence. carnegie-Rochester conference on Public Policy, 24, p. 55-104, 1986.
Obstfeld, M.; Rogoff, K. The six major puzzles in international macroeconomics: is there a common cause?. nBER Working Paper 7777, 2000.
Phillips, P. C. B.; Hansen, B. E. Statistical inference in instrumental variables regression with I (1) processes. Review of Economic studies, v. 57, n. 1, p. 99-125, 1990.
Sinn, S. Saving-investment correlations and capital mobility: on the evidence from annual data. Economic Journal, 102, p. 1162-1170, September 1992.
Summers, L. H. Tax policy and international competitiveness. In: Frenkel, Jacob A. (ed.), International aspects of fiscal policies. NBER Conference Report, Chicago: Chicago University Press, 1988, p. 340-375.
Tesar, L. Saving, investment and international capital flows. Journal ofInternational Economics, 31, p. 55-78, 1991.
Wong, D. What do saving-investment relationships tell us about capital mobility?