J. of the Braz. Soc. of Mech. Sci. & Eng. Copyright 2012 by ABCM Special Issue 2012, Vol. XXXIV / 413
Walber Medeiros Lima
[email protected] Instituto Federal do Piauí Coordination of Electromechanical Francisco Urquiza Machado, 462, Meladão 64800-000 Floriano, PI, Brazil
Carlos José de Araújo
[email protected] Universidade Federal de Campina Grande Department of Mechanical Engineering Aprígio Veloso, 822, Bairro Universitário58429-140 Campina Grande, PB, Brazil
Walter Andrés Vermehren
Valenzuela
[email protected] Universidade do Estado do Amazonas Department of Mechanical Engineering Darcy Vargas, 1200, Parque 10 69065-020 Manaus, AM, BrazilJosé Sérgio da Rocha Neto
[email protected] Universidade Federal de Campina Grande Department of Electrical Engineering Aprígio Veloso, 822, Bairro Universitário 58429-140 Campina Grande, PB, BrazilControl of Strain in a Flexible Beam
Using Ni-Ti-Cu Shape Memory Alloy
Wire Actuators
In this paper the development of an experimental test bench to analyze and control the strain of a flexible aluminum beam subjected to external disturbances is described. In the proposed platform, strain-gauges are used to measure the strain of the beam in a single cantilever mode while Ni-Ti-Cu Shape Memory Alloy (SMA) wires are used as force actuators. Data acquisition and control system are implemented with an ADuC microcontroller. The response of the structure in open-loop was used to identify the mathematical model of the system. To find the appropriate controller and to reach the best performance of the system, it was used techniques of direct tuning (pole-zero cancellation) in the identified model. The PI controller has been used to control the strain of the beam for different types of reference signals, as square, sinusoidal and triangular. The frequencies of the reference signals have been varied to observe to which bandwidth the system can respond. Experimental results are used to demonstrate the usefulness of the PI controller in the proposed smart structure.
Keywords: strain, strain-gauge, control, shape memory alloy, actuators
Introduction
Mechanical systems are often subjected to external and internal disturbances, which gives rise to strains and/or undesirable mechanical vibrations putting at risk the structural integrity of these systems. The problems involving strain and/or vibrations in structural systems may be solved by employing conventional control techniques such as those used with conventional actuators (electrical, hydraulic and pneumatic). These actuators find it difficult to generate sufficient power when their sizes and weights are somehow reduced. However, non-conventional actuators, such as the shape memory alloys (SMA) have become a highly attractive alternative to conventional actuators. This is mostly due to its unique capacity of recovering plastic strains, a quality most useful in generating greater forces and greater displacements, mainly when low frequencies are required (Lima et al., 2007).
Some applications carry out an on-off control when using SMA actuators (Khidir et al., 2007). For more complex applications, one is advised to implement control techniques capable of controlling the SMA actuator's force and temperature so as to secure better performance and more stability. The lack of an accurate control technique is one the factors that most frequently impede a great number of actuators from being employed.
Song and Ma (2007) points towards the viability of using 2 (two) SMA wires in order to control an aircraft flap (one wire to move the flap upwards, the other to move it downwards) by means of a robust non-linear controller in place of the conventional actuators.
Khidir et al. (2007) have demonstrated that it is possible to use SMA wires along a flexible beam, dividing it into segments placed along the beam at equal distance from one another so as to make possible to establish a linear movement by means of an on-off control.
Moallem and Lu (2005) demonstrate the viability of using SMA wires for non-linear control of force so as to handle the position of the flexible beam by using a linearized feedback by means of the non-linear system theory.
This work describes the development of an experimental test bench to measure both the control and the strain of a flexible aluminum beam that has been incorporated to the system and on which some static mechanical force and external disturbances stemming from an electro-dynamic exciter have been applied. On the developed platform, electrical resistance extensometers (strain gauges) were employed to measure beam strains. Wires made from a Ni-Ti-Cu SMA were used as power (force) actuators. Both data acquisition and the system control were developed on a microprocessed unit based on an Aduc microcontroller. An open loop response was used to identify the system's mathematical model. In order to find the ideal controller and obtain the best performance possible for the system, the technique known as direct tuning (pole-zero cancellation) was used in the identified model. A PI controller was used in order to control the strain of the beam in a variety of reference signals such as quadratic and triangular signals, where the frequency was changed to identify the bandwidth to which the system responds.
Experimental Procedure
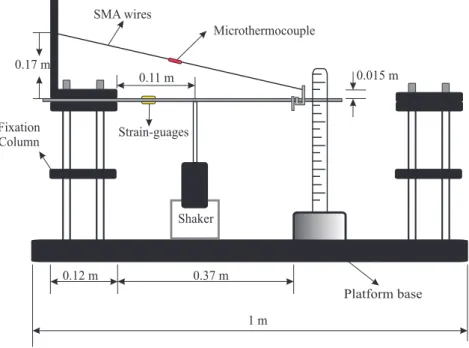
Figure 1 shows a schema of the experimental platform developed in order to apply the strain control on a flexible beam that has been submitted to low frequency external disturbance.
the beam strain. Two Ni-Ti-Cu SMA wires, measuring 0.515 m in length and 0.29 mm in diameter, were utilized to act as force actuators. These SMA wires were supplied by Advanced Materials Technologies Inc. (Belgium) and heat treated at 425oC for 1 hour.
After this treatment, transformation temperatures measured by electrical resistance changes as a function of temperature were Mf
= 31°C, Ms = 39.5°C, As = 46°C and Af = 59°C, with a small
thermal hysteresis of 18°C. Considering that room temperature is about 27°C, there is a complete phase transformation of the wire actuators during cycling. The relation between the stress and temperature of these wires can be found in a previous work (De Araujo et al., 2001).
A micro-thermocouple (K type) with a diameter of the order of 100 µm was used to measure the temperature on the SMA wires during the tests with experimental set-up showed in Fig. 1. The thermocouple has been installed at the center of the wire length using an epoxy adhesive. Then, temperature measures are monitored just as a reference, due to bonding and also to the fact that the wire length is too long. Using resistive heating by Joule effect, the percentage of strain recovery of these wires is of the order of 4.5%
for applied stresses between 125 MPa and 250 MPa (De Araújo, 1999; De Araújo and Morin, 1999).
An ET-132 shaker from the Labworks Inc. was employed to create a low frequency external disturbance on the flexible beam. A measurement electrical circuit was designed for obtaining the strain value on the beam when some static load P is manually applied to the free end of the beam by a single dead weight. In this investigation the P load was fixed as 7 N. This circuit uses a Wheatstone bridge with two strain gauges along with two electrical resistances of 350 and 315 Ω, respectively. The bridge output signal travels through a conditioning circuit made up of a high precision instrumentation amplifier, designed to amplify low-level signals, and a low-pass filter to eliminate any undesirable components that may come from the signal being verified. A driver circuit was also introduced to control SMA wires by means of a PWM signal, which controls the output voltage from the feeding source used to regulate the resistive heating from the SMA wires. Finally, a circuit to measure temperature was installed in order to read the SMA wires temperatures. For this circuit was used an instrumentation amplifier with a cool-joint compensator to the thermocouple on a monolithic micro-plate (Lima et al., 2008, 2009).
Figure 1. Schematic diagram of the developed experimental set-up.
Model Identification
In order to develop and identify the mathematical model for the system shown in Fig. 1 with a 7 N static mechanical load applied to the free end of the beam, an open loop control system was used, as illustrated in Fig. 2.
Figure 2. Block diagram of the open loop control system.
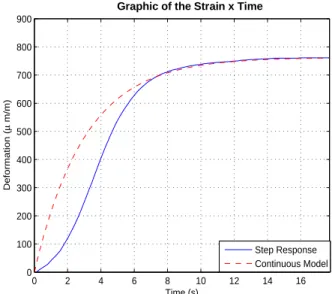
Figure 3 exhibits the response for the open loop control system. This was obtained by applying the voltage of 6.5 V on the SMA wire by means of a feeding source that was connected to the driver
circuit with a PWM signal of 100% (U(t)). This electric voltage produces a current of approximately 1.14 A, leading the SMA wires to warm up as a result of the resistive heating by Joule effect. This made the wires to contract, creating a deflection of 0.065 m on the built-in beam, which corresponded to a strain of 763 µm/m on the beam (Y(t)).
The acquisition and control of data are implemented on a microprocessed unit based on the AduC microcontroller, together with a computer that runs the LabVIEW software that allows us to visualize the measurements in a graphic interface with a sampling time of approximately 0.214 s.
The model identification, as derived from the input and output data of the open loop system control, was carried out by means of the MatLab ident function, which led to a first order continuous model, as defined by Eq. (1). Figure 3 shows the expected output of the model with a sampling time of 0.156 s.
1 m 0.37 m Strain-guages
Platform base Fixation
Column
SMA wires
Microthermocouple 0.17 m
0.11 m 0.015 m
Shaker
0.12 m
Plant
(Beam + SMA)
J. of the Braz. Soc. of Mech. Sci. & Eng. Copyright 2012 by ABCM Special Issue 2012, Vol. XXXIV / 415 3.04s
1 7.63 G(s)
+
= (1)
The Controller’s Design
As to the designed model and the use of the direct tuning technique (pole-zero cancellation), the choice of the Proportional-Integral (PI) controller seems to be the most appropriate for the perfect performance of the system (Chau, 2002). Figure 4 shows the
control system block diagram in closed loop for which the system input is R(t), which is the reference value for the beam strain. Y(t) represents the present output of the system, which corresponds to the value of strain on the beam, where the strain gauges have been installed. E(t) represents the error and corresponds to the difference between Y(t) and R(t). U(t) is the control variable generated by the PI controller which corresponds to a duty cycle value.
Figure 3. Response of the open loop system control to a voltage of 6.5 V applied on the SMA wire.
Figure 4. Block diagram for the closed loop system control.
Control action uses the transfer function Gc(s), defined by Eq.
(2) for the PI controller, where Kp (Proportional Gain) and Ti
(Integrative Time) represent the controller's parameters. These parameters have been calculated by using the direct tuning technique and by taking into account, as the design main parameter, the time constant of the system in closed loop, which equals to 0.32 s. In this way, the following values were obtained: Kp = 1.25 and Ti = 3.04.
) s T
1 + (1 K = (s) G
i p
c (2)
In order to facilitate programming on the microprocessed unit, the PI controller was recursively discretized. This implies that the calculation of the control at an instant u(K) rests upon a previous instant value u(k-1) added to the corrector’s terms as defined in Eq. (3). The term u(K) represents the controller's output signal with a sample delay, whereas e(k) is the system's error signal; e(k-1) represents the error signal with a sample delay; and To corresponds
to the sampling time of the system.
1)
-)e(k
T
T
-(1
K
-e(k)
K
+
1)
-u(k
=
u(k)
i 0 p
p (3)
0 2 4 6 8 10 12 14 16
0 100 200 300 400 500 600 700 800 900
Time (s)
Deformation (
µ
m/m)
Graphic of the Deformation x Time
Step Response Continuous Model
Strain Measurement
Board
Graphic of the Strain x Time
Figure 5. Behavior of strain, current, error and temperature for a squared reference of 70 mHz in the absence of external disturbances.
Figure 6. Behavior of strain, current, error and temperature for a squared reference of 90 mHz in the absence of external disturbance.
Results and Discussions
On a closed loop control system for a PI strain control, two experiments were carried out with a force of 7 N being applied to the furthest point of the beam. The first experiment had the purpose of controlling strain on the beam with a squared, sinusoidal and triangular reference signal, by varying the frequencies so as to observe the bandwidth for which the system responds. The second experiment was a repetition of the first with the added external disturbance on the control system caused by an electro-dynamic shaker as shown in Fig. 1.
Figures 5 and 6 show the results of the control system behavior without external disturbance on a squared reference signal of 70 and 90 mHz, respectively. During these tests, it was observed a beam strain varying from 75 to 580 µm/m. To attain these strain values,
Figs. 5 and 6 show an ascending and descending time of about 5 s. By varying the frequency of reference signal, one can see that the control action worked properly up to a frequency of 90 mHz, revealing a maximum error of about 5% and 2%, when the squared reference presented extreme strains corresponding to 75 and 580 µ m/m, respectively. The errors peaks shown in these figures occur because of intense variations in beam position imposed by the squared reference signal. The value of the electric current on the SMA wires varied from 0 to 1.1 A, causing a temperature variation from 25 to 60oC, which is sufficient to trigger the actuators.
Figures 7 and 8 show the performance of the control system behavior without external disturbance for a signal of sinusoidal reference of 40 and 90 mHz, respectively, with a strain beam
5 10 15 20 25 30 35 40 45 50 55 60
0 100 200 300 400 500 600
Graphic of the Deformation in a Flexible Beam x Time
Deformation (
µ
m/m)
Time (s)
Signal Reference
5 10 15 20 25 30 35 40 45 50 55 60
0 100 200 300 400 500 600 700
Graphic of the Deformation Error in a Flexible Beam x Time
Error (%)
Time (s)
5 10 15 20 25 30 35 40 45 50 55 60
0 0.2 0.4 0.6 0.8 1
Graphic of the Current in a SMA Wires x Time
Current (A)
Time (s)
5 10 15 20 25 30 35 40 45 50 55 60
20 30 40 50 60
Graphic of the Temperature in a SMA Wires x Time
Temperature (ºC)
Time (s)
5 10 15 20 25 30 35 40 45
0 100 200 300 400 500 600
Graphic of the Deformation in a Flexible Beam x Time
Deformation (
µ
m/m)
Time (s)
Signal Reference
5 10 15 20 25 30 35 40 45
0 100 200 300 400 500 600 700
Graphic of the Deformation Error in a Flexible Beam x Time
Error (%)
Time (s)
5 10 15 20 25 30 35 40 45
0 0.2 0.4 0.6 0.8 1 1.2
Graphic of the Current in a SMA Wires x Time
Current (A)
Time (s)
5 10 15 20 25 30 35 40 45
20 30 40 50 60
Graphic of the Temperature in a SMA Wires x Time
Temperature (ºC)
Time (s) Strain Strain
J. of the Braz. Soc. of Mech. Sci. & Eng. Copyright 2012 by ABCM Special Issue 2012, Vol. XXXIV / 417
varying from 75 to 580 µm/m. Specifically for these two frequencies, one notices that the control action works well, revealing a maximum error of around 2% on external strains, reaching its peak of 10% at the point of cycle inversion, when the sinusoidal reference value reaches 75 µm/m. For a frequency of 90 mHz, the maximum
error at the inversion point reached 45%. The value of the electric current on the SMA wire varied from 0 to 1.1 A, causing a temperature variation from 25 to 60oC, which is sufficient to trigger
the actuators.
Figure 7. Behavior of strain, current, error and temperature for a sinusoidal reference of 40 mHz in the absence of external disturbance.
Figure 8. Behavior of strain, current, error and temperature for a sinusoidal reference of 90 mHz in the absence of external disturbance.
Figures 9 and 10 show the results of the control system behavior without external disturbance for a signal of triangular reference of 10 and 90 mHz, respectively, with a strain beam varying from 75 to 580 µ m/m. On altering the reference signal, one can see that the control action performed well up to a frequency of 10 mHz, presenting a maximum error of around 4%, and reaching its peak of 10% at the inversion point of the
cycle, when the reference value reaches 75 µm/m. For a frequency of 90 mHz, the maximum error at the point of the cycle inversion, when the reference value reaches 75 µ m/m, may go up to 50%. The value of the electric current on the SMA wire varied from 0 to 1.1 A, causing a temperature variation from 27 to 65oC, which is sufficient to trigger the actuators.
10 20 30 40 50 60 70
0 100 200 300 400 500 600
Graphic of the Deformation in a Flexible Beam x Time
Deformation (
µ
m/m)
Time (s)
10 20 30 40 50 60 70
0 20 40 60 80 100
Graphic of the Deformation Error in a Flexible Beam x Time
Error (%)
Time (s)
10 20 30 40 50 60 70
0 0.2 0.4 0.6 0.8 1 1.2
Graphic of the Current in a SMA Wires x Time
Current (A)
Time (s)
10 20 30 40 50 60 70
20 30 40 50 60
Graphic of the Temperature in a SMA Wires x Time
Temperature (ºC)
Time (s)
Signal Reference
5 10 15 20 25 30 35 40 45
0 100 200 300 400 500 600
Graphic of the Deformation in a Flexible Beam x Time
Deformation (
µ
m/m)
Time (s)
5 10 15 20 25 30 35 40 45
0 20 40 60 80 100
Graphic of the Deformation Error in a Flexible Beam x Time
Error (%)
Time (s)
5 10 15 20 25 30 35 40 45
0 0.2 0.4 0.6 0.8 1 1.2
Graphic of the Current in a SMA Wires x Time
Current (A)
Time (s)
5 10 15 20 25 30 35 40 45
20 30 40 50 60
Graphic of the Temperature in a SMA Wires x Time
Temperature (ºC)
Time (s)
Signal Reference
Strain Strain
The set of results shown in Figs. 5-10 show a symmetrical behavior for strain of the flexible beam during heating and cooling of the actuator wires, for all activation waveforms employed. For the triangular and sinusoidal waveforms, this is due to the fact that heating and cooling is produced slowly, controlled through the increment and decrement of the electrical current during activation at low frequencies. For square waves, involving current pulses as shown in Figs. 5 and 6, a non-symmetrical behavior could be
expected due to different time constants of the heating and cooling phases of the wires, normally verified in SMA. However, even in this case, the response in strain of the flexible beam remained symmetrical. This behavior can be attributed to the reduced thermal hysteresis of the Ni-Ti-Cu SMA compared with those of Ni-Ti, and the large length of the actuator wire, allowing faster responses on cooling.
Figure 9. Behavior of strain, current, error and temperature for a triangular reference of 10 mHz in the absence of external disturbance.
Figure 10. Behavior of strain, current, error and temperature for a triangular reference of 90 mHz in the absence of external disturbance.
The time delay of the actuator can be seen from its response to a square wave excitation. From Fig. 5, for a frequency of 70 mHz, this time is about 4 seconds. Increasing this frequency to 90 mHz, as shown in Fig. 6, this time rises to approximately 6 seconds. For
other reference signals, the PI control system can compensate for this effect.
Figure 11 shows the results of the control system behavior with external disturbances produced by an electro-dynamic shaker at a
50 100 150 200 250
0 100 200 300 400 500 600
Graphic of the Deformation in a Flexible Beam x Time
Deformation (
µ
m/m)
Time (s)
50 100 150 200 250
0 20 40 60 80 100
Graphic of the Deformation Error in a Flexible Beam x Time
Error (%)
Time (s)
50 100 150 200 250
0 0.2 0.4 0.6 0.8 1 1.2
Graphic of the Current in a SMA Wires x Time
Current (A)
Time (s)
50 100 150 200 250
20 30 40 50 60 70
Graphic of the Temperature in a SMA Wires x Time
Temperature (ºC)
Time (s)
Signal Reference
15 20 25 30 35 40 45 50
0 100 200 300 400 500 600
Graphic of the Deformation in a Flexible Beam x Time
Deformation (
µ
m/m)
Time (s) 15 20 25 30 35 40 45 50
0 20 40 60 80 100
Graphic of the Deformation Error in a Flexible Beam x Time
Error (%)
Time (s)
15 20 25 30 35 40 45 50
0 0.2 0.4 0.6 0.8 1 1.2
Graphic of the Current in a SMA Wires x Time
Current (A)
Time (s)
15 20 25 30 35 40 45 50
20 30 40 50 60
Graphic of the Temperature in a SMA Wires x Time
Temperature (ºC)
Time (s)
Signal Reference
Strain Strain
J. of the Braz. Soc. of Mech. Sci. & Eng. Copyright 2012 by ABCM Special Issue 2012, Vol. XXXIV / 419
frequency of 3.5 mHz, for a signal of squared reference of 20 mHz, with the strain of the beam varying from 75 to 580 µm/m. Here one sees an ascending and descending time of around 6 s. It is worth noticing that the flexible beam is only submitted to an external disturbance when it reaches a strain value smaller than 200 µm/m, and that the external disturbance does not interfere in the action of the PI controller, revealing a maximum error of about 30% and 2% when the
squared reference presented strains of 75 µm/m and 580 µm/m, respectively. However, due to the necessity of following the reference require the application of pulses of electric current, the error becomes large out of the positions corresponding to the extreme strains. The value of the electric current on the SMA wire varied from 0 to 1.1 A, causing a temperature variation from 25 to 65oC, which is sufficient to trigger the actuators.
Figure 11. Behavior of strain, current, error and temperature for a squared reference of 20 mHz in the presence of an external disturbance of 3.5 mHz.
Figure 12. Behavior of strain, current, error and temperature for a sinusoidal reference of 20 mHz in the presence of an external disturbance of 3.5 mHz.
10 20 30 40 50 60 70 80 90 100 110
0 100 200 300 400 500 600 700
Graphic of the Deformation Error in a Flexible Beam x Time
Error (%)
Time (s)
10 20 30 40 50 60 70 80 90 100 110
0 0.2 0.4 0.6 0.8 1 1.2
Graphic of the Current in a SMA Wires x Time
Current (A)
Time (s)
10 20 30 40 50 60 70 80 90 100 110
20 30 40 50 60 70
Graphic of the Temperature in a SMA Wires x Time
Temperature (ºC)
Time (s)
10 20 30 40 50 60 70 80 90 100 110
0 100 200 300 400 500 600
Graphic of the Deformation in a Flexible Beam x Time
Deformation (
µ
m/m)
Time (s)
Signal Reference
20 40 60 80 100 120 140
0 100 200 300 400 500 600
Graphic of the Deformation in a Flexible Beam x Time
Deformation (
µ
m/m)
Time (s)
20 40 60 80 100 120 140
0 20 40 60 80 100
Graphic of the Deformation Error in a Flexible Beam x Time
Error (%)
Time (s)
20 40 60 80 100 120 140
0 0.2 0.4 0.6 0.8 1 1.2
Graphic of the Current in a SMA Wires x Time
Current (A)
Time (s)
20 40 60 80 100 120 140
20 30 40 50 60 70
Graphic of the Temperature in a SMA Wires x Time
Temperature (ºC)
Time (s)
Signal Reference
Strain Strain
Figure 13. Strain behavior, current, error and temperature for a triangular reference of 20 mHz in the presence of an external disturbance of 3.5 mHz.
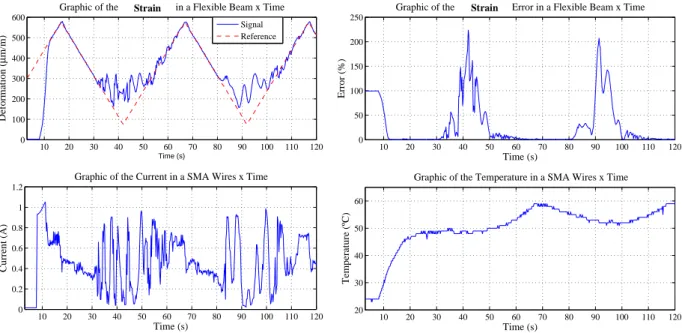
Figures 12 and 13 show the results of the control system behavior with an external disturbance, caused by the electro-dynamic shaker at a frequency of 3.5 mHz, for a signal of sinusoidal and triangular reference of 20 mHz, respectively, with a strain beam varying from 75 to 580 µm/m. Here one can see that the flexible beam can only go through an external disturbance when it reaches a strain smaller than 200 µm/m, and that the external disturbance does
not interfere in the action of the PI controller; thus presenting a maximum error of around 2% on external strains, and reaching its peak of 40% at the inversion point of the cycle, when the reference value reaches 75 µm/m. The value of the electric current on the SMA wire varied from 0 to 1.1 A, causing a temperature variation from 25 to 65oC, which is sufficient to trigger the actuators.
Figure 14. Behavior of strain, current, error and temperature for a sinusoidal reference of 20 mHz in the presence of an external disturbance of 4.5 mHz.
20 40 60 80 100 120 140
0 100 200 300 400 500 600
Graphic of the Deformation in a Flexible Beam x Time
Deformation (
µ
m/m)
Time (s)
20 40 60 80 100 120 140
0 20 40 60 80 100
Graphic of the Deformation Error in a Flexible Beam x Time
Error (%)
Time (s)
20 40 60 80 100 120 140
0 0.2 0.4 0.6 0.8 1 1.2
Graphic of the Current in a SMA Wires x Time
Current (A)
Time (s)
20 40 60 80 100 120 140
20 30 40 50 60 70
Graphic of the Temperature in a SMA Wires x Time
Temperature (ºC)
Time (s)
Signal Reference
10 20 30 40 50 60 70 80 90 100 110
0 100 200 300 400 500 600
Graphic of the Deformation in a Flexible Beam x Time
Deformation (
µ
m/m)
Time (s)
10 20 30 40 50 60 70 80 90 100 110
0 50 100 150 200 250 300
Graphic of the Deformation Error in a Flexible Beam x Time
Error (%)
Time (s)
10 20 30 40 50 60 70 80 90 100 110
0 0.2 0.4 0.6 0.8 1 1.2
Graphic of the Current in a SMA Wires x Time
Current (A)
Time (s)
10 20 30 40 50 60 70 80 90 100 110
20 30 40 50 60 70
Graphic of the Temperature in a SMA Wires x Time
Temperature (ºC)
Time (s)
Signal Reference
Strain Strain
J. of the Braz. Soc. of Mech. Sci. & Eng. Copyright 2012 by ABCM Special Issue 2012, Vol. XXXIV / 421
Figure 15. Behavior of strain, current, error and temperature for a triangular reference of 20 mHz in the presence of an external disturbance of 4.5 mHz.
Figures 14 and 15 show the results of the control system behavior with an external disturbance, caused by the electro-dynamic shaker at a frequency of 4.5 mHz, for a signal of sinusoidal and triangular reference of 20 mHz, respectively, with a strain beam varying from 75 to 580 µm/m. Here one can see that the flexible beam can only go through an external disturbance when it reaches a strain smaller than 200 µm/m. In this case, unlike the former to which the disturbance is introduced with a lower frequency (3.5 mHz), the external disturbance interferes in the action of the PI controller due to its frequency slightly higher (4.5 mHz). Thus, it was measured a maximum error of around 3% on external strains, and reaching its peak of 200% at the inversion point of the cycle, when the reference value reaches 75 µm/m. Similar to all previous cases, the value of the electric current on the SMA wire varied from 0 to 1.1 A, causing a temperature variation from 25 to 65oC, which is sufficient to trigger the actuators.
Al the graphs show that the wires have a tendency to heat up during the cycles. It is true that this is reverted into residual stress in the actuator wires. However, the stiffness of the flexible beam reacting on the wires (bias spring) is sufficient to prevent a residual tip position of the beam during cycling, except in cases where the disturbance is introduced at higher frequencies, as shown in Figs. 14 and 15.
One of the potential practical uses of the strategy proposed seems to be position control. Thus, it should be interesting to use, as output response, the tip displacement instead of strain, since the latter, alone, is not a relevant dynamic response in this kind of application. On the other hand, the continuous measurement of the tip deflection of the beam requires the use of displacement sensors (LVDT or laser), which seems impractical in a real application. Thus, a hybrid solution that involves a simple strategy for measuring strain, as used in this work, and the calculation of the tip deflection by an appropriate mathematical equation seems to be the best alternative.
Conclusions
In this work an experimental platform was successfully developed to measure and control strains on a simply supported flexible aluminum beam that has been submitted to a static mechanical load of 7 N. This experimental set-up enabled to create a
PI controller of strain from a first order model obtained from the response of the control system in open loop, by the utilization of the direct tuning technique (pole-zero cancellation).
In general, it was found that the performance of the PI controller depends on the type of reference waveform to the movement of the flexible beam, the frequency of the reference signal and the frequency of the disturbance.
The control is particularly difficult to strain squared waves with frequencies of 70 and 90 mHz, even without disturbance. This occurs due to abrupt changes of movement that are imposed at the instant the beam reaches the reference positions (75 and 580 µm/m). For this type of wave, when the reference signal frequency is lower, of the order of 20 mHz, the developed PI control system operates well, even in the presence of the disturbance, so that the steady state error in the position corresponding to 580 µm/m tends to zero.
For other reference signals, triangular and sinusoidal, the control action is favored by the absence of abrupt changes of position. For these smoother motion waves of reference, the controller just has decreased its performance when the disturbance is introduced at a frequency of 4.5 mHz.
Acknowledgements
The authors thank the National Science and Technology Institute (INCT) of Smart Structures in Engineering, CAPES (Coordination of Improvement of Higher Education), CNPq (National Council for Scientific and Technological Development) and FAPEAM (Foundation for the Support of Research in State of Amazonas) Brazilian agencies for funding this research.
References
Chau, P.C., 2002, “Chemical Process Control: A First Course with MATLAB”, ed. Cambridge University Press.
De Araújo, C.J., 1999, “Comportement cyclique de fils en alliage à mémoire de forme Ti-Ni-Cu: analyse electro-thermomécanique, dégradation et fatigue par cyclage thermique sous contrainte”, Thèse de Doctorat, INSA de Lyon, France, 177 p. (In French).
De Araújo, C.J. and Morin, M., 1999, “Comparação entre as respostas elétrica e térmica de fios atuadores com efeito memória de forma”,
10 20 30 40 50 60 70 80 90 100 110 120
0 100 200 300 400 500 600
Graphic of the Deformation in a Flexible Beam x Time
Deformation (
µ
m/m)
Time (s)
10 20 30 40 50 60 70 80 90 100 110 120
0 50 100 150 200 250
Graphic of the Deformation Error in a Flexible Beam x Time
Error (%)
Time (s)
10 20 30 40 50 60 70 80 90 100 110 120
0 0.2 0.4 0.6 0.8 1 1.2
Graphic of the Current in a SMA Wires x Time
Current (A)
Time (s)
10 20 30 40 50 60 70 80 90 100 110 120
20 30 40 50 60
Graphic of the Temperature in a SMA Wires x Time
Temperature (ºC)
Time (s)
Signal Reference
Proceedings of 15th Brazilian Congress of Mechanical Engineering (COBEM 99), Águas de Lindóia, SP, Brasil, pp. 1-9 (In Portuguese).
De Araújo, C.J., Gonzalez, C.H., Morin, M., Guénin, 2001, “Influence of the Mechanical Loading History on the Stress Assisted Two Way Memory Effect in a Ti-Ni-Cu Alloy”, Materials Research, Vol. 4, No. 3, pp. 181-188.
Khidir, E.A., Mohamed, N.A., Nor, M.J.M. and Mustafa, M.M., 2007, “A new concept of a linear smart actuator”, Sensors and Actuators A, Vol. 135, pp. 244-249.
Lima, W.M., de Araújo, C.J., Valenzuela, W.A.V., Lima, A.M.N. and Rocha Neto, J.S., 2008, “Medidas de Resistência Elétrica em Atuadores de Ligas com Memória de Forma Para o Controle de Posição de Sistemas Flexíveis − Aplicação ao Caso de Uma Viga Esbelta Mecânica”, CONEM 2008 − V Congresso Nacional de Engenharia mecânica, Salvador, BA, Brasil (In Portuguese).
Lima, W.M., de Araújo, C.J., Valenzuela, W.A.V. and da Rocha Neto, J.S., 2009, “Electrical resistance measurements in shape memory alloy actuators for the position control of flexible systems - application to the case of an aluminum beam”, SMART 2009 - Smart Materials and Structures, Lisboa, Portugal.
Lima, W.M., da Rocha Neto, J.S., Lima, A.M.N., de Araújo, C.J. and Valenzuela, W.A.V., 2007, “Measurement and control of the deformation in a flexible beam using shape memory alloy”, COBEM 2007 - 19th International Congress of Mechanical Engineering, Brasília, DF, Brasil.
Moallem, M. and J. Lu, 2005, “Application of Shape Memory Alloy Actuators for Flexure Control: Theory and Experiments”, IEEE/ASME
Transactions on Mechatronics, Vol. 10, No. 5, pp. 495-501.