ANALYSIS MODEL FOR FORECASTING EXTREME TEMPERATURE
USING REFINED RANK SET PAIR
by
Ling-Xia QIAOa, Yin ZHANGa, Wan-Ying MAa, Xiao-Hua YANGb*, and Jian-Qiang LIc
a
School of Mathematical Sciences, Beijing Normal University, Beijing, China
b
State Key Laboratory of Water Environment Simulation, School of Environment, Beijing Normal University, Beijing, China
c
Water Resources and Hydropower Planning and Design General Institute, MWR, Beijing, China
Original scientific paper DOI: 10.2298/TSCI1305369Q
In order to improve the precision of forecasting extreme temperature time series, a refined rank set pair analysis model with a refined rank transformation func-tion is proposed to improve precision of its predicfunc-tion. The measured values of the annual highest temperature of two China’s cities, Taiyuan and Shijiazhuang, in July are taken to examine the performance of a refined rank set pair model. Key words: extreme temperature, prediction, time series, refined rank set pair
analysis model, robust analysis, error analysis
Introduction
Temperature has a close relationship with heat circulation and water flow in the en-vironment, and thus it plays an important role in human’s daily life [1, 2] and it is important to forecast extreme temperature accurately [3]. Since many factors attribute a lot to the tem-perature change, the accurate prediction of extreme temtem-perature is faced with a high degree of scientific uncertainty, which traditional deterministic mathematical model cannot solve per-fectly. Numerical simulation method can solve the problem better [3-5].
In recent years, artificial neural network (ANN) algorithms are widely used to deal with forecasting meteorological objects [6]. Based on the GA and particle swarm algorithm, Yang designed the back propagation (BP) neural networks to establish the multi-factor time series forecasting model [7]. At the same time, set pair analysis (SPA) model which is easy to operate and gives good prediction results is also popular in meteorological forecast field [4, 5]. Jin applied the set pair analysis method to the set pair analysis based on similarity forecast model of water resources change (SPA-SF), and the application results showed that the statis-tic and physical concepts of SPA-SF were distinct and its precision was high [8].
However, SPA model does not provide a unified standard of quantifying the set element symbols, while the prediction results are probably correlative with it. Using the simi-larity of time series as rank and using the rank set pair analysis [6-9] to transform the rank of set’s elements in the R-SPA model, the results are proved to be better. Nonetheless, three as-pects [8] given by the connection degree [9] in the R-SPA model have the same weight. Therefore the coefficients cannot reflect all the information about the difference between sets, which may cause non-negligible deviation of predicted value.
––––––––––––––
To overcome the defects of the models mentioned above, refined rank set pair analy-sis (RRSPA) model is proposed in the paper. First, the three-element connection number is extended to multivariate connection number, and linear function is chosen for rank transfor-mation function f, which transforms the elements based on the rank and helps avoid choosing the quantization standard. The numerical size and proportion of f’s value is corresponding to that of elements in the original set, describing the change trend of elements in the set nicely. Then linear function is also applied to the uncertain coefficient function, which gives a precise description of weight. At last, comparing RRSPA model with traditional R-SPA model, BP model, and LR model, we get the conclusion.
Refined rank set pair analysis model
The procedure of the establishment of this RRSPA model is as follows.
Step 1. Data processing
Considering time series x1, x2,…, xn, we assume that xt has dependence with the front T history numbers, namely xt–1, xt–2,…, xt–T. Move the time series, and we can get history sets A1, A2,…, An–T, and the current set B. Every set has the size of T. History set Ak(k = 1, 2,…, n–T) is corresponding to a subsequent value xT+i.
Usually, because of weak dependence of the time series, the size of history set and current set is an integer from 4-6 [6].
Step 2. Determination of refined rank transformation function
The traditional rank transformation of a set [6] is ordering the elements of the set from 1 to T according to the rank they belong to. But there exists a defect in this transforma-tion, as it does not make a refined treatment on the size and multiple relationships of the ele-ments in a set. To overcome this defect of the traditional rank transformation, refined rank transformation function f is proposed.
Similar to the traditional rank transformation, the refined rank transformation func-tion must confirm that the minimum of a set turns out to be 1, maximum is T, and the rest is transformed according to the proportion.
Let f(ai) denotes the transformation result of the ith element ai in Ak, and f(bi) de-notes the transformation result of the ith element bi in B. Since the linear function is trans-formed according to numerical proportion, linear function is chosen for f:
min( ) min( )
( ) ( 1) 1, ( ) ( 1) 1
max( ) min( ) max( ) min( )
i k i
i i
k k
a A b B
f a T f b T
A A B B
− −
= − + = − +
− − (1)
After a simple verification, the refined rank transformation function does guarantee that the transformation result of minimum in a set is 1, while maximum is T.
Step 3. Determination of difference function
For set pairs (Ak, B), k = 1, 2,… n–T, function d(ai, bi) should describe the differenc-es between ai ∈ Ak and bi ∈ B, and thus the absolute value of the difference is a good choice. The d(ai, bi) is:
( , )i i | ( )i ( ) |, ( , )i i i ( k, )
d a b = f a − f b a b ∈ A B (2)
It is easy to be observed that the co-domain of d(ai, bi) is [0, T – 1].
If d = 0, we consider that the pair (ai, bi) is identical. If d = T – 1, we consider that the pair (ai, bi) is contrary. If d≠ 0, T – 1, we consider that the pair (ai, bi) is discrepant.
In order to incorporate the traditional SPA theory, the definition of difference uncer-tain coefficient function c(d) must meet the three following conditions:
(1) When d = 0, which indicates pair (ai, bi) is identical, c(d) = 1. (2) When d = T – 1, which indicates pair (ai, bi) is contrary, c(d) = –1.
(3) When d≠ 0, T – 1, which indicates pair (ai, bi) is discrepant, c(d) ∈ (–1, 1).
Step 4. Determination of difference uncertain coefficient function and connection degree based on SPA
In order to confirm that the definition of difference uncertain coefficient function
c(d) meets the three conditions based on SPA theory, the linear function is also a good choice:
2
( ) 1
1
c d d
T
= − +
− (3)
Therefore, the connection degree of (Ak,B) can be calculated:
[
]
( , ) ( , )
1
( , )
i i
A B i i
a b A B
U c d a b
N
−
∈
=
∑
(4)Step 5. Determination of similar history sets and prediction
According to the connection degree maximum principle, some Ak similar to B are chosen from all the history sets. The way to choose history set Ak is given:
{ | arg max{ |1 }}
j
A B
K = k k= U − ≤ ≤ −j n T (5)
Let m denote the size of K, and K can be expressed:
1 2
{ , m}
K= k k "k (6)
Thus the prediction value x'n+1 of xn+1 is expressed:
1
1
1 '
j
m
n j T k
j
x w x
m
+ +
=
=
∑
(7)where wi denotes the ratio of mean of elements in B to mean of elements in Akj.
Applications in extreme temperature
Case 1
Study area and data description
The RRSPA model is applied to predict the highest temperature time series observed at Taiyuan station N37° 51', E112° 33') in China, in July 1951-2010.
We obtain the time series x1, x2,…, xn (n = 45). Considering the weak dependence in average temperature series, the value of T, which should not be too large or too small, is taken as 6 in the paper. According to this, the history sets are A1, A2,…, An–6.
Predicting the highest temperature in a year, such as the year 2000, we take the front
T years (1994-1999) as set B. When predicting the highest temperature of July in the next year 2001, we assume the data in 1995-2000 is known.
The prediction results and analysis
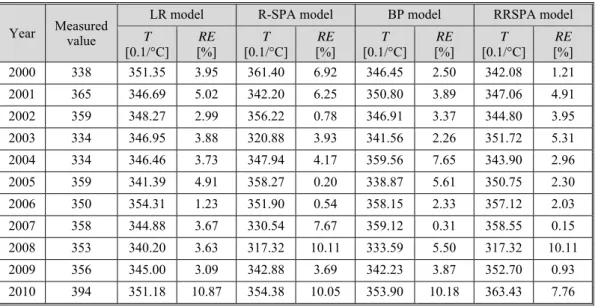
Prediction results of the highest temperature in Taiyuan in July 2000-2010 and the corresponding relative error (RE) are presented in tab. 1.
Table 1. Predictions of the highest temperature in Taiyuan and relative errors
To verify the prediction effect of RRSPA model, we take traditional R-SPA model, LR model, and BP model to make comparisons. To be the same, the temperature data in 1951-1994 is used as trained sets in BP model [6] and the data of 2000-2010 are tested sets, with 500 trained times and the study rate 0.3.
Compared with the results of BP model, R-SPA model, and RRSPA model, RRSPA model has the smallest deviation with the measured value in those 11 years in general. The number of relative errors below 3% in three models is, respectively, 3, 4, and 7. According to those points, RRSPA model has a better effect.
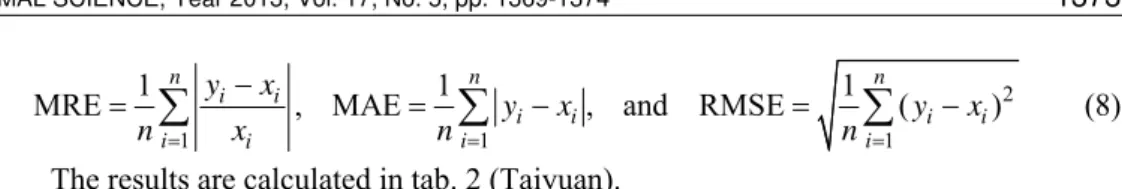
The precision of prediction is evaluated by three measurement indices in this paper, namely the mean relative error (MRE), mean absolute error (MAE), and root mean square er-ror (RMSE). The definitions of the three indices can be given as:
Year Measured
value
LR model R-SPA model BP model RRSPA model
T
[0.1/°C]
RE
[%]
T
[0.1/°C]
RE
[%]
T
[0.1/°C]
RE
[%]
T
[0.1/°C]
RE
[%]
2000 338 351.35 3.95 361.40 6.92 346.45 2.50 342.08 1.21
2001 365 346.69 5.02 342.20 6.25 350.80 3.89 347.06 4.91
2002 359 348.27 2.99 356.22 0.78 346.91 3.37 344.80 3.95
2003 334 346.95 3.88 320.88 3.93 341.56 2.26 351.72 5.31
2004 334 346.46 3.73 347.94 4.17 359.56 7.65 343.90 2.96
2005 359 341.39 4.91 358.27 0.20 338.87 5.61 350.75 2.30
2006 350 354.31 1.23 351.90 0.54 358.15 2.33 357.12 2.03
2007 358 344.88 3.67 330.54 7.67 359.12 0.31 358.55 0.15
2008 353 340.20 3.63 317.32 10.11 333.59 5.50 317.32 10.11
2009 356 345.00 3.09 342.88 3.69 342.23 3.87 352.70 0.93
2
1 1 1
1 1 1
MRE , MAE , and RMSE ( )
n n n
i i
i i i i
i i i i
y x
y x y x
n = x n = n =
−
=
∑
=∑
− =∑
− (8)The results are calculated in tab. 2 (Taiyuan).
Table 2 indicates that the MRE of LR, traditional R-SPA model and BP model is, respectively, 4.27%, 4.94%, and 4.31%, while RRSPA model MRE is 3.78%, whose preci-sion is relatively increased by
11.48%, 23.48%, and 12.30%. For the MAE and RMAE, RRSPA model al-so gives the smallest: as for MAE, RRSPA model precision has relative-ly increased by 11.9%, 23.29%, and 12.45%, respectively, compared with that of LR, and R-SPA, BP model; as
for RMAE, RRSPA model precision has relatively increased by 4.05%, 20.58%, and 6.69%, respectively, compared with that of LR, R-SPA, and BP model. They all indicate that RRSPA model is a better choice for prediction.
Case 2
We also apply the same method to predict the highest temperature time series ob-served at Shijiazhuang station (N38°03’, E114°26’) in China in July 2000-2010, known data in 1956-2010. The corresponding measurement indices MRE, MAE, and RMAE of Shijiaz-huang are calculated in tab. 3.
Table 3 indicates that the MRE of LR, traditional R-SPA model and BP, respective-ly, is 6.27%, 6.67%, and 6.11%, while that of RRSPA model is 5.73%, whose precision is al-so relatively increased. For the MAE
and RMAE, the RRSPA model also gives the smallest: as for MAE, RRSPA model precision has relative-ly increased by 4.30%, 10.59%, and 4.20%, respectively, compared with that of LR, R-SPA, and BP model; as for RMAE, RRSPA model precision has relatively increased by 3.42%,
5.91%, and 0.56%, respectively, compared with that of LR, R-SPA, and BP model. Measured indices MAE and RMAE of RRSPA model are both the smallest, which indicates that RRSPA model is a better choice for prediction.
In sum, two cases both indicate that RRSPA model has the best estimation in predic-tion of high temperature, among LR, R-SPA, and BP neural network models.
Conclusions and prospect
A refined R-SPA model is proposed in this paper. The annual highest temperature time series in July of Taiyuan and Shijiazhuang are studied by using the new model. The main conclusions are:
● In the set pair analysis method, we establish a new formula to calculate the connection degree, which makes definition of the connection degree more explicit and simplify the
Table 2. The error analysis in three models in Taiyuan
Models LR
model
R-SPA model
BP model
RRSPA model
MRE (%) 4.27 4.94 4.31 3.78
MAE 15.41 17.69 15.50 13.57
RMAE 18.02 21.77 18.53 17.29
Table 3. The error analysis in three models in Shijiazhuang
Models LR
model
R-SPA model
BP model
RRSPA model
MRE (%) 6.27 6.67 6.11 5.73
MAE 24.8901 26.64 22.86 23.82
calculation. We apply it to RRSPA model. In addition, refined rank transformation func-tion is proposed in this paper. The funcfunc-tion makes a refined treatment on the size and multiple relationships of the elements in a set.
● In the view of error analysis, compared with traditional R-SPA model, RRSPA model gives smaller MRE, MAE, and RMSE. Taking Taiyuan as an example, as for MRE, RRSPA model precision has relatively increased by 11.48%, 23.48%, and 12.30%, re-spectively, compared with that of LR, R-SPA, and BP model; as for MAE, RRSPA model precision has relatively increased by11.9%, 23.29%, and 12.45%, respectively, compared with that of LR, R-SPA, and BP model; as for RMAE, RRSPA model preci-sion has relatively increased by 4.05%, 20.58%, and 6.69%, respectively compared with that of LR, R-SPA, and BP model.
● Since linear function is chosen for both difference uncertain coefficient function c(d) and refined rank transformation function f without putting more information about the prediction background in the RRSPA model, it may give a better result if some optimi-zation algorithms are applied to the RRSPA model.
Acknowledgments
This work was supported by the Project of National Natural Foundation of China (No. 50939001,51079004), the National Basic Research Program of China (No. 2010CB951104), the Funds for Creative Research Groups of China (No.51121003), the Spe-cialized Research Fund for the Doctoral Program of Higher Education (No. 20100003110024), and the Program for Changjiang Scholars and Innovative Research Team in University (No. IRT0809).
References
[1] Bošnjaković, B., Geopolitics of Climate Change: A Review, Thermal Science, 16 (2012), 3, pp. 629-654
[2] Matic, B., et al., Development and Evaluation of the Model for the Surface Pavement Temperature
Pre-diction, Metalurgija, 51 (2012), 3, pp. 329-332
[3] Hippert, H. S., et al., Combining Neural Networks and ARIMA Models for Hourly Temperature
Fore-cast, Proceedings, International Joint Conference, Como, Italy, 2000, Vol. 4, pp. 414-419
[4] Li, W. J., et al., Assessment Model for River Ecology Health Based on Set Pair Analysis and Variable
Fuzzy Set, Journal of Hydraulic Engineering, 42 (2011), 7, pp. 775-782
[5] Liu, F. G., Zuo, Y., The Application of Rank Set Pair Analysis Similar Prediction Model in Futures
Price Forecasting, Proceedings, International Conference, Beijing, 2009, pp. 240-243
[6] Yang, S. S., et al., New Optimal Weight Combination Model for Forecasting Precipitation,
Mathemati-cal Problems in Engineering, 2012 (2012), pp. 1-13, DOI 10.1155/2012/376010
[7] Yang, S. X., Neural Network Forecast under the Organic Hybrid Model of Genetic Algorithm and
Par-ticle Swarm Algorithm, Proceedings,6th International Conference,Hong Kong, China, 2008, Vols. 1-2,
pp. 254-258
[8] Jin, J. L., et al., Set Pair Analysis Based on Similarity Forecast Model of Water Resources, Journal of
Hydroelectric Engineering, 28 (2009), 1, pp. 72-77
[9] Yang, X. H., et al., Nonlinear Optimization Set pair Analysis Model (NOSPAM) for Assessing Water
Resource Renewability, Nonlinear Processes In Geophysics, 18 (2011), 5, pp. 599-607