ISSN 1941-7020
© 2009 Science Publications
Corresponding Author: Doan, H., Department of Chemical Engineering, Ryerson University, 350 Victoria Street, Toronto, On., Canada, M5B 2K3 Tel: (416) 979 5000/ext.6341 Fax: (416) 979 5044
Intermittent Aeration in Biological Treatment of Wastewater
H. Doan and A. Lohi
Department of Chemical Engineering,
Ryerson University, 350 Victoria Street, Toronto, On., Canada, M5B 2K3
Abstract: Problem statement: E-coating process is widely used to provide a protective coating layer on metal parts in the automotive and metal finishing industry. The wastewater from the coating process contains organic compounds that are used in the cleaning, pretreatment and coating steps. Organic pollutants can be removed biologically. In the aerobic biological treatment, water aeration accounts for a significant portion of the total operating cost of the treatment process. Intermittent aeration is thus of benefit since it would reduce the energy consumption in the wastewater treatment. In the present study, wastewater from an electro-coating process was treated biologically using a packed column as an aerator where the wastewater was aerated by a countercurrent air flow. The objective was to obtain an optimum aeration cycle. Approach: Intermittent aeration time was varied at different preset cycles. An operational optimum of the aeration time (or air-water contacting time in the column) was determined from the BOD5 removal after a certain treatment period. For continuous aeration of the
wastewater, the air-liquid contacting time in the column was 52 min for 24 h of treatment. A unit energy consumption for pumping liquid and air, which was defined as the energy consumption per percent BOD5 removed, was used as a criterion to determine the optimum contacting time. Results:
Optimum air-liquid contacting times were found to be about 38, 26 and 22 min for the treatment times of 24, 48 and 72 h, consecutively. This indicates that 27-58% saving on the unit energy consumption can be achieved using intermittent aeration of the wastewater. On the basis of the overall BOD5
removal, 17% and 23% savings in energy were observed with the intermittent aeration as compared to the continuous aeration of the wastewater for 48 and 72 h. Conclusion: The results obtained indicate that an appropriate intermittent aeration cycle can bring about a substantial energy saving while an adequate treatment of wastewater is maintained.
Key words: BOD, cyclic aeration, wastewater, packed column, energy conservation
INTRODUCTION
Wastewater treatment plants are usually classified as primary, secondary or tertiary treatment, depending on the purification level to which the plants provide[1]. Primary treatment uses physical processes such as screening and sedimentation to remove large solid particles and pollutants that will settle or float. Secondary treatment uses the physical processes similar to the primary treatment and also provides a biological oxidation of the waste. Tertiary treatment is highly specialized since its use is dependent upon the pollutants to be removed[2].
In secondary treatment, microorganisms convert the organic wastes into stabilized compounds. Typical biological treatment processes make use of trickling filters, rotating biological contactors, aerated lagoons and activated sludge. Activated sludge is the most
widely used biological treatment process because the recirculation of the biomass allows microorganisms to adapt to changes in the wastewater composition by a relatively short acclimation process. In an activated sludge process, oxygen is usually supplied to the wastewater by diffusing aeration or mechanical aeration[3]. In diffusing aeration, a diffuser is used to introduce small air bubbles of 1.8-2.5 mm in diameter near the bottom of the tank. The air bubble size is kept small for an efficient oxygen transfer to water. A mechanical aeration system utilizes agitators or mixers to create and entrap air bubbles in water[4].
nitrogen removal and aerobic sludge treatment. The cost of aeration comes to more than 50% of the total energy consumption of the entire treatment process and that could be reduced substantially by using intermittent aeration[5-7]. Equipment for aeration may be classified into four categories: waterfall aerators, diffusion or bubble aerators, mechanical aerators and pressure aerators. In waterfall aerators, water is spread into droplets or thin films to increase the contact area between water and air. Common waterfall aerators are spray aerators, multiple tray aerators, cascade aerators, cone aerators and packed columns[2]. In the present study, an industrial wastewater from a polymer e-coating process was treated using a packed column as an aerator since it provided a very high surface area of the packing where water and air came into contact and oxygen was transferred from air to water efficiently.
The contacting time between air and water in a packed column is an important parameter for obtaining a required level of pollutant removal. Long contacting time between air and water results in a higher amount of oxygen transferred from air to water in the column. On the other hand, the biological oxidation is a relatively slow reaction process. The biological oxidation of the wastewater could be oxygen-diffusion controlled under a high concentration of biodegradable organics initially and becomes reaction controlled in later stage of the treatment. It may thus be unnecessary to aerate the wastewater continuously in the packed column. The aeration process consumes energy. The cost of the aeration contributes a major portion of the overall operating cost of the treatment process. Intermittent aeration thus may entail in some energy saving, i.e., a reduction in the operating cost.
Several researchers have investigated intermittent aeration in various biological treatment systems[8-13]. However, intermittent aeration in a packed column had not been investigated. Therefore, the objective of the present study was to determine an optimum on/off aeration cycle in a packed column aerator so as to achieve an acceptable BOD5 removal at a minimum
operating cost and maximum energy conservation possible.
MATERIALS AND METHODS
In the present study, a PVC column filled with 15 mm stainless steel Pall rings was used as an aerator. The ratio of the bed length to the column diameter was 4.5 and the ratio of the bed diameter to the packing size was 5. Wastewater from a polymer e-coating process containing an initial BOD5 of 70 mg L−
1
was pumped from a holding tank to the top of the packed column. A
countercurrent air stream was introduced at the bottom of the column. Pall rings were used to provide a large contact area for the wastewater and the air where oxygen was transferred from air to liquid.
In intermittent aeration, the liquid pump was turned on and off automatically at different preset intervals using a timer. During the on aeration cycle, a constant wastewater flowrate of 28 kg m−2 sec−1 to the column was used. Water exiting the packed column flowed back to the holding tank where it was recirculated to the column. In order to keep the wastewater at a constant temperature of 25°C, a heat exchanger was installed between the pump discharge and the liquid stream entering the packed column as shown in Fig. 1. Air flowrate was maintained at 0.082 kg m−2 sec−1 for all experiments. Rotameters (Hedland Inc., Racine, WI, USA) were used to measure air and water flowrates to the column. During the off aeration cycle, water remained in the holding tank.
Intermittent aearation was done so to determine an optimum air-wastewater contacting time in the column, which provided an adequate aeration of the wastewater for the BOD5 removal and yet some energy saving over
continuous aeartion would be realized. Therefore, experiments were performed at varied contacting times between air and water in the column. The contacting time, tC, is defined as:
op
C t
V Q u H
t = ⋅ ⋅ (1)
Where:
top = The total aeration time per 24 h of treatment
H = The packing height
u = The superficial velocity of liquid in the column Q = The volumetric flowrate of liquid
V = The total liquid volume in the tank H/u = The residence time of liquid in the column
Liquid tank Pump Heat exchanger Liquid flowmeter
Air exiting the packed column
Wastewater to the packed column
15-mm pall rings
Liquid return line
Packed column
Timer
Air flowmeter
Table 1: Contacting time of air-water in the packed column Pump- Pump- No. of Total Air-water Percentage on off cycles on-time contacting of energy time (h) time (h) 24 h−1 24 h−1 time (min) consumption
4 2.0 4 16.0 34.8 66.7
24 0.0 Continuous 24.0 52.3 100.0
2 2.0 6 12.0 26.1 50.0
2 4.0 4 8.0 17.4 33.3
5 1.0 4 20.0 43.6 83.3
3.5 4.5 3 10.5 22.9 43.8
4 4.0 3 12.0 26.1 50.0
6 2.0 3 18.0 39.2 75.0
10 2.0 2 20.0 43.6 83.3
4 8.0 2 8.0 17.4 33.3
0 24.0 0 00.0 00.0 00.0
1 5.0 4 4.0 8.70 16.7
Using the relationship between the volumetric flowrate and the superficial velocity of liquid, Eq. 1 can be simplified as:
op
C t
V H S
t = ⋅ ⋅ (2)
where, S is the cross-sectional area of the column. It is relevant to note that for a recirculating system as the one used in the present study, the contacting time is independent of the liquid flowrate as shown in Eq. 2. In addition, the solubility of oxygen in water is also independent of liquid flowrate in the column. Therefore, the liquid flowrate should be set as low as possible in order to reduce the energy consumption for pumping while the liquid rate is still adequate to provide good wetting of the packing in the packed column. It is essential to maintain good wetting of the packing so to ensure a sufficient oxygen transfer from air to water.
Accordingly, the percentage energy consumption can be used to evaluate the economical aspect of each on/off aeration cycle (or contacting time). The percentage energy consumed by the pump for various pumping cycles is defined as:
100 24 t P
% = op⋅ (3)
where, %P is the percentage energy consumption. The 100% energy consumption represents continuous aeration. Twelve different on/off aeration cycles were used in the experiments while all other parameters were kept constant. Table 1 shows the contacting time of air and water and the corresponding percentage energy consumption for different experiments.
In each experiment, water samples were taken and tested at 0, 24, 48 and 72 h of treatment time. The
amounts of dissolved oxygen in water at the sampling time and after an incubating period of 5 days at 20°C were measured using a dissolved oxygen meter (Model 52 CE, YSI, Yellow Springs, Ohio, USA). The BOD5
of the water samples were determined accordingly to the standard methods[14]. Polyseed® (InterBio, Inc., Texas) was used to provide microorganisms to the wastewater samples in the BOD bottles for the BOD5
measurements. The seed solution was made up of one capsule of Polyseed® in 500 mL distilled water. 10 mL of the seed solution was added to each BOD bottle of the wastewater.
RESULTS
Effect of aeration intervals on the BOD5 removal:
The variation of the percentage BOD5 removal with the
treatment time for various contacting times is plotted in Fig. 2. When the contacting time between air and water was reduced, the BOD5 removal decreased accordingly.
Nevertheless, for a long treatment time of 72 h, the BOD5 removal did not decrease significantly when the
contacting time was reduced by about 17% (aeration for 20 h per 24 h of treatment). It was also noted that the rate of the BOD5 removal generally decreased with
increases in the treatment time.
The BOD5 removal appeared to follows the
first-order kinetics that exhibited an exponential decay of the BOD with the treatment time. The first order kinetics of the BOD removal can be expressed as below:
BOD k dt dBOD ⋅ − = (4)
where, k is the BOD5 removal rate constant and t is the
treatment time.
From Eq. 4, the fractional BOD remaining can be written as: ) kt exp( BOD BOD i − = (5)
where, BODi is the initial BOD of the wastewater.
As indicated by Eq. (5), the rate constant, k, can be obtained from the slope of a plot of ln(BOD/BODi) vs.
the treatment time. The values of the rate constant obtained for varied aeration cycles are plotted in Fig. 3.
From the data in Fig. 3, an empirical relationship between the rate constant and the contacting time ranging from 8.7-52.3 min was also obtained below:
17 . 1 C 4 t 10 3 . 2
Fig. 2: Variation of the BOD removal with the treatment time at different On/Off aeration cycles
Fig. 3: Variation of the rate constant k with the air-water contacting time in the column
with a coefficient of determination r2 = 0.93 and a RMS (root-mean-square error) of 0.00078 between the values predicted from Eq. 6 and the experimental data.
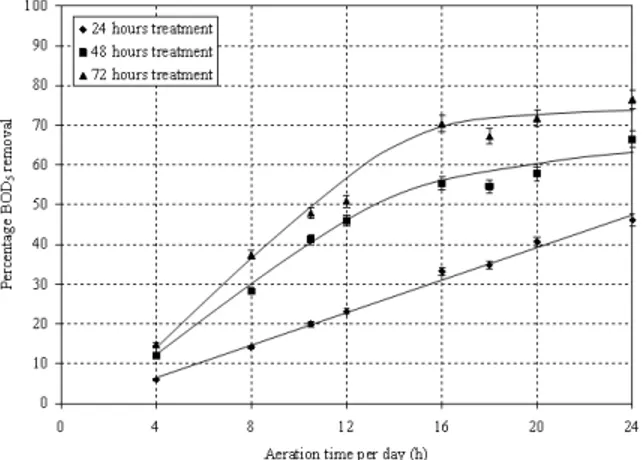
The variation of the percentage BOD5 removal
with the aeration time for different treatment durations was also investigated and the results obtained are plotted in Fig. 4.
The driving force to oxygen transfer to water was also estimated. Using a standard equation for mass flux, the transfer rate, RA, of oxygen from air to water in the
packed column can be written as below:
RA = VB. kL. a. (C*-C) (7)
Where:
VB = The volume of the packed bed
kL = The mass transfer coefficient of oxygen in the
water film on the surface of the packing a = The effective interfacial area of the packing C* = The saturated concentration of oxygen in water at
the gas-liquid interface
C = The concentration of oxygen in the bulk liquid
Fig. 4: Effect of aeration time on the BOD5 removal for
various treatment times
Fig. 5: Estimated driving force for oxygen transfer to water at various air-water contacting times in the column
From Eq. 7, the driving force for oxygen transfer (C*-C) can be estimated using the mass transfer coefficient, kL and the effective interfacial area of the
packing, a, from correlations given in the literature[15] and the oxygen consumed by both the BOD and the COD removal measured in the experiments under various air-liquid contacting times. The results obtained are presented in Fig. 5. The driving force for the oxygen transfer was within the range of 0.8-2.5 mg L−1. On the other hand, the measured Dissolved Oxygen (DO) in wastewater was substantially higher as shown in Fig. 6. The concentration of DO was above the critical concentration for the BOD removal (10% of the saturation concentration [16]) during 5 h off cycle.
From the profile of DO in Fig. 6, the portion of the total BOD5 removal by suspended microorganisms
Fig. 6: Profile of Dissolved Oxygen (DO) in wastewater for 1 h On/5 h Off aeration cycles
Fig. 7a: Optimum aeration time for the treatment of industrial wastewater
It was observed that about 12% of the total BOD5
removal was due to the suspended microorganisms. In addition, the microorganisms attached to the packing in the column aerator contributed to about 10% of the organic removal during on-aeration cycles while the stripping effect was accounted for about 20% of the total BOD5 removal. On the overall, about 50% of the
total BOD5 removal was due to suspended
microorganisms in the holding tank during on-aeration cycles.
In order to determine the optimum aeration time for the lowest energy consumption, the unit energy consumption was used. The unit energy consumption was defined as the ratio of the time-averaged percent energy consumption and the percentage BOD5 removal.
The results obtained are plotted in Fig. 7a and b.
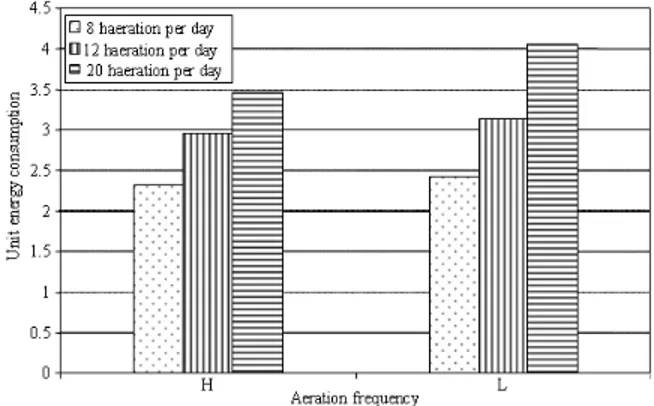
Effect of aeration frequency on the BOD removal: The effects of the aeration frequency on the BOD removal at various total aeration times per day were also investigated. Aeration time of 8, 12 and 20 h day−1 were used in this phase of the present study.
Fig. 7b: Optimum aeration time for the treatment of ethylene glycol solution
Fig. 8: Effect of aeration frequency on the unit energy consumption for various aeration times, L: Low frequency, H: High frequency, twice the number of aeration cycles of L
Those aeration times are equivalent to cases of 33, 50 and 83% energy consumption, respectively. For 8 h aeration, 2 h On/4 h off and 4 h On/8 h Off cycles were used. Similarly, 2 h On/2 h Off and 4 h On/ 4 h Off cycles were used for the case of 12 h aeration and 5 h On/1 h Off and 10 h On/2 h Off cycles were used for 20 h aeration. For the 8 h aeration, the 2 h On/4 h Off aeration cycle was designated as high frequency aeration and used to compare with the 4 h On/8 h Off cycle as low frequency aeration. For the same air-liquid contacting time in the column, the aeration frequency (number of aeration cycles) of the 2 h On/4 h Off cycle was twice that of the 4 h On/8 h Off cycle.
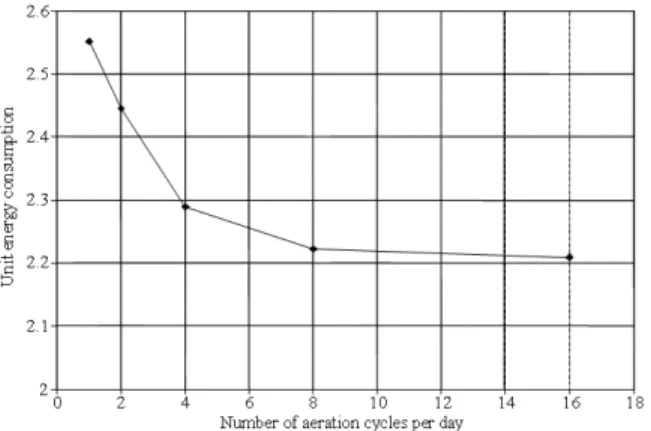
Fig. 9: Optimum number of aeration cycles per day for 16 h aeration
DISCUSSION
Wastewater aeration represents one of the most energy intensive operations in a wastewater treatment system, consuming between 50-90% of the total energy cost of a typical municipal treatment facility. Since the solubility of oxygen in water is low, the time required to fully saturate water with oxygen is short. On the other hand, the rate of consumption of oxygen by biological oxidation is rather slow. Therefore, on/off aeration deems to be beneficial. On-Off aeration has been recommended as the most efficient way to reduce the cost of aeration. In the present study, a series of experiments were performed at varied pumping cycles so to obtain an adequate contacting time between air and water while to maintain the same amount of BOD removal.
The BOD5 removal followed the first-order
kinetics of the organic concentration that exhibited an exponential decay with the treatment time. This indicates that less oxygen is needed for the biological oxidation in the later period of the treatment. Therefore, it was not necessary to aerate the wastewater continuously for prolonged treatment time. However, for the contacting time less than 23 min (i.e., aeration for less than 10.5 h in 24 h of treatment), the BOD5
removal tends to follow a zero-order kinetics rather than the widely accepted first order kinetics with respect to the organic concentration. There seems to be a constant rate of BOD5 removal throughout the
duration of the treatment. For these cases, the dissolved oxygen might become the limiting reactant of the biological oxidation process.
As shown in Fig. 4, for 24 h of treatment the BOD5
removal varies linearly with the contacting time while an exponential decay trend is observed for 48 and 72 h
of treatment. For the first 24 h of treatment, the organic concentration in the wastewater was relatively high; hence, more oxygen was needed for the biological oxidation of the organics. The concentration of the dissolved oxygen in water might thus be low during the off cycle of aeration (the pump was off) and become the controlling factor of the BOD5 removal. The BOD5
removal was thus increased steadily with increases in the aeration time (or the contacting time). For longer treatment times (48 and 72 h), however, the BOD5
removal increased rapidly with the contacting time and leveled off at the contacting time of about 35 min. Over the first 24 h of treatment, a substantial reduction of the organic content might have occurred provided an adequate aeration (contacting time) was maintained. The oxygen requirement would then become lower in later stages. The dissolved oxygen concentration might remain at an adequate level during the off pumping cycle, specially for high contacting times of 35 min or higher (the percentage energy consumption of 75% or higher), hence, the BOD5 removal exhibits a gradual
change with the contacting time. At a very low contacting time, i.e., 8.7 min or 16.7% energy consumption (4 h aeration per 24 h of treatment), there might be a lack of dissolved oxygen in the wastewater during the Off cycle. The BOD5 removal was very low
and insignificantly different for all treatment times of 24, 48 and 72 h. Under on-aeration cycles, well-mixed condition as well as high turbulence in the liquid tank was observed. These conditions might have enhanced the transfer of the organics from the bulk liquid to the suspended microorganisms; hence, the BOD5 removal
was higher than that during the off-aeration cycles. The lower BOD5 removal at a lower contacting
time may indicate that the biomass on the surface of the packing in the column also plays a significant role in the overall bio-oxidation of the organic materials in the wastewater during the treatment process. When the liquid was cascaded down the packed column, the organic materials were transferred from water to the biomass on the surface of the packing where the biological oxidation occurred. When the wastewater was in the holding tank, organic substances might be oxidized only by the suspended biomass in the liquid phase, which was not in a large amount. When the wastewater stayed stagnant in the holding tank, i.e., no pumping, the BOD5 removal was about 8% after 72 h
of treatment compared to 75% BOD5 removal under
continuous aeration. On the other hand, about 40% of the BOD5 removal was observed for the case with
packed column in a similar way as that in a trickle bed filter. However, when the pumping time reached 18 h over 24 h of treatment, no further significant improvement in the BOD removal was observed.
The effect of aeration time on the energy consumption is shown in Fig. 7a and b. The air-liquid contacting time of 52.3 min is for the case with continuous aeration. For 24 h of treatment, the lowest unit energy consumption is at about 34 min of air-liquid contacting time (16 h aeration per day). In other words, the biological treatment of the wastewater was most cost efficient at the contacting time of about 35 min, indicating a 27% energy saving. For 48 and 72 h of treatment, the optimum unit energy consumption falls at the region of 25 min of air-liquid contacting time. This is equivalent to 12 h of aeration per 24 h of treatment. Thus, 50% energy saving is realized. Similar optimum air-liquid contacting time was also obtained with experiments using Ethylene Glycol (EG) solution as a simulated wastewater (Fig. 7b). It is interesting to note that for 72 h of treatment, both ethylene glycol solution and industrial wastewater had similar optimum contacting times in the region of 25 min although the experiments of these two wastewaters were operated under different flowrates and aeration times. For the EG solution, 25 min of air-liquid contacting time is equivalent to 16 h of aeration per day while for the industrial wastewater, this is equivalent to 12 h of aeration per day. This indicates that the unit energy consumption would be a good and representative parameter for determination of the optimum aeration time for different aeration operations.
The time required to fully saturate water with oxygen in the packed column was quite short because the solubility of oxygen in water was low (about 8.0 mg L−1) while the oxygen transfer efficiency in the packed column was high. On the other hand, the rate of consumption of oxygen by the biological oxidation of the wastewater was rather low. An adequate oxygen concentration in the wastewater could thus be maintained for several hours during the off-aeration cycle. Under continuous aeration, the amount oxygen transferred to water could be eventually negligible once the concentration of dissolved oxygen in water was close to saturation since the driving force for the oxygen transfer from air to liquid is very low, resulting in a substantial amount of energy wasted under continuous aeration.
It is also noted that the optimum contacting time was shortened with the long treatment time. At the beginning of the biodegradation process, the concentration of the organic matters in the wastewater was relatively high; hence, the biodegradation occurred
at a relatively fast rate, which resulted in a high oxygen demand. The BOD removal process might thus be oxygen-diffusion-controlled for the first 24 h of treatment. More aeration (i.e., longer contacting time) was needed so to provide sufficient oxygen for the BOD removal. The optimum energy consumption thus fell in a longer contacting time interval. At later stages, i.e., 48 and 72 h of treatment, however, the biodegradation proceeded at a lower rate, hence, less oxygen was required. Therefore, on the average less aeration was needed for a longer treatment time; hence, the optimum point was in a shorter contacting time interval. The results obtained indicates that there existed an optimum contacting time between air and water, which would allow a low aeration cost while an adequate BOD removal was maintained. Significant amount of energy could be saved in biological treatment processes that take advantage of intermittent aeration.
Figure 8 shows the unit energy consumption based on the BOD removal after 24 h of treatment for all three cases of aeration cycles. It appears that the frequency only affected the BOD removal slightly for the case that was either has a substantially low aeration time (8 h) or a moderate aeration time (12 h). On the other hand, for the case of 20 h aeration the BOD removal increased noticeably with high aeration frequency, as reflected by the lower unit energy consumption. For the case with low aeration times of 8 and 12 h, it seemed that the treatment process was inefficient because of the low air-liquid contacting time in the column for oxygen transfer from air to water. For 20 h aeration per day at the high aeration frequency, the dissolved oxygen in the wastewater was probably maintained at a higher level since the off aeration time was only 1 h (the shortest off aeration), resulting in a better unit energy consumption. Therefore, the unit energy consumption (or the BOD removal) didn’t change significantly with the aeration frequency. On the mass transfer standpoint, the higher aeration frequency would facilitate a higher amount of oxygen transferred to water over the course of the treatment because with a shorter aeration cycle the driving force for mass transfer would be higher. This might be the reason for the improvement in the BOD removal due to the higher aeration frequency for the case of 12 h aeration. Moreover, it can be seen clearly that the energy consumption was reduced significantly when the number of aeration cycle was increased from 1-8 cycles per day as shown in Fig. 9.
CONCLUSION
could be achieved using intermittent aeration for a moderate treatment time of 48-72 h. Under this condition, the BOD5 was reduced from the initial
concentration of 70 mg L−1 to about 28 mg L−1. At 16 h of aeration per day, further reduction of the BOD5 to
20 mg L−1 was obtained. However, no further significant increase in the BOD5 removal was achieved
with increases in the aeration time to 18 h or higher. The dissolved oxygen in wastewater at the end of 5 h off cycle (no aeration) was about 3.0 mg L−1, which was still adequate for biodegration of organics in the wastewater. The BOD5 removal was found to increase
with the aeration frequency that was at a shorter On/Off cycle time and hence, a higher number of cycles per day. For the total aeration time of 16 h per day, the optimum point was obtained with 8 aeration cycles (2 h On/1 h Off). Further increase in aeration frequency to 16 cycles per day didn’t lead to any significant change in the BOD5 removal.
ACKNOWLEDGEMENT
The researchers would like to acknowledge the help of C. Lam and G. Thuraisingham on the experimental research of the present study.
REFERENCES
1. Drinan, J.E., 2000. Water and Wastewater Treatment: A Guide for the Nonengineering Professional. 1st Edn., Technomic Publishing Company, Inc., Pennsylvania, ISBN: -10: 1587160498,pp: 336.
2. American Water Works Association, 1997. Water Treatment Plant Design. 3rd Edn., McGraw-Hill, New York, USA.,ISBN: -10: 0070016437 pp: 806. 3. Reynolds, T. and P. Richards, 1995. Unit
Operations and Processes in Environmental Engineering. 2nd Edn., PWS Publishing, New York, USA., ISBN: -10: 0534948847, pp: 816. 4. Minett, S., 1995. The optimal conditions for
aeration-the views of two leading German researchers. Eur. Water Pollut. Control, 5: 17-19. 5. Ferrer, J., M.A. Rodrigo, A. Seco and J.M.
Penya-roja, 1998. Energy saving in the aeration process by fuzzy logic control. Water Sci. Technol., 38: 209-217. DOI: 10.1016/S0273-1223(98)00463-6
6. Hamamoto, Y., S. Tabata and Y. Okubo, 1997. Development of the intermittent cyclic process for simultaneous nitrogen and phosphorus removal. Water Sci. Technol., 35: 145-152. DOI: 10.1016/S0273-1223(96)00890-6
7. Schuyler, R.O., R.W. Ramey, M. Wallace, G. Vance and A. Torres, 1997. On/off aeration saves money and improves effluent quality. Fuel Energ. Abst., 38: 443. http://www.ingentaconnect.com/content/els/01406701/19 97/00000038/00000006/art82383
8. Bicudo, J.R. and I.F. Svoboda, 1995. Effect of intermittent-cycle extended-aeration treatment on the fate of carbonaceous material in pig slurry. Bioresour. Technol., 54: 53-62.
9. Ouyang, C.F. and C.T. Juan, 1995. A study of modified process for the intermittent cycle extended aeration system. Water Sci. Technol., 31: 173-180. http://www.iwaponline.com/wst/03109/wst031090173.htm 10. Yang, P.Y. and Z. Wang, 1999. Integrating an
intermittent aerator in a swine wastewater treatment system for land-limited conditions. Bioresources, Technol., 69: 191-198. http://cat.inist.fr/?aModele=afficheN&cpsidt=1761740 11. Chang, J.S., A.C. Chen, M.Y. Hung and M. Shih,
1999. The operational strategy of intermittent cycle extended aeration system in treating sewage. J. Chem. Technol. Biotechnol., 74: 688-692. http://cat.inist.fr/?aModele=afficheN&cpsidt=1909404 12. Park, K.Y., Y. Inamori, M. Mizuochi and K.H. Ahn,
2000. Emission and control of nitrous oxide from a biological wastewater treatment system with intermittent aeration. J. Biosci. Bioeng., 90: 247-252. DOI: 10.1016/S1389-1723(00)80077-8
13. Luo, A., J. Zhu and P.M. Ndegwa, 2002. Removal of carbon, nitrogen and phosphorus in pig manure by continuous and intermittent aeration at low redox potentials. Biosyst. Eng., 82: 209-215.DOI: 10.1006/bioe.2002.0071
14. APHA., AWWA., WPCF., 1998. Standard Methods for the Examination of Water and Wastewater. 20th Edn., American Public Health Association, New York, USA.
15. Billet, R. and M. Schultes, 1999. Prediction of mass transfer columns with dumped and arranged packings. Chem. Eng. Res. Des., 77: 498-504. http://cat.inist.fr/?aModele=afficheN&cpsidt=1995442 16. Bailey, J.E. and D.F. Ollis, 1986. Biochemical
Engineering Fundamental. 2nd. Edn., McGraw-Hill, New York, USA., ISBN: -10: 0070032122 pp: 928. 17. Doan, H.D. and J. Wu, 2002. Biological treatment