LABOUR FORCE DYNAMICS AND TERRITORIAL
DISTRIBUTION IN IASI COUNTY
Daniela IUREA
1. INTRODUCTION ... 135
2. METHODOLOGY AND APPROACH ... 135
3. RESULTS AND DISCUSSIONS ... 136
4. CONCLUSION ... 146
5. ACKNOWLEDGEMENTS ... 147
6. REFERENCES ... 147
Cite this document:
Iurea, D., 2011. Labour force dynamics and territorial distribution in Iasi County.
Cinq Continents 1 (2): 133-147 [Available online]| URL :
http://www.cinqcontinents.uv.ro/1/1_2_Iurea.pdf
Volume 1 / Numéro 2 Été 2011 ISSN: 2247 - 2290
p. 133-147
Ph.D. Std.
Faculty of Geography, University of Bucharest
[134]
Labour force dynamics and territorial distribution in Iasi County
Daniela Iurea
La dynamique et la répartition spatiale de la main-d'oeuvre au comté de Iasi. Les changements politiques, socio-demographiques et économiques qui ont marqué l’économie de marché après la chute du communisme se sont répercutés directement aussi sur la main-d'oeuvre du comté de Iasi. Les effets de la restructuration économique, soit la désindustrialisation, ont été ressentis au niveau du comté de Iasi par les taux de chômage, par la reduction accélérée des taux d'activité et d'emploi et par une réduction substantielle de la navette. Cet article examine la maniére dont le nouveau contexte économique, politique et sociale a influencé la main-d’oeuvre à Iasi, suivant les principales tendances d’évolution de la population active, occupée, les employés et les chômeurs, aussi comme la répartition spatiale du chômage et de personnes employées dans les trois principaux secteurs d'activité.
Mots clés: population active, population employée, le taux de chômage, disparités téritoriales, comté de Iasi
Dinamica forței de muncă și distribuția spațială a acesteia în Județul Iași. Schimbările politice, socio-demografice și economice care au marcat tranziția
spre economia de piață, după căderea regimului comunist, s-au răsfrânt în mod
direct și asupra forței de muncă din județul Iași. Efectele procesului de
restructurare economică, respectiv de dezindustrializare au fost resimțite la
nivelul județului Iași prin şomaj, prin reducerea accelerată a ratelor de activitate
şi de ocupare a populaţiei şi printr-o diminuarea substanţială a navetismului.
Acest articol analizează modul în care noile contexte economice, politice şi sociale au influențat forța de muncă din județul Iași, urmărind principalele
tendințe de evoluție a populației active, ocupate, salariaților și șomerilor,
precum și distribuțiile spațiale ale ratei șomajului și ale persoanelor
salariate în cele trei sectoare principale de activitate.
1. INTRODUCTION
The political, social and economic changes that marked the transition to the market economy, after the fall of the communist regime, has led to countinuous readjustments of the demographic evolution and implicitly, of the labor force in Romania, as well as in Iași County [1].
These changes had a direct influence on the dynamics of the active and employed population, and on the unemployment.
The industrial destructuring that followed the collapse of the communist regime took place concomitantly with the manifestation of an obvious trend of economic tertiarization.
During the transition to the market economy, the intra-regional disparities have deepened due to the fact that resources have tended to focus on those areas where they were better used, whereas the poorer areas where the industry has been developed artificially, were most affected by the severe impact of the transition and structural adjustment to the market economy system [2, 3].
At the beginning of this period, in Iași are still felt the effects of the rural exodus produced as a consequence of the industrialization and urbanization efforts. The de-industrialization was preceded by a counter-urbanization process, based on the workforce coming mainly from industry, which very often had no other choice but to return to their villages or to settle in the villages situated in the peri-urban areas [4].
More recent developments indicate some economic revival, especially in cities, and particularly in Iasi municipality, certified by the decrease of the unemployment and by the gradual rise in the living standards.
2. METHODOLOGY AND APPROACH
Depending on the relation of the population with the labour market, three statistical categories of population are being defined: the active population, the employed population, and the unemployed population.
According to the INS methodology, from the economic point of view, the active population includes the people aged 15 years and over who provide the available workforce
that contributs to the production of goods and services in the country. It includes the employed and the unemployed population.
Employed population includsall the people aged 15 years and over who performed
[136]
one hour during the reference period to achieve a revenue in the form of wages or any other benefits (according to the methodology „Statistical research on household labor”).
The active and employed population reflect the degree of population insertion in the economic activities, being in close relationship with the socio-demographic factors (age and sex structure of the population, population health and education level, retirement age), and economic factors, especially the economic development and the dominant sectors of activity.
The changes in the socio-demographic and economic factors lead to temporo-spatial variations of these indicators, with direct implications on the unemployment rates, and indirectly on the livind standards evolutions.
The analysis of the employment dynamics was based on the statistic data provided by the Department of Statistics of Iași County, by the National Institute of Statistics and by the Employment Agency of Iași County for the period 1990-2008.
Territorial differences in the distribution of unemployment rates and in the
percentages of employees in the three main sectors of the economy were highlighted for all the 98 administrative units in Iași County, of which 5 towns and 93 communes.
The level of unemployment for each administrative unit in 2008 was rendered based on the data provided by the Agency for Employment for Iași County.
The dynamics of the number of the employees in the three main sector of economic activity were illustrated for the years 1995, 2000, 2005 and 2008 based on the data provided by the Statistics Department of Iași County.
3. RESULTS AND DISCUSSIONS
The dynamics of the active and of the employed population in Iași County faithfully
0 50 100 150 200 250 300 350 400 450
1995 2000 2001 2002 2003 2004 2005 2006 2007 2008
Active population (thousand people)
Employed population (thousand people)
Figure 1. The dynamics of the active and employed population during 1995-2008 Source: National Institute of Statistics, 2011
Whereas the active population decresed by 20% during 1995-2008, the number of employed people only decreased by 13.7%, indicating a recent economic revival manifested by an increase in the employability of the population.
The activity and employment rates had an overall downward trend during the period 2000-2008.
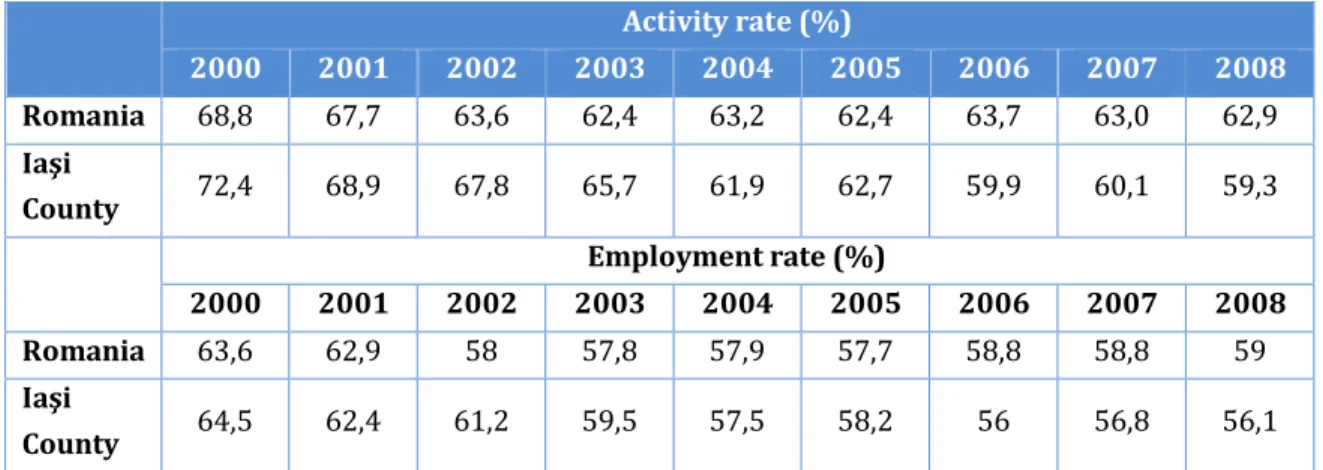
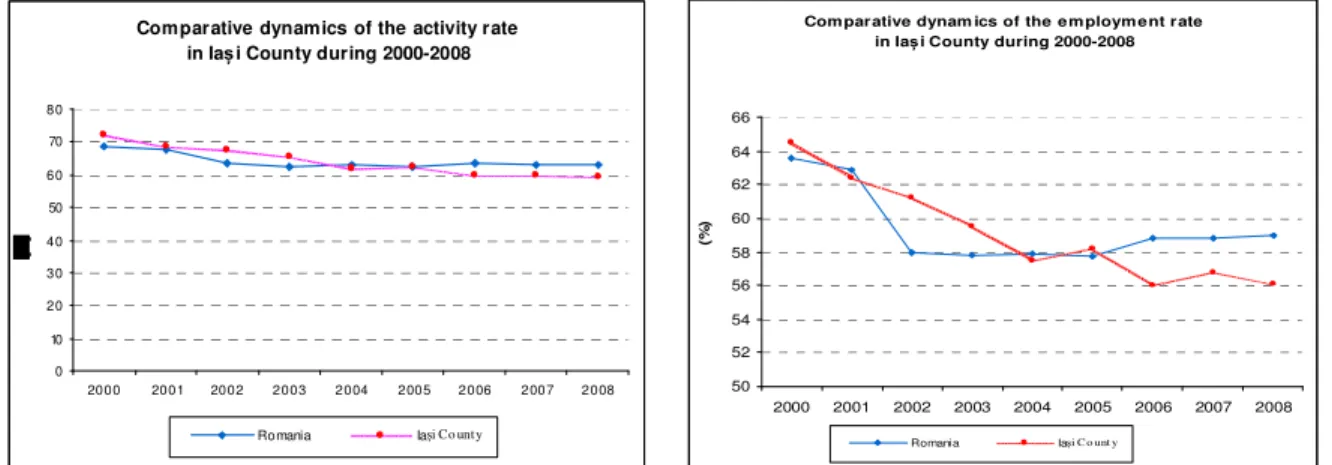
The comparison with the activity and employment rates at national level (Table 1) shows higher values of these parameters for Iași County compared with the average national rates during the first part of the interval (2000-2004) and lower values in the second part (2006-2008) (Fig. 2 and 3).
Table 1: Comparative dynamics of the activity and employment rate
Activity rate (%)
2000 2001 2002 2003 2004 2005 2006 2007 2008
Romania 68,8 67,7 63,6 62,4 63,2 62,4 63,7 63,0 62,9
Iaşi
County 72,4 68,9 67,8 65,7 61,9 62,7 59,9 60,1 59,3
Employment rate (%)
2000 2001 2002 2003 2004 2005 2006 2007 2008
Romania 63,6 62,9 58 57,8 57,9 57,7 58,8 58,8 59
Iaşi
County 64,5 62,4 61,2 59,5 57,5 58,2 56 56,8 56,1
[138]
Figure 2. Comparative dynamics of the activity rate Figure 3. Comparative dynamics of the
employmentrate
Source: Statistics Department of Iași County, 2010
The distribution of the active population by residential environments has significant differences, so that, although the urban population represents only 47% percentages from the total population of the county (2008), the active population of cities is 55.02% of the total active population of the county, compared to only 44.98% of the active population in rural areas (Fig. 4).
This situation is due to the fact that in rural areas demographic aging is manifested more strongly, and is accompanied by a proportionally lower share of working age population on the one hand, and on the other hand rural areas have a lower capacity to absorb the workforce, especially due to the mainly agrarian economic structures.
Figure 4. The distribution of the active population by residential environments, 2008
Source: National Institute of Statistics, 2011
Com parative dynam ics of the em ploym ent rate
in Iași County during 2000-2008
50 52 54 56 58 60 62 64 66
2000 2001 2002 2003 2004 2005 2006 2007 2008
(%
)
Romania Iași C o unt y Comparative dynamics of the activity rate
in Iași County during 2000-2008
0 10 20 30 40 50 60 70 80
2000 2001 2002 2003 2004 2005 2006 2007 2008 Romania Iași Co unt y
44,98 55,02
rural
The employment structure by the main activities of the national economy (Fig. 5) shows a net predominance of the population involved in agricultural activities (including agriculture, forestry, fishery and hunting) at a rate of 31.5% in 2008 in an obvious decrease compared with 1999-2000 when the share of population employed in agricultural activities reached a peak of 43.2%.
By contrast, the population dynamics in the industrial sector was constantly decreasing, from a share of approx. 28.6% from the total employed population in 1992 to only 17.34% in 2008. In absolute terms, the reduction was about 47,000 people, generated by massive layoffs that occurred in Iași county’s industry.
Another area with an interesting dynamic regarding employment is the construction sector which initially had a downward trend from 4.2% in 1992 to 4.0% in 2001, but after this year the employability in this sector increased up to 8.6% due to the rise of construction investments.
In relation to the construction sector can be explained the real estate development, which had an upward but fluctuant trend during 1992 and 2008.
0 20 40 60 80 100 120 140 160
Agriculture, forestry, fishing and hunting Industry - totalConstructionsCommerceHotels and restaurantsTransport, storage i communicationsFinancial intermediationsReal estate and other servicesPublic administration and defenceEducationHealth and social care
1992 1995 2000 2001 2002 2003 2004 2005 2006 2007 2008
Figure 5. Dynamics of the employment structure by the main activities of the national economy
Source: Statistics Department of Iași County, 2010
Within the tertiary sector, commerce proved to be the most dynamic activity in terms of employment, with a sharp increase immediately after 1992 (a tripling of the employment until 1995, with an absolute increase of approx. 22,600 people) as an effect of the market liberalization and the proliferation of small commercial units.
Subsequently, the number of people employed in commerce has stabilized or slowly increased to approx. 12.1% in 2008.
[140]
dynamic, incresing from 3.7% in 1992 to 6.7% in 2008 mainly due to the diversification of the private medical facilites.
The analysis of the dynamics of number of employees is of particular interest, as they
ensures the income in households, supporting as well the inactive population. The dynamics of the employees is closely related to the economic environment (and to the demand in human resources), and is extremely sensitive to any changes that occur in the economic activities.
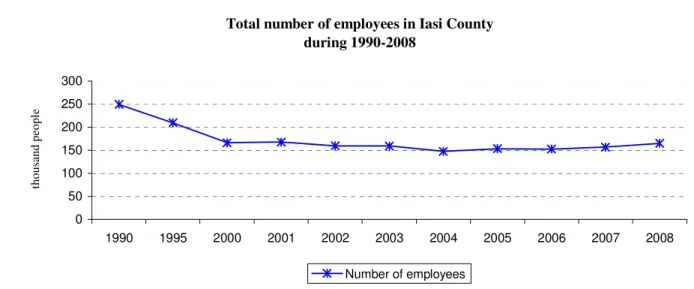
The dynamics of the number of the employees in the recent years (Fig. 6) has followed a downward trend durind 1990-2004, their number decreasing by 59% in 2004, compared to the 249,000 employees registered at the beginning of the interval. After 2004, however, the number of the employees begun to increase gradually, reaching 169,900 employees in 2008.
Total number of employees in Iasi County during 1990-2008
0 50 100 150 200 250 300
1990 1995 2000 2001 2002 2003 2004 2005 2006 2007 2008
th
o
u
sa
n
d
p
eo
p
le
Number of employees
Figure 6. The dynamics of the total number of the employees in Iași County during 1990-2008
Source: National Institute of Statistics, 2011
The decrese in the number of employees as a reflex of the reduction of the number of available jobs that affected to a greater extent the rural residents, causing the deepening of the impoverishment of the rural population and the practice of an subsistence agriculture.
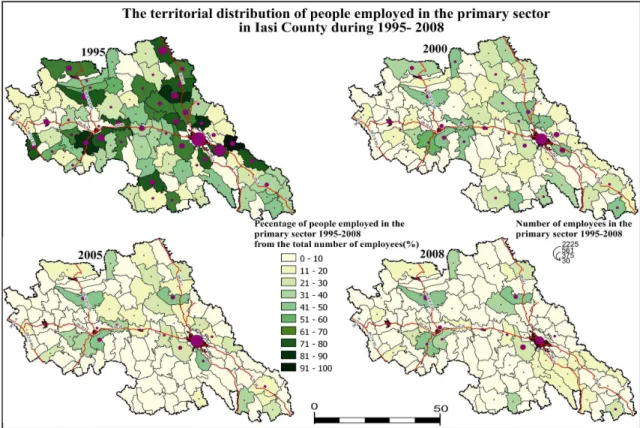
Figure 7. Territorial distribution of employees in the primary sector during 1995-2008
Source: Statistics Department of Iasi County, 2010
The dynamics of the emplyees working in the primary sector of economic activity (Fig. 7) followed a downward trend throughout the analyzed period, as a consequence of the disappearance of the state jobs in the agriculture. The massive reduction in the number of employees in agriculture is in relation to the employment increase in agriculture during 1990-2005.
The antagonistic developments of these two categories indicate a shift of the unemployed population towards the agriculture practices in their own households, becoming unpaid workers. Rural areas are those which have lost the majority of the employees in the primary sector.
Thus, whereas at the beginning of the period there were communes where the share of the employees in the primary sector exceeded 90% in the total number of employees, in 2008 only few of them recorded shares up to no more than 50%.
[142]
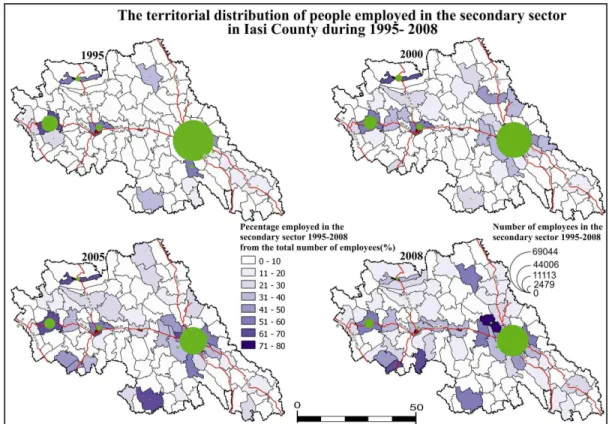
Figure 8. Territorial distribution of employees in the secundary sector during 1995-2008
Source: Statistics Department of Iași County, 2010
High share of population employed in secondary sector exceeding 50% of the total number of employees are recorded by the peri-urban communes of Iasi municipality, as Letcani, Rediu and Holboca. Other communes with a dominant share of employees in the secondary sector are Țibanești, Oțeleni, Mircești and Vlădeni. This category also includes Pașcani city , which recorded a share of the employees in the secondary sector about 60% of the total number of employees in 2008, although it suffered massive losses of employees in this sector in the last 20 years, consequence of the industrial destructuring that marked the transition period.
The dynamics of the employees in the tertiary sector points an increase of their share during 1995-2008, especially in rural areas.
be relatively stable (education, health), or even dynamic (public administration). Some examples of communes whith large shares of employees in the tertiary sector due to the decrease in the total number of employees as a consequence of the cessation of the activites of some agro-livestock units are Bivolari, Miroslovești, Țibana, Țuțora, Aroneanu, Coarnele Caprei and Lungani.
In the urban areas, the increase in the number of employees working in the tertiary sector of economic activity (Fig. 9) is mainly due to the increase of the number of employees working in services, especially commerce, which had an explosive growth after 1990, including in terms of the human resources involved.
Figure 9. Territorial distribution of employees in the tertiary sector during 1995-2008
Source: Statistics Department of Iași County, 2010
In conjunction with the dynamics of the employees evolved the commuting, usually
[144]
As a result of the industrial downsizing in urban centers, and generally of the economic restructuring that characterized the transition to the market economy [7], the number of the employees decreased significantly by repeated layoffs, so that the first employees affected by this process were the commuters.
This phenomenon manifested with the highest intensity in the communes located in the peri-urban areas, as in the case of Aroneanu, Ciurea, Holboca, Tomeşti, Bârnova, Leţcani and Popricani from the sphere of influence of Iasi municipality, Deleni and Scobinți from the sphere of influence of Hârlău city, the communes that were formed by dividing the commune Târgu Frumos (Costeşti, Ion Neculce and Balş) and Strunga commune, or those from the proximity of Pașcani municipality (Valea Seacă, Stolniceni-Prăjescu). This was also the case of the localities that benefited a good accesibility (especially by train), as in the case of Mirceşti, Mirosloveşti, Mogoşeşti-Siret communes which used to commute to Roman city.
Unemployment is a phenomenon with profound implications on the functioning of
society, which occured in Romania after 1989, with the restructuring of the socialist economy that was pushed to adapt to the market economy [8].
While before 1989, one of the priority policies of the state was represented by the employment entirely (and at any cost) of the working population, since 1991 began to be felt the effects of the layoffs.
Unemployment has evolved continuously during the so-called "transition", especially in the province of Moldovia, which has the highest levels of unemployment. Iasi County was equally affected by repeated layoffs, especially in the industrial sector, so unemployment has risen continuously.
Unemployment has reached its highest level in 1994 when there were recorded 66,000 people which represented 16.1% of the active population, of which 34,126 were women (16.7%) compared with the average national unemployment rate of 10.9% and 12.9% for women (Fig. 10 and 11).
After 1995 unemployment began to decline in absolute numbers, while maintaining a fairly high rate, with a faster reduction of female unemployment. Overall unemployment has remained on a downward curve, so that by the end of 2008 recorded the lowest number of unemployed population since 1992.
0 5000 10000 15000 20000 25000 30000 35000 40000 45000 50000
1991 1995 2000 2001 2002 2003 2004 2005 2006 2007 2008
Unemployed men (number of people) Unemployed women (number of people)
0 2 4 6 8 10 12 14 16
1991 1995 2000 2001 2002 2003 2004 2005 2006 2007 2008
Global unemployment rate (%) Women unemployment rate (%) Men unemployment rate (%)
Figure 10. Dynamics of unemployed people during
1991- 2008
Figure 11. Dynamics of unemployment rates by
gender during 1991- 2008
Source: National Institute of Statistics, 2011
The territorial distribution of unemployment (Fig. 12) shows that high unemployment rates are disseminated throughout the county, although, there are some vulnerable areas of unemployment.
Figure 12. Territorial distribution of unemployment rates in 2008
Source: Employment Agency of Iași County
[146]
The highest unemployment rates (over 13%) in the county were recorded by the communes Drăgușeni, Dolhești, Todirești, Grozești and Brăeşti.
The lowest values of unemployment rate for 2008 were recorded in compact areas of communes arranged axially north-south along the national road DN 24 in the eastern part of the county and along the DN 28 B (E58) in the western part of the county.
4. CONCLUSONS
The fairly long interval that followed the year 1989 was marked by the transition to the market economy, which entailed extensive economic, political and social changes, and subsequently a continuous adjustment of the socio-demographic system to all the intermediate stages of this transition.
This period was strongly influenced by the economic restructuring process, respectively by de-industrialization, with generalized consequences over the entire society (including a whole range of social problems), and by the restoring of the private property that contributed to a large extent to the reconfiguration of the countryside. The evolution of Iași County was particularly affected by these events due to the large-scale of industrial restructuring in this part of the country.
The effects of the changes in the economic sector have resulted in: unemployment, accelerated decrease in the activity and emplyment rates, and substantial reduction of commuting, associated with a counter-urbanization phenomenon, which meant the growth of the rural population at the expense of the urban population.
In parallel with the phenomenon of counter-urbanization has occurred an increase of the employment in agriculture (as a consequence of significant amount of layoffs), in the majority of cases being a subzistence agriculture, but with an important role in regulating the (official) unemployment.
5. ACKNOWLEDGEMENTS
This work has been supported by the research grant POSDRU/6/1.5/S/24 – “Financial support for doctoral studies on the complexity of nature, environment and human society”, project co-financed by the European Social Fund through the Sectoral Operational Programme for Human Resources Development 2007-2013.
6. REFERENCES
[1] IAŢU C. Demographie et geographie du travail en Roumanie postdecembriste,
Editura Sedcom Libris, Iaşi. 2006
[2] IANOȘ, I. Dinamica Urbană. Aplicaţii la oraşul şi sistemul urban românesc, Editura
tehnică, Bucureşti, 2004.
[3] IANOŞ I., HELLER W. Spaţiu, economie şi sisteme de aşezări. Editura Tehnică,
Bucureşti. 2006
[4] UNGUREANU A., GROZA O., MUNTELE I. (coord.) Moldova. Populaţia, forţa de
muncă şi aşezările umane în tranziţie. Editura Corson. Iaşi. 2002
[5] IAȚU C., MUNTELE I. Atlas statistico-geografic și de amenajare a teritoriului
judetului Iași. Editura Universitatii Alexandru Ioan Cuza Iasi. 2009
[6] ISTRATE, M. Relaţiile urban-rural în Moldova în perioada contemporană, Editura
Universităţii, Iaşi, 2008.
[7] REY VIOLETTE, GROZA O., IANOŞ I., PĂTROESCU M. Atlasul României. Editura Rao,
Bucureşti. 2006
[8] ZAMFIR E., BǍDESCU, I., ZAMFIR C. Starea societăţii româneşti după zece ani de