Abstract---Fingerprint has remained a very vital index for human recognition. In the field of security, series of Automatic Fingerprint Identification System (AFIS) have been developed. One of the indices for evaluating their contributions to the enforcement of security is the degree with which they appropriately verify or identify fingerprint images. This degree is generally determined by the quality of the images and the efficiency of the algorithm. In this paper, a modified version of an existing mathematical algorithm for improving the quality of fingerprint image through enhancement is discussed and implemented. The modified algorithm consists of sub-models for fingerprint segmentation, normalization, ridge orientation estimation, ridge frequency estimation, Gabor filtering, binarization and thinning. The implementation was characterized by Window Vista Home Basic operating system as platform and Matrix Laboratory (MatLab) as frontend engine. Synthetic images as well as real fingerprints obtained from the manual method of ink and paper were used to test the adequacies of the sub-models and the resulting algorithm. The results show that each sub-model performs well when images with free or minimal noise level were used. The necessity of each stage of the enhancement is also revealed.
Keyword---AFIS, image enhancement, fingerprint, minutiae, pattern matching, pattern recognition
I. INTRODUCTION
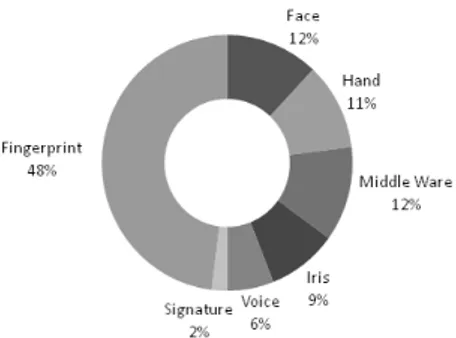
N the world today, fingerprint is one of the essential variables used for the enforcement of security through reliable identification of individuals. Fingerprints are used as variables of security during voting, operation of bank accounts among others. They are also used for controlling access to highly secured places like offices, equipment rooms, control centers and so on. The result of the survey conducted by the International Biometric Group (IBG) in 2004 on comparative analysis of fingerprint with other biometrics is presented in Fig. 1. The result shows that a substantial margin exists between the uses of fingerprint for identification over other biometrics such as face, hand, iris, voice, signature and middleware [1].
The following reasons had been adduced for the wide use and acceptability of fingerprints for enforcing or controlling security [1]-[4]:
a. Fingerprints have a wide variation since no two people have identical prints.
b. There is a high degree of consistency in fingerprints. A person’s fingerprint may change in scale but not in relative appearance, which is not the case in other biometrics.
c. Fingerprints are left each time the finger contacts a surface.
Manuscript received July 18, 2012; revised September 10, 2012. Authors are with the Federal University of Technology, PMB 704, Akure, Nigeria (phone: +2348-13062-2747; e-mail: [email protected], [email protected]).
Other reasons for the much larger market of personal authentication using fingerprints include:
a. Existence of small and inexpensive fingerprint capture devices
b. Existence of fast computing hardware
c. Existence of high recognition rate and speed equipment that meet the needs of many applications
d. The explosive growth of network and Internet transactions
e. The heightened awareness of the need for ease-of-use as an essential component of reliable security.
The main ingredients of any fingerprint that are used for identification and security control are the features it possesses. The features exhibit uniqueness defined by type, position and orientation from fingerprint to fingerprint and they are classified into global and local features [5]-[7]. Global features are those characteristics of the fingerprint that could be seen with the naked eye. They are the features that are characterized by the attributes that capture the global spatial relationships of a fingerprint. The global features include ridge pattern, ridge type, ridge orientation, ridge spatial frequency, ridge curvature, ridge position, core and delta areas, type lines and ridge count.
The Local Features are also known as Minutia Points. They are the tiny, unique characteristics of fingerprint ridges used for positive identification. Local features contain the information that is in a local area only and are invariant with respect to global transformation. It is possible for two or more impressions of same finger to have identical global features but still differ because they have local features (minutia points) that are different. In Fig. 2, ridge patterns (a) and (b) are two different impressions of the same finger (person). A local feature is read as bifurcation in (a) while it appears as a ridge ending in (b).
A Multi-Level Model for Fingerprint Image
Enhancement
Iwasokun G. Babatunde , Akinyokun O. Charles, Alese B. Kayode, and Olabode Olatubosun
I
Fig. 1: Comparative survey of fingerprint with other biometrics
(a) Bifurcation (b) Ridge ending
II. FINGERPRINT IMAGE ENHANCEMENT
Reliable and sound verification of fingerprints in any AFIS is always preceded with a proper detection and extraction of features. A fingerprint image is firstly enhanced before the features contained in it could be detected or extracted. A well enhanced image will provide a clear separation between the valid and spurious features. Spurious features are those minutiae points that are created due to noise or artifacts and they are not actually part of the fingerprint. This paper implements a modified version of the algorithm used in [8]-[9] for fingerprint image enhancement through the elimination of noises. The algorithm provides an enhancement method that is in the following phases:
A. Image Segmentation
There are two regions that describe any fingerprint image; namely the foreground region and the background region. The foreground regions are the regions containing the ridges and valleys. They are also known as the Region of Interest (RoI) since they contain the feature points. The background regions are the regions outside the foreground regions. They are the regions where the noises introduced into the image during enrolment are mostly found. The essence of segmentation is to reduce the burden associated with the subsequent stages of image enhancement by ensuring that focus is only on the foreground regions.
The background regions possess very low grey-level variance values while the foreground regions posses very high grey-level variance values. Block processing approach is used in this research in place of the pixel approach used by the authors in [8]-[9] to obtain the grey-level variance values. The block processing approach divides the image into blocks of size W x W and the variance, V(k) for all the pixels in block k is then calculated from:
,
I(i,j) is the grey-level value for pixel i,j in block k and M(k) is the average grey-level value for block k.
B. Image Normalization
Normalization of the fingerprint image ridge structure is used for the standardization of the level of variations in the grey-level values that constitute the image. By normalization, the grey-level values are made to fall within certain range that is good enough for improved image contrast and brightness. This is done by firstly dividing the image into blocks of size S x S. A comparison is then made between the grey-level value for each pixel in the segmented image with the average grey-level value of the host block. Assumed value of M0 for the desired mean and assumed value of V0 for the desired variance are used for the comparison. For a pixel I(i,j) belonging to a block of average grey-level value of M, the normalized grey-level value N(i,j) is obtained from:
,
,
,
,
C. Image Filtering
Normalized fingerprint image is filtered for its enhancement. Filtering is used for preserving the true ridge and valley structures and for the removal of noises from the image. Fingerprint image filtering is in the following phases:
Orientation Estimation
In every fingerprint image, the ridges form patterns that flow in different directions. The direction of the flow of a particular ridge over a range of pixels as shown in Fig. 3 is the ridge orientation.
The derivation of the ridge orientation involves the following steps:
a. Firstly, blocks of size S x S are formed in the normalized image.
b. For each pixel, (p,q) in each block, the gradients (p,q)
and (p,q), which are the gradient magnitudes in the x
and y directions, respectively are computed. (p,q) is computed using the horizontal Sobel operator while
(p,q) is computed using the vertical Sobel operator.
c. The local orientation defined in (3) and (4) for each pixel in the image was computed using its S x S neighborhood in [8]-[9]. This was slightly modified in this research by dividing the image into S x S blocks and the local orientation for each block centered at pixel I(i,j) is then computed from:
, , , . .
, , ,
, tan ,,
where Ɵ(i, j) is the Least Mean Square (LSM) estimate of the local orientation at the block centered at pixel (i, j).
d. The orientation image is then converted into a continuous vector field defined by:
, cos , , , sin , ,
where and are the x and y components of the vector field, respectively.
e. Gaussian smoothing is then performed on the vector field as follows:
Horizontal Sobel Operator Vertical Sobel Operator
′ , , ,
′ , ∑ ∑ , ,
where G is a Gaussian low-pass filter of size .
f. The orientation field O of the block centered at pixel (i,j) is finally smoothed using the equation:
, tan ′′ ,,
Ridge Frequency Estimation
In any fingerprint image, there is a local frequency of the ridges that collectively form the ridge frequency image. The ridge frequency is obtained from the extraction of the ridge map from the image. The extraction of the ridge map involves the following steps:
a. Compute the consistency level of the orientation field in the local neighborhood of a pixel (p,q) with the following formula:
, , ∈ ∑| , , | (
| , , |
, , (13)
where W represents the n x n local neighborhood around (p,q), Ɵ(i,j) and Ɵ(p,q) are local ridge orientations at pixels (i,j) and (p,q) respectively.
b.If the consistency level is below a certain threshold Fc, then the local orientations in this region are re-estimated at a lower image resolution level until the consistency is above Fc. After obtaining the orientation field, the following two adaptive filters are then applied to the filtered image:
, , , √
, , ∈
√ , , ∈
, ,
(14)
, , , √
, , ∈
√ , , ∈
, ,
(15)
, ; (16)
, , (17) , , , (18) These two filters are capable of adaptively accentuating the local maximum grey level values along the normal direction of the local ridge orientation. The normalized image is first convolved with these two masks, ht (p,q, i, j) and hb (p,q, i, j). If both the grey level values at pixel (p,q) of the convolved images are larger than a certain threshold Fridge, then pixel (p,q) is labeled as a ridge.
Gabor Filtering
Gabor filtering is used to improve the fingerprint image. It is at this stage that the removal of noise takes place. The general form of Gabor filter is:
, : , cos
where f is the frequency of the cosine wave along the direction θ from the x-axis, and δx and δy are the space constants along x and y axes respectively. a= xsinƟ + ycosƟ and b= xcosƟ + ysinƟ.
The values of the space constants δx and δy for the Gabor filters were empirically determined as each is set to about half the average inter-ridge distance in their respective direction. δxand δy were obtained from δx = kxF and δy= kyF respectively. F is the ridge frequency estimate of the original image, and kx and ky are constant variables. The
value of δx determines the degree of contrast enhancement between ridges and valleys while the value of δy determines the amount of smoothing applied to the ridges along the local orientation.
D. Image Binarization/Thinning
The filtered image is binarized and thinned to obtain its best performance threshold. The method of image binarization proposed in [10] is employed. The Method assumes a threshold (T) that minimizes overlap and maintains a clear separation among clusters. To determine the actual value of T, the following operations were performed on set of presumed threshold values:
a. The pixels are separated into two clusters according to the threshold.
b. The mean of each cluster are determined.
c. The difference between the means is squared.
d. The product of the number of pixels in one cluster and the number in the other is determined.
The success of these operations depends on the difference between the respective mean of the clusters. The optimal threshold is the one that maximizes the between-class variance or, conversely, the one that minimizes the within-class variance. The within-class variance of each of the cluster is calculated as the weighted sum of the variances from:
∑
p(i) is the pixel value at location i, N is the intensity level and [0,N −1] is the range of intensity levels. The between-class variance, which is the difference between the within-class variance and the total variance of the combined distribution, is then obtained from:
24) (25) (26) where σ2 is the combined variance, μB(T) is the combine
mean for cluster T in the background threshold, μO(T) is the
combine mean for cluster T in the foreground threshold and
Substituting μ= nB(T)μB(T) +nO(T)μO(T) into (24), the result
is:
Using the following simple recurrence relations, the between-class variance is successfully updated by manipulating each threshold T using a constant value p as follows:
(28) (29) (30)
(31)
III. EXPERIMENTALRESULTS
The methods and algorithms described in this paper were implemented using MATLAB Version 7.2 on the Windows Vista Home Basic operating system. The experiments were performed on a Pentium 4 – 1.87 GHz processor with 1024MB of RAM. The purpose of the fingerprint enhancement experiments is to improve the quality of fingerprint images and make them more suitable for the minutia extraction module in any AFIS system. In order to evaluate the performance of the modified fingerprint enhancement algorithm, two sets of experiment were conducted. The first set of experiments was on synthetic images. The orientation estimation, ridge frequency estimation and Gabor filtering experiments all employed the
circsine function [11] to generate the synthetic images. The
major arguments passed into the circsine function include a number for the size of the square image to be produced, a number for the wavelength in pixels of the sine wave and an optional number specifying the standard pattern of behaviour to use in calculating the radius from the centre. This defaults to 2, resulting in a circular pattern while large values give a square pattern. The MATLAB imnoise
function was also used to generate noise and artifacts on the synthetic images. The arguments passed into the imnoise
function include the image in which noise is to be generated, the type of noise to be generated and the noise level. A set of real fingerprints images was enrolled by manual approach from the thumbs of some selected staff and students of the Federal University of Technology, Akure, Ondo State, Nigeria. The enrolled images were scanned at 500 dots per inch (dpi) with a scanner to obtain their digital versions at image size 250 x 310 and image type tagged image file
format (TIFF).
The performance of the image ridge orientation algorithms on zero level salt and pepper noise synthetic image shown in Fig. 4(a) is presented in Fig. 4(d). Its performance on a medium level salt and pepper noise image of Fig. 4(b) is presented in Fig. 4(e). Fig. 4(f) presents the performance of the algorithm on a high level salt and pepper noise synthetic image shown in Fig. 4(c). The synthetic images are of uniform size of 210 x 210 and wavelength 8. Fig. 4(a), 4(b) and 4(c) were derived using the imnoise function at noise level of 0, 0.20 and 0.30 respectively. Fig. 4(d), 4(e) and 4(f) show that the performance of the algorithm depends on the image noise level. When the noise level is within reasonable range, the algorithm does well as shown in Fig. 4(d) and 4(e). However, it produces misleading result as shown in
Fig. 4(f) when the noise level rises beyond the threshold which was found to be 0.29.
Fig. 4(g), 4(h) and 4(i) present the results of the ridge frequency estimation experiment on the synthetic image shown in Fig. 4(a), 4(b) and 4(c) respectively. Fig. 4(g) and 4(h) show that there is uniformity between the majority of the estimated frequency values for each 32 x 32 block in the image with zero or medium noise level. Hence, it is deduced that the used ridge frequency estimation algorithm is accurate for both well-defined and medium noise level images. However, visual inspection of the ridge frequency estimate presented in Fig. 4(i) for the high noise level image shown in Fig. 4(c) reveals that there exist a large number of image blocks with non-uniformity in wavelength estimate values. This is why it shows different pattern from the experimental results shown in Fig. 4(g) and 4(h). This also reveals that the ridge frequency estimation algorithm diminishes in performance as the image noise density increases beyond the threshold. The performance of the Gabor filtering algorithm on a zero, medium and high quality synthetic image of size 410 x 410 and wavelength 15 is presented in Fig. 5(d), 5(e) and 5(f) respectively. Parameter values of kx =0.45 and ky =0.45 were used to obtain these results. The results presented in Fig. 5(d) and 5(e) reveal that with zero or medium noise level, the filter effectively removed the noise from the image and enhanced it to a level that is comparable with the original image. This effective removal of noise is partly due to the previous accurate estimation of the ridge orientation and the ridge frequency for zero or medium noise level images. However, the experimental result presented in Fig. 5(f) reveals that when the filter is applied to images with high noise level, the filter is not able to effectively remove the noise, but produced a significant amount of spurious features. This poor enhancement is due to the inaccurate estimation of the ridge orientation and the ridge frequency due to high noise level.
When experiments were performed on real fingerprint images, the best results were obtained for image segmentation using variance threshold of 100. This threshold value provided best segmentation results in terms of differentiating between the foreground and the
(a) High quality
synthetic Image (b) medium quality synthetic Image (c) synthetic Image Poor quality
(d) Orientation
estimate of (a) (e) Orientation estimate of (b) (f) Orientation estimate of (c)
(g) Ridge frequency
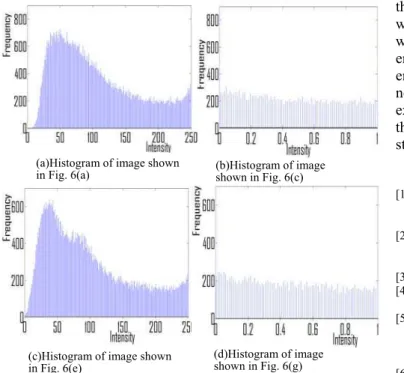
background regions. Fig. 6(b) and 6(f) are the results of the segmentation experiments on the images shown in Fig. 6(a) and 6(e) respectively. For these two results, the foreground regions are the regions containing the ridges and valleys while the background regions are the dark regions outside the foregrounds. The result of the normalization experiments are presented in Fig. 6(c) and 6(g) respectively. The ridges in the normalized images were normalized to a desired mean of zero and a variance of one. During normalization, the positions of the values are evenly shifted along the horizontal axis, which makes the structure of the ridges and valleys to become well and suitably positioned. The histogram plots of the original images shown in Fig. 6(a) and 6(e) are presented in Fig. 7(a) and 7(c) respectively. The histogram plots show that all the intensity values of the ridges in the images show irregular frequency values and also fall within the right hand side of the 0–250 scale, with no pixels in the left hand side. This leads to images with a very low contrast, as shown in Fig. 6(a) and 6(e). The histogram plots of the normalized images shown in Fig. 6(c) and 6(g) are presented in Fig. 7(b) and 7(d) respectively. Visual inspection of the plots reveals that the range of intensity values for the ridges has been adjusted between 0-1 scale such that there is a more evenly and balanced distribution between the dark and light pixels and that the ridge frequencies fall within close values. The plots also show that the normalization process does distribute evenly the shape of the original image. The positions of the values are evenly shifted along the x-axis, which means the structure of the ridges and valleys are now well and suitably positioned. This shifted and improved positioning lead to images with a very high contrast shown in Fig. 6(c) and 6(g).
The orientation field for the images was obtained around their singular points since they are prominent features used in any AFIS for fingerprint classification and matching. The orientation estimates for the images shown in Fig. 6(a) and 6(e) are presented in Fig. 6(d) and 6(h) respectively. At the singular points in Fig. 6(d) and 6(h), the orientation field is discontinuous and unlike the normal ridge flow pattern, the ridge orientation varies significantly. From these results, it is observed that there exists no deviation between the actual fingerprint ridge orientation and the estimated orientation of the vectors. In both cases, the algorithm produces accurate estimate of the orientation vectors such that they flow smoothly and consistently with the direction of the ridge structures in the images. In the superimposed version of images in Fig. 6(d) and 6(h), the contrast of the original
image is lowered in each case. This was done to improve the visibility of the orientation vectors against the background. Visual inspection of the results for the ridge frequency estimation experiments shown in Fig. 6(i) and 6(m), reveal that the ridge frequency estimate differs for the two images. This difference is attributed to the fact that the two fingerprints do not exhibit the same average ridge frequency characteristics. Variation in the average ridge frequency is attributed to difference in contrast levels as shown in the histogram plots. The intensities of frequency also differ for blocks or regions within same image. Some blocks or regions exhibit high contrast while others exhibit low contrast. Based on this, the synthetic images are more appropriate for the evaluation of the accuracy of the ridge frequency estimation algorithm.
Fig. 6(j) and 6(n) reveal how the filtering experiment was used to effectively remove noise and artifacts from the images. These results were obtained using parameter values of kx= 0.45 and ky= 0.45. With these values, the degree of
contrast enhancement between ridges and valleys is improved and the smoothing is applied to the ridges along the local orientation. The results of the binarization experiments are presented in Fig. 6(k) and 6(o). The binarization experiment is used to separate the ridges (black pixels) from the valleys (white pixels). The results of the thinning experiment are presented in Fig. 6(l) and Fig. 6(p). The MATLAB’s bwmorph operation using the ‘thin’ option was used to generate the thinned images. These results show that the ridge thickness in each of the images has been reduced to its smallest form or skeleton (one pixel wide). It
(a) Original synthetic image
Fig. 5: Results of applying a Gabor filter on synthetic images of different noise levels.
(b) Minimally
Noisy image (c) Highly Noisy image
(d) Filtered
image of (a) (e) image of (b) Filtered (f) image of (c) Filtered
(a) Left loop image
(b)Segmented image of (a)
(c)Normalized image of (a)
(d)Orientation estimate of (a)
(e) Whorl image
(f)Segmented
image of (e) (g)Normalized image of (e)
(h)Orientation estimate of (e)
(i) Ridge frequency of (a)
(j) Filtered image of (a)
(k) Binarized image of (a)
(l) Thinned image of (a)
(m) Ridge frequency of (e)
(n) Filtered image of (e)
(o) Binarized image of (e)
(p) Thinned image of (e)
Fig. 6: Results of enhancement on images
is also shown that the connectivity of the ridge structures is well preserved.
IV. CONCLUSION
This report discussed the implementation of a modified vers ion of a fingerprint enhancement algorithm proposed in [8]-[9]. Some stages of the algorithm were slightly modified for improved performance. For instance, block processing approach was introaduced into the orientation estimation algorithm in place of the pixel processing approach. While the pixel processing approach subjects each pixel in the image to enhancement, the block processing approach firstly divides the image into S x S blocks before subjecting each block to enhancement. Some values were also varied from those used in [8]-[9]. For instance, parameter values of kx =0.45 and ky =0.45 were found to perform well in the image filtering experiments as against kx =0.5 and ky =0.5 used in [8]-[9].
The results of the experiments conducted for image segmentation, normalization, ridge orientation estimation, ridge frequency estimation, Gabor filtering, binarization and thinning on synthetic and real fingerprint images reveal that with free or minimal noise level, the algorithms perform well. The results also show that each stage of the enhancement process is important for obtaining a finally enhanced image that is acceptable and presentable to the next stage of fingerprint processing which is features extraction. The results obtained from the final stage of thinning show that the connectivity of the image ridge structure has been preserved at each stage.
REFERENCES [1] C. Roberts, ‘Biometrics’:
( http://www.ccip.govt.nz/newsroom/informoation-notes/2005/biometrics.pdf, Accessed: July, 2009
[2] C. Michael and E. Imwinkelried, ‘Defence practice tips, a cautionary note about fingerprint analysis and reliance on digital technology’, Public Defense Backup Centre Report., 2006
[3] M. J. Palmiotto, ‘Criminal Investigation’. Chicago: Nelson Hall, 1994 [4] D. Salter, ‘Fingerprint – An Emerging Technology’, Engineering
Technology, New Mexico State University, 2006
[5] J. Tsai-Yang, and V. Govindaraju, A minutia-based partial fingerprint recognition system, Center for Unified Biometrics and Sensors, University at Buffalo, State University of New York, Amherst, NY USA 14228, 2006
[6] O. C. Akinyokun, C. O. Angaye and G. B. Iwasokun, ‘A Framework for Fingerprint Forensic’; Proceeding of the First International Conference on Software Engineering and Intelligent System, organized and sponsored by School of Science and Technology, Covenant University, Ota, Nigeria, 2010, pages 183-200.
[7] O. C. Akinyokun and E. O. Adegbeyeni, ‘Scientific Evaluation of the Process of Scanning and Forensic Analysis of Fingerprints on Ballot Papers’, Proceedings of Academy of Legal, Ethical and Regulatory Issues, Vol. 13, Numbers 1, New Orleans, 2009.
[8] L. Hong, Y. Wan and A. Jain, ‘Fingerprint image enhancement: Algorithm and performance evaluation’; Pattern Recognition and Image Processing Laboratory, Department of Computer Science, Michigan State University, 2006, pp1-30
[9] T. Raymond, Fingerprint Image Enhancement and Minutiae Extraction, PhD Thesis Submitted to School of Computer Science and Software Engineering, 2003, University of Western Australia. [10] X. Liang, ‘Image Binarization using Otsu Method’. Proceedings of
NLPR-PAL Group CASIA Conference, 2009, pp345-349
[11] P Kovesi, ‘MATLAB functions for computer vision and image analysis’, School of Computer Science and Software Engineering,
University of Western Australia, http:/www.cs.uwa.edu.au/~pk/Research/MatlabFns/Index.html,
Accessed: 20February 2010. (a)Histogram of image shown
in Fig. 6(a) (b)Histogram of image shown in Fig. 6(c)
(c)Histogram of image shown in Fig. 6(e)
(d)Histogram of image shown in Fig. 6(g)