Uptake and Effects of Six Rare Earth
Elements (REEs) on Selected Native and Crop
Species Growing in Contaminated Soils
David Carpenter1, Céline Boutin1*, Jane E. Allison1,2, Jessica L. Parsons1,3, Deanna M. Ellis1
1Science & Technology Branch, Environment Canada, Ottawa, Ontario, Canada,2Department of Biology, Ottawa—Carleton Institute of Biology, University of Ottawa, Ottawa, Ontario, Canada,3Department of Biology, Ottawa—Carleton Institute of Biology, Carleton University, Ottawa, Ontario, Canada
Abstract
Rare earth elements (REEs) have become increasingly important metals used in modern technology. Processes including mining, oil refining, discarding of obsolete equipment con-taining REEs, and the use of REE-concon-taining phosphate fertilizers may increase the likeli-hood of environmental contamination. However, there is a scarcity of information on the toxicity and accumulation of these metals to terrestrial primary producers in contaminated soils. The objective of this work was to assess the phytotoxicity and uptake from contaminat-ed soil of six REEs (chloride forms of praseodymium, neodymium, samarium, terbium, dys-prosium, and erbium) on three native plants (Asclepias syriacaL.,Desmodium canadense
(L.) DC.,Panicum virgatumL.) and two crop species (Raphanus sativusL.,Solanum lyco-persicumL.) in separate dose-response experiments under growth chamber conditions. Limited effects of REEs were found on seed germination and speed of germination. Effects on aboveground and belowground biomass were more pronounced, especially for the three native species, which were always more sensitive than the crop species tested. Inhibition concentrations (IC25 and IC50) causing 25 or 50% reductions in plant biomass respectively, were measured. For the native species, the majority of aboveground biomass IC25s (11 out of 18) fell within 100 to 300 mg REE/kg dry soil. In comparison to the native species, IC25s for the crops were always greater than 400 mg REE/kg, with the majority of results (seven out of 12) falling above 700 mg REE/kg. IC50s were often not detected for the crops. Root biomass of native species was also affected at lower doses than in crops. REE uptake by plants was higher in the belowground parts than in the above-ground plant tissues. Results also revealed that chloride may have contributed to the sensitivity of the native species, Des-modium canadense, one of the most sensitive species studied. Nevertheless, these results demonstrated that phytotoxicity may be a concern in contaminated areas.
OPEN ACCESS
Citation:Carpenter D, Boutin C, Allison JE, Parsons JL, Ellis DM (2015) Uptake and Effects of Six Rare Earth Elements (REEs) on Selected Native and Crop Species Growing in Contaminated Soils. PLoS ONE 10(6): e0129936. doi:10.1371/journal.pone.0129936
Academic Editor:P.C. Abhilash, Banaras Hindu University, INDIA
Received:January 12, 2015
Accepted:May 14, 2015
Published:June 15, 2015
Copyright:© 2015 Carpenter et al. This is an open access article distributed under the terms of the
Creative Commons Attribution License, which permits unrestricted use, distribution, and reproduction in any medium, provided the original author and source are credited.
Data Availability Statement:All relevant data are within the paper and its Supporting Information files.
Introduction
Rare earth elements (hereafter referred to as REEs) are metals of the lanthanoid series in the pe-riodic table. Though they are termed“rare”, REEs are in fact commonly found in soils world-wide [1]; the classification of“rare”solely refers to the lack of large deposits or ores that are characteristic of other elements such as silver and gold.
Once widely mined, China’s low production cost for REEs in the 1990s significantly reduced the prices of REEs globally and consequently many other mines stopped extracting these valu-able elements [2]. As a result, China currently mines and produces approximately 95% or more of the world’s supply of REEs [3], and thus has a monopoly on these critical resources. Howev-er, in recent years China has reduced its production and export of REEs to protect its industry and to decrease the environmental impacts that may result from REE mining [4]. To supple-ment their supplies, other countries including Canada and the USA (a former producer of REEs) have begun the process of researching, developing or reopening REE mining facilities. Of particular interest in North America are sites at Thor Lake, Northwest Territories [5] and Strange Lake, Quebec [6] in Canada, and the pre-existing REE mine at Mountain Pass in Cali-fornia, USA [7].
REEs are mined primarily for their usefulness in modern technologies, with many applica-tions for green-technology developments [8,9,10,11,12]. Their most important usages are as components of high strength magnets in electronic equipment, in wind turbines and electric vehicles, for precision guided weapons, and in computers, audio equipment and automobiles, amongst others. They are also used in low quantities as fluid cracking catalysts during oil refin-ing, in the production of optical glass and as components in phosphors for energy efficient lighting [11].
The risks of REE pollution due to mining and processing as well as from the improper dis-posal of materials containing these compounds could potentially lead to elevated levels within the environment. In addition, the processing of REE rich monazite rocks for the production of phosphate fertilizers and the subsequent applications of these fertilizers could further elevate REE soil concentrations, especially in agricultural areas [13,14,15]. In Canada, these fertilizers are commonly used within agriculture in the prairies, with application levels in the late 1990s reaching 775 000 tonnes per year [16]. Sneller et al. [17] reported that approximately 85 tonnes of neodymium (Nd) were released into the environment from phosphate fertilizer production in the Netherlands in 1994. Slooff et al. [18] reported that industrial emissions in air and water due to fertilizer production in the Netherlands can contain over 500 mg/kg of REEs. Petroleum refining processes can release similar amounts of REEs into the environment. In the USA, an estimated 60–80 tonnes of REEs per day are released into the atmosphere by oil refineries [18].
In a study conducted by Li et al. [19], it was found that REE soil pollution due to tailings from an REE processing plant in China can travel up to approximately seven kilometers before soil concentrations stabilize to natural levels. Specifically, Nd and praseodymium (Pr) levels in relation to the source were found to be, respectively, 5726 and 1614 mg/kg at 0.4 km, 2266 and 650 mg/kg at 0.8 km, 1279 and 373 mg/kg at 1.3 km, and 310 and 85 mg/kg at 2.1 km [19]. Slooff et al. [18] also report that soils in polluted sites near industrial locations in the Netherlands con-tain high levels of REEs [800–900 mg/kg cerium (Ce), 500–700 mg/kg lanthanum (La), 400 mg/ kg Nd and 100 mg/kg Pr], which are at least 100 times higher than background levels. Concen-trations in mining areas in China reached upwards of 200 times that of baseline earth crust levels for most REEs, including Pr, Nd and samarium (Sm) [20]. For these reasons, toxicity monitoring will become crucial as REE mining activities commence in Canada and other countries.
Studies have indicated that REEs can be absorbed by plants due to the similar ionic radii that they share with calcium [21,22]. As a result, REEs may replace calcium molecules in a
data collection and analysis, decision to publish, or preparation of the manuscript.
number of physiological processes involving proteins and enzymes, including root growth, photosynthesis, and flowering [15,21,23,24,25]. However, the mechanism of action of REEs in plants is still poorly understood [15]. Many studies have documented the presence of REEs in both the roots and shoots of a variety of different plant species; however, in these cases, the studies were conducted on plants growing in soils containing low, natural levels of the REEs [26,27,28,29]. Toxicological studies on the effects of REE soil contamination on plants are lack-ing, as the majority of research has been conducted under hydroponic growth conditions [21,30,31]. A wide range of reports from China, where REE fertilizers are regularly applied to crops, report stimulatory, positive effects of various REEs on different aspects of plant metabo-lism, growth and yield [22,32,33,34]. However, many of these positive effects are only observed at low doses of the REEs, with negative effects becoming apparent as dosages are increased [34]. Reported detrimental effects of elevated levels of REEs on plants include: decreased growth, root function and nutritional uptake [31,35]; reduced root elongation (erbium, Er [36]); decreased seed germination (La and mixed REE solution [37]); and chloroplast damage (terbium, Tb [38]).
The importance of studying plants in the environmental assessment of contaminants can often be overlooked in favor of other organisms. For instance, Li et al. [19] observed that the soil macrofauna diversity near a REE processing plant in China was decreased at high REE con-centrations, but unfortunately plant biodiversity and toxicity was not assessed. Plants, however, can serve as strong indicators of environmental health since they are literally grounded and cannot escape the presence of contaminants. In addition, since they are the primary producers of many ecosystems they serve as a major entryway for many contaminants into the food chain. For instance, Cowgill [39] observed uptake of several REEs by water-lilies (Nymphaea odorataAiton) and subsequently found these metals in aphids that fed on this species.
In a previous paper, two light rare earth elements (LREEs) elements (La and Ce) as well as yt-trium (Y) were examined for their toxicity to crops and native plants [35]. In this companion study we seek to assess the uptake and phytotoxicity of three light and three heavy rare earth ele-ments (HREEs), on the germination and biomass of five plant species (three wild, native Canadi-an species Canadi-and two crops) grown in soils contaminated with increasing concentrations of REEs.
Materials and Methods
REE background information
Soil preparation
An artificial soil was prepared following Environment Canada (EC) protocols [EC Formulation of Artificial Soil (SOP 15.09/1.3/S)] consisting of 10% peat (Premier Sphagnum Peat Moss, Rivi-ère-du-Loup, Quebec, Canada), 20% pulverized Kaolin clay (Edgar Minerals Inc., Edgar, Flor-ida, USA) and 70% silica sand (OptaMinerals, Waterdown, Ontario, Canada) by dry weight. New batches of soil were prepared for each experiment, except in the cases of Dy and Er where the experiments were run concurrently. To ensure soil homogenization, soil was prepared in small 2.7 kg batches that were thoroughly mixed using a commercial grade electrical mixer (Axis M-20, Axis Equipment, Montreal, Quebec, Canada). Five hundred milliliters of water was added to each batch of soil in order to attain an initial soil moisture content of approximately 20%. To adjust the pH of the soil to the desired pH range (approximately pH = 6), and to com-pensate for the acidity of the peat (pH varying from 3.10–4.17), calcium carbonate was added at a rate of 15.0–25.5 g per batch of soil. The resulting soil pH was 5.80 ± 0.03 to 5.85 ± 0.02. The cation exchange capacity (CEC) of this soil blend was previously found to be approximately 7.7 ± 0.3 meq/100 g (analyses performed by EXOVA laboratory, Ottawa, ON, Canada using the ammonium acetate extraction method [48]). Once mixed, all soils were placed into large plastic storage containers and were allowed to settle for at least two days prior to use.
Plant species
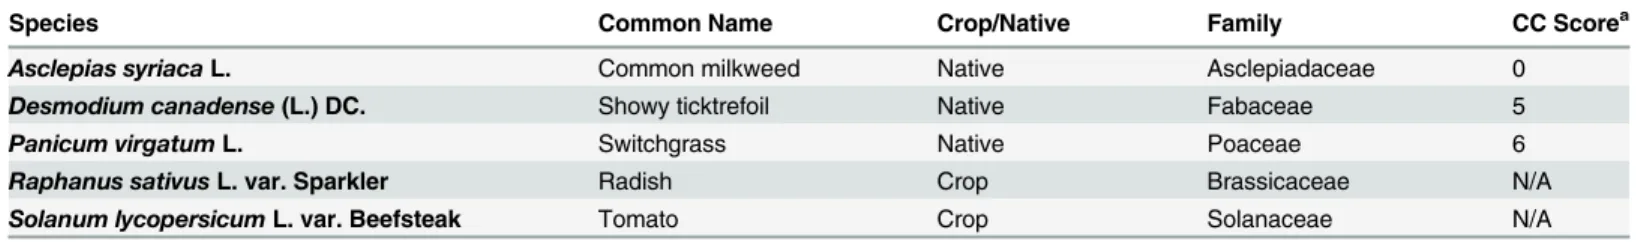
Five plant species were tested in each experiment: three native, wild species with wide distribu-tion ranges and of high ecological values as well as two crop species because crops are primarily used in toxicity testing. The native species consisted of common milkweed (Asclepias syriaca
L.), showy ticktrefoil (Desmodium canadense(L.) DC.) and switchgrass (Panicum virgatumL.), and the two crops were radish (Raphanus sativusL.) and tomato (Solanum lycopersicumL.) (Table 1).Desmodium canadenseandP.virgatumwere selected based on their high coefficients of conservation [49] (Table 1), whileA.syriacawas chosen based on its importance to native fauna (i.e. monarch butterfly). All native species were found to have seed germination rates of >70% in Petri-dish pre-trials. Due to a stratification requirement, seeds ofA.syriacawere cold
stratified in a 4°C refrigerator for approximately one to two months prior to the beginning of each experiment; no other seeds required stratification.
Experimental setup
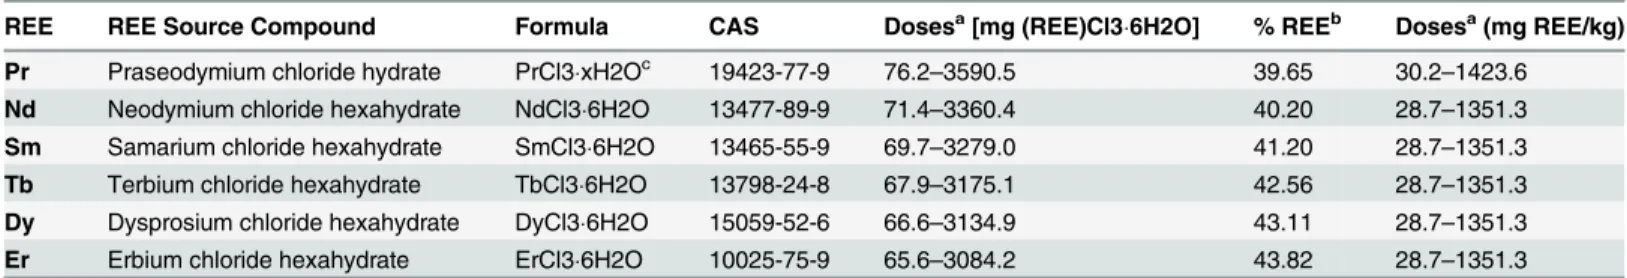
For all experiments, the chloride hydrate forms of each REE (Table 2) were selected as the source compound of the REE due to their high solubility in water. All compounds were pur-chased from Sigma Aldrich Canada Co., Oakville, ON. For all REEs except Pr, seven nominal doses (plus controls) of the REE chloride hexahydrate were chosen following the same
Table 1. Plant species tested in the rare earth element (REE) experiments.
Species Common Name Crop/Native Family CC Scorea
Asclepias syriacaL. Common milkweed Native Asclepiadaceae 0
Desmodium canadense(L.) DC. Showy ticktrefoil Native Fabaceae 5
Panicum virgatumL. Switchgrass Native Poaceae 6
Raphanus sativusL. var. Sparkler Radish Crop Brassicaceae N/A
Solanum lycopersicumL. var. Beefsteak Tomato Crop Solanaceae N/A
aCC Score—Coefficient of conservation. Available only for native (wild) species. Scores range between 0 and 10 [49]. Higher numbers indicate plants of
higher conservation value as they have higherfidelities to specific sets of ecological/habitat variables.
geometric progression of 1.9 in order to produce equivalent nominal doses for each compound (Table 2). In the case of Pr, since the true hydrate form was not clearly known (communication with Sigma Aldrich indicated that it was most likely a hexahydrate; however the heptahydrate is also common), the nominal doses for this compound were increased, but the same geometric progression of 1.9 was followed with the assumption that the source compound was of the hexahydrate form. The amount of (REE)Cl36H2O to add to each dose was determined based on the percentage of the specific REE in the given compound. For simplicity, all results are based on and reported in terms of mg REE/kg dry soil.
To contaminate the soil, approximately 10.5 kg of soil, or the equivalent of 300 g of artificial soil per pot (pot dimensions: 10 cm x 10 cm x 9 cm), was added to a large plastic container. Measured amounts of the (REE)Cl36H2O (depending on the REE and the dose) were dissolved in one liter of water. This solution was then poured slowly into the container and mixed thor-oughly into the soil. To further hydrate the soil, an additional two liters of water was added to each batch by rinsing the solution flask in order to also ensure that all metal residues reached the soil. Once thoroughly mixed, the soil was split between the 35 replicates in the dose treat-ment. This was repeated for all (REE)Cl36H2O treatments, starting with the smallest dose. Control treatments were prepared in a similar fashion, with the exception that only three liters of water was added to the soil in order to maintain hydration consistency with the (REE) Cl36H2O contaminated batches. For all doses (including the controls), one pot of excess soil was bagged and refrigerated for soil REE concentration analysis (pre-experiment samples). Once prepared, all soil pots were transferred to growth chambers (Conviron, model PGW36, Winnipeg, Manitoba, Canada) and were left to settle for 24 hours before seeds were planted.
Seven replicates per species were used for each dose as well as the controls giving a total of 35 pots per dose, for 280 pots in each experiment, and 1680 pots overall. For each species, five seeds were planted per pot/replicate, per dose for a total of 280 seeds per species per experiment. Artificial light within the growth chambers followed a 16 hour light:8 hour dark light-cycle, with an average photosynthetic active radiation of 314 ± 4μmol photons/m2/s during the day. Temperature within the module averaged 26.4 ± 0.5°C during the day cycle and 15.1 ± 0.1°C during the night. In order to ensure uniformity of conditions and to prevent confounding envi-ronmental factors, all plant trays were rotated within the growth chamber on a weekly basis.
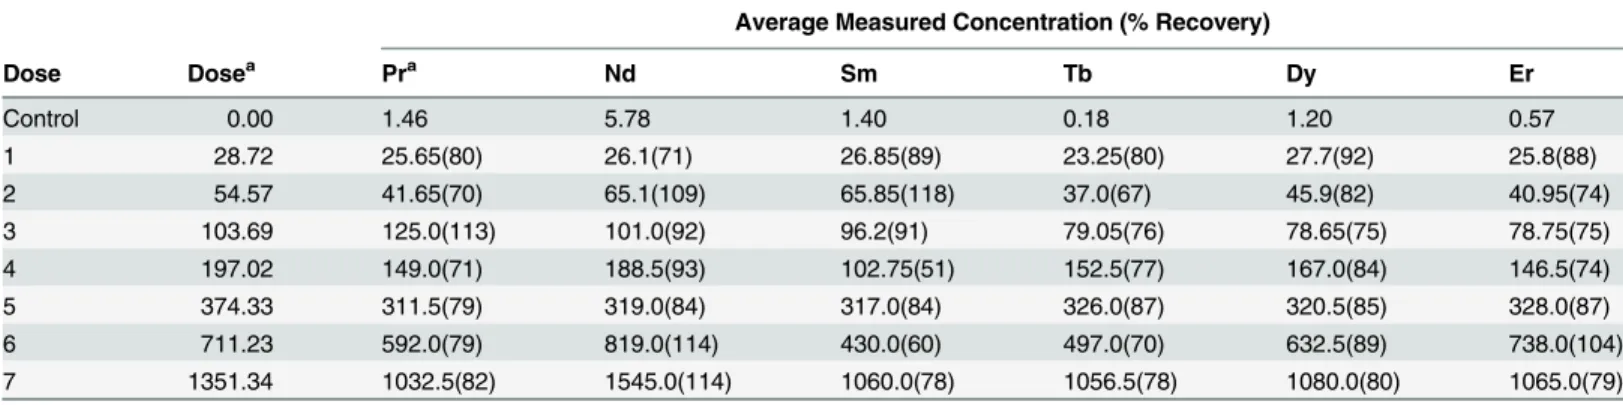
Analysis of soil samples for the presence of Pr, Nd, Sm, Tb, Dy, and Er was performed by Brooks Rand Labs (Seattle, Washington, USA) in order to validate the soil contamination method used in this experiment. Two soil samples from each dose (one pre-, one post-experi-ment) from each experiment were analyzed separately for their corresponding REE concentra-tion using a modified USEPA Method [50]. The pre-experiment soil sample was collected from Table 2. Sources of rare earth elements (REEs) and range of doses used for all REE soil exposure experiments.
REE REE Source Compound Formula CAS Dosesa[mg (REE)Cl36H2O] % REEb Dosesa(mg REE/kg)
Pr Praseodymium chloride hydrate PrCl3xH2Oc 19423-77-9 76.2–3590.5 39.65 30.2–1423.6
Nd Neodymium chloride hexahydrate NdCl36H2O 13477-89-9 71.4–3360.4 40.20 28.7–1351.3
Sm Samarium chloride hexahydrate SmCl36H2O 13465-55-9 69.7–3279.0 41.20 28.7–1351.3
Tb Terbium chloride hexahydrate TbCl36H2O 13798-24-8 67.9–3175.1 42.56 28.7–1351.3
Dy Dysprosium chloride hexahydrate DyCl36H2O 15059-52-6 66.6–3134.9 43.11 28.7–1351.3
Er Erbium chloride hexahydrate ErCl36H2O 10025-75-9 65.6–3084.2 43.82 28.7–1351.3
aIn all cases, seven doses (+ controls) were used, with successive doses following a geometric progression of 1.9.
b%REE refers to the ratio of the molar mass of the rare earth element to the molar mass of the REE source compound, and is given as a percentage. cThe true hydrate form was not clearly known although it was most likely a hexahydrate.
the soil during the initial contamination (as mentioned above). The post-experiment samples were obtained after the plants were harvested by homogenizing soil samples from all pots of a given dose and after removing any remaining plant debris.
To examine the possible effect of chloride (Cl) on plant growth as a result of using Cl forms of the REEs, an experiment was conducted on all plant species using calcium chloride (CaCl2). Five chloride doses (62.5, 125, 250, 500, and 1000 mg Cl/kg dry soil) and two control doses (one with CaCO3added to balance the Ca level with the highest Cl dose, and one with no CaCO3added) were used. All other methodologies followed those used for the REE experi-ments, though the resulting soil pH was slightly lower (approximately pH = 5.6).
Germination and harvest
Seed germination was recorded daily for all species by checking each pot for the presence of emerging cotyledons. Approximately one week after the control pots for a given species had reached 70% seed germination, all pots for that species were thinned to one plant per pot. To prevent bias, a random number generator was used to determine which seedling was left in the pot. Due to the uneven germinating times and sizes ofD.canadenseseedlings within a given pot, the alternate approach of leaving the largest seedling was preferred for all REE experiments.
In a previous experiment [51], it was found that plants growing in the artificial soil (as per the EC protocol) and not supplied with nutrients failed to grow past the first true leaf stage, thus limiting the possibility of detecting any real toxicological effects on exposed plants in long-term studies. To supplement the low nutrient artificial soil, fertilizer (Plant-Prod 20-20-20 All Purpose Fertilizer) was added to all pots on day 16 for Sm, day 17 for Nd and Tb, and day 18 for Pr, generally after all species had been thinned to one seedling per pot (D.canadense
in the Sm experiment was fertilized prior to thinning). Due to an error, all pots in the Er experi-ment were fertilized on day 0 (pre-thinning) while all those of Dy were fertilized on day 24 (post-thinning). Fertilizer was prepared by dissolving 7.8 g of the soluble fertilizer in 1 L of water to make a stock solution. From the stock solution, 8.30 mL (approximately 65 mg of fer-tilizer) was added to each pot by pipette. The amount of fertilizer was calculated based on the recommended fertilization rates for the crop species (10% of the recommended doses for rad-ish,R.sativus, and tomato,S.lycopersicum, was applied).
All plants of a given species were harvested 28 days after their respective controls had at-tained 70% germination. All aboveground biomass was collected by cutting the plant at the base of the soil, rinsing with water to remove residual soil debris, and placing it in a paper bag. ForR.sativus, the belowground bulb was also harvested, rinsed, and bagged. In addition, all plants from the controls, as well as the 2nd, 4thand 6thnominal doses were selected for root characterization for all species. Soil was separated from the roots delicately by hand in a water basin and the roots rinsed under running water to remove excess soil debris. The roots were bagged separately for biomass determination. All plant material (shoots and roots) was placed in a drying oven for at least two days at approximately 70°C prior to dry biomass measure-ments. After the biomass was recorded, all dried plant material was pooled by REE, type (shoot or root), dose, and species for REE uptake/accumulation analysis. Only the controls, 2nd, 4th, and 6thdoses were evaluated. ForR.sativus, radish bulbs were included with the root portion of the corresponding samples for the root REE concentration analyses. All plant samples were analyzed by Brooks Rand Labs using ICP-MS, and were processed and stored according to their standard operating procedures and EPA methodology.
Due to an unknown event, several control plants ofA.syriaca(n = 4),D.canadense(n = 4),
not determine the reason behind this event, all affected replicates were eliminated from all bio-mass statistical analyses; seedling germination data was unaffected and was thus still included for these replicates. No plants ofP.virgatumwere affected, and therefore all seven replicates for this species were used in biomass related analyses. In addition, due to accidental damage in-curred while thinning the pots to one seedling, oneP.virgatumreplicate from the 207.7 mg Pr/ kg nominal dose was eliminated from all biomass (shoot and root) related analyses due to stunted growth. However, due to minimum biomass weight requirements for Pr plant concen-tration analyses, it was included in the sample that was analyzed by Brooks Rand Labs.
Statistical analysis
Statistical analyses were performed in Systat 13 (Version No.13.00.05). All analyses were run separately for each REE evaluated.
Germination. Total percent germination was recorded for all pots over the course of each experiment. In addition, in order to determine if there were time delays in seed germination at different REE doses, speed of seed germination was calculated. This parameter is a more sensi-tive measure than total percent germination as it gives more weight to earlier germinating seeds and thus may detect subtle delays in germination even when all seeds germinate. Speed of germination was determined for all species based on the number of seedlings that germinat-ed in each pot per day until the end of the experiment and was calculatgerminat-ed using the formula:
X N1
1 þ
N2 2 þ
N3 3 þ
. . .þNi i
Where:
N1 = # of new seeds germinating on Day 1,N2 = # of new seeds germinating on Day 2, etc. andNi= # of new seeds germinating on Dayi
Speed of germination was determined individually for each pot. Seven values were thus ob-tained for each dose per species.
ANOVA, or the non-parametric Kruskal-Wallis test, was used to determine the effects of REE dose on the germination of each species. The Kruskal-Wallis test was only performed if the ANOVA model assumptions of normality of residuals (Shapiro-Wilk test) or homogeneity of variance (Levene’s test) could not be met, even after transformation of the data. In all cases where a significant effect (p<0.05) was observed, post hoc comparisons (ANOVA: Dunnett’s one-sided; Kruskal-Wallis: Conover-Inman test) were used to determine which doses were sig-nificantly lower than the controls.
Biomass. Inhibition concentrations (IC25 and IC50) causing 25 or 50% reductions in plant aboveground biomass (including the radish bulb forR.sativus) respectively, as compared to the controls, were calculated using non-linear regression model analyses [52] when the model as-sumptions of homogeneity of variance (Levene’s test) and normality of residuals (Shapiro-Wilk test) were met. For the cases where the parametric model assumptions could not be met, even after data transformations, the nonparametric ICPIN program [53] was used to determine the IC values. Average measured concentrations in soil were used for calculating ICs (Table 3).
To determine differences in root growth amongst the doses of a given REE, ANOVA or Kruskal-Wallis test were performed on root dry biomass in accordance with the model as-sumptions. Comparisons between doses were made using Dunnett’s one-way post hoc test or Conover-Inman test. The radish bulb was included in this measure forR.sativus.
Effects of chloride on plant biomass were assessed using ANOVA and Tukey’s honestly-sig-nificant-difference post hoc test to detect significant differences between the Cl doses and the controls where applicable.
Results
REE soil concentrations
All REEs were detected in all soils analyzed by Brooks Rand Labs, including the control soils (Table 3). Recovery rates for the REE-spiked soils were consistently high (>70% recovery), with lower than expected recovery rates only apparent for doses four and six in the Sm experi-ment and dose two in the Tb experiexperi-ment. Since REEs were detected in the control soils, doses used for all statistical analyses also included these background levels.
Seed germination
Percent seed germination was found to be unaffected by exposure to REEs (Kruskal-Wallis tests or ANOVA, p>0.05 for all species-REE combinations, seeS1 TableandS2 Table), with one exception. Slightly fewerR.sativusseeds germinated in the 1stdose of the Tb experiment as compared to the controls (Kruskal-Wallis test,χ2= 16.923, df = 7, p = 0.018). However, since no effects were observed at the higher doses, this was attributed to overall seed viability within that specific dose rather than to Tb toxicity.
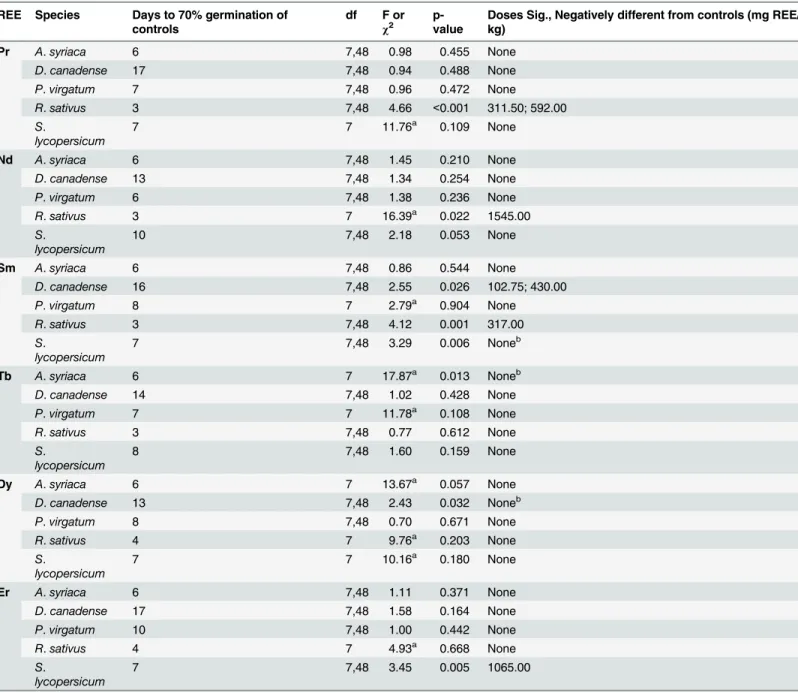
Exposure to REEs in the soil did not have major negative effects on the speed of germination of most species (Table 4;S1 Table). As compared to the controls, only seeds ofR.sativusin the Nd experiment and those ofS.lycopersicumin the Er experiment were found to have reduced germination rates at the highest dose evaluated (1545 mg Nd/kg and 1065 mg Er/kg respective-ly;Table 4). In addition, though statistical negative effects were observed at lower doses for bothR.sativusin Pr and Sm soils andD.canadensein Sm soils, the negative effect did not per-sist at the highest dose evaluated in each situation.
Table 3. Average measured concentrations of rare earth elements (mg REE/kg dry soil) in control and dosed soils as compared to the expected nominal doses.
Average Measured Concentration (% Recovery)
Dose Dosea Pra Nd Sm Tb Dy Er
Control 0.00 1.46 5.78 1.40 0.18 1.20 0.57
1 28.72 25.65(80) 26.1(71) 26.85(89) 23.25(80) 27.7(92) 25.8(88)
2 54.57 41.65(70) 65.1(109) 65.85(118) 37.0(67) 45.9(82) 40.95(74)
3 103.69 125.0(113) 101.0(92) 96.2(91) 79.05(76) 78.65(75) 78.75(75)
4 197.02 149.0(71) 188.5(93) 102.75(51) 152.5(77) 167.0(84) 146.5(74)
5 374.33 311.5(79) 319.0(84) 317.0(84) 326.0(87) 320.5(85) 328.0(87)
6 711.23 592.0(79) 819.0(114) 430.0(60) 497.0(70) 632.5(89) 738.0(104)
7 1351.34 1032.5(82) 1545.0(114) 1060.0(78) 1056.5(78) 1080.0(80) 1065.0(79)
Values for control soils represent the detected background REE levels in the artificial soil. Percent recovery for dosed soils, calculated as: (average [REE] measured at a given dose—average measured [REE] in control soils) / (nominal dose), are presented in parentheses.
a
Nominal doses for Pr were 0.00, 30.21, 57.40, 109.50, 207.68, 393.47, 747.66, and 1423.59; % recovery for Pr was based on these values.
Aboveground biomass
—
Inhibition concentrations
Effects on shoot biomass, as determined through IC analyses, varied between REEs and be-tween species within a given REE (Table 5). For all REEs, the three native species,A.syriaca,D.
canadense, andP.virgatum, were always more sensitive than the two crops,R.sativusandS.
lycopersicum. For the native species, the majority of IC25s (11 out of 18) fell within 100 to 300 Table 4. Analyses (ANOVA or Kruskal-Wallis test) of the effects of rare earth element (REE) soil dosage on the speed of germination of five plant species.
REE Species Days to 70% germination of controls
df F or
χ2
p-value
Doses Sig., Negatively different from controls (mg REE/ kg)
Pr A.syriaca 6 7,48 0.98 0.455 None
D.canadense 17 7,48 0.94 0.488 None
P.virgatum 7 7,48 0.96 0.472 None
R.sativus 3 7,48 4.66 <0.001 311.50; 592.00 S.
lycopersicum
7 7 11.76a 0.109 None
Nd A.syriaca 6 7,48 1.45 0.210 None
D.canadense 13 7,48 1.34 0.254 None
P.virgatum 6 7,48 1.38 0.236 None
R.sativus 3 7 16.39a 0.022 1545.00
S.
lycopersicum
10 7,48 2.18 0.053 None
Sm A.syriaca 6 7,48 0.86 0.544 None
D.canadense 16 7,48 2.55 0.026 102.75; 430.00
P.virgatum 8 7 2.79a 0.904 None
R.sativus 3 7,48 4.12 0.001 317.00
S.
lycopersicum
7 7,48 3.29 0.006 Noneb
Tb A.syriaca 6 7 17.87a 0.013 Noneb
D.canadense 14 7,48 1.02 0.428 None
P.virgatum 7 7 11.78a 0.108 None
R.sativus 3 7,48 0.77 0.612 None
S.
lycopersicum
8 7,48 1.60 0.159 None
Dy A.syriaca 6 7 13.67a 0.057 None
D.canadense 13 7,48 2.43 0.032 Noneb
P.virgatum 8 7,48 0.70 0.671 None
R.sativus 4 7 9.76a 0.203 None
S.
lycopersicum
7 7 10.16a 0.180 None
Er A.syriaca 6 7,48 1.11 0.371 None
D.canadense 17 7,48 1.58 0.164 None
P.virgatum 10 7,48 1.00 0.442 None
R.sativus 4 7 4.93a 0.668 None
S.
lycopersicum
7 7,48 3.45 0.005 1065.00
Post hoc tests [Dunnett's one-sided (ANOVA) or Conover-Inman (Kruskal-Wallis)] were performed in order to determine doses that negatively differed from the controls. Additional information on calculated speed of germination is available inS1 Table.
aIndicates
χ2value for Kruskal-Wallis analyses.
bThough a statistical effect is present (p<0.05), no doses were found to be signi
ficantly, negatively different from the controls.
mg REE/kg dry soil (all doses mentioned hereafter are in relation to dry soil concentration). In four cases (D.canadensein Sm,A.syriacaandD.canadensein Tb, andP.virgatumin Er) IC25s were found to be less than 100 mg REE/kg. Larger effects on biomass, as indicated by the IC50s, generally occurred at doses above 400 mg REE/kg, though IC50 effects were seen at smaller doses forD.canadensein both Sm and Tb soils. Overall,D.canadensewas the most sensitive species.
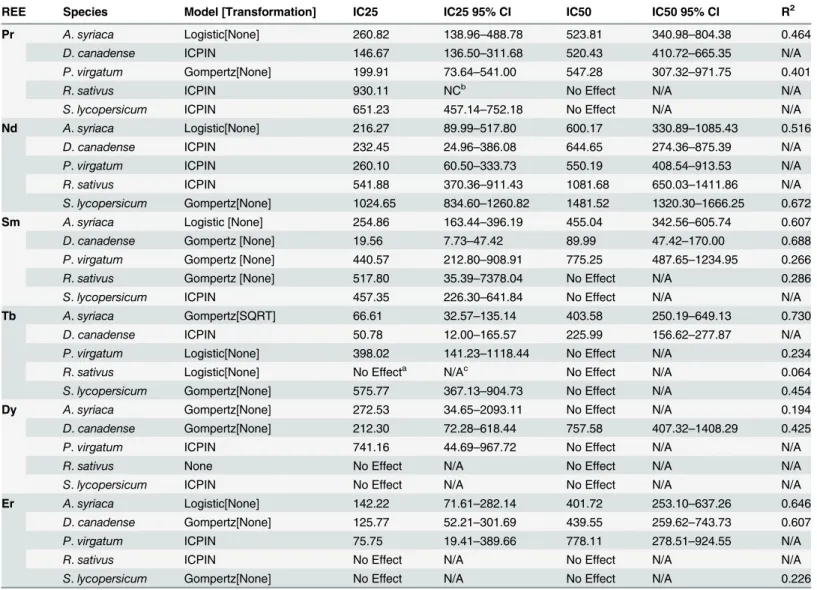
In comparison to the native species, IC25s for the crops were always greater than 400 mg REE/kg, with the majority of results (seven out of 12) falling above 700 mg REE/kg. IC50s Table 5. Summary of inhibition concentration (IC) values, calculated as the dosage (mg REE/kg dry soil) resulting in either a 25% (IC25) or 50% (IC50) decrease in the dry biomass of exposed plants as compared to the controls, for all plant species grown in rare earth element (REE) contami-nated soils.
REE Species Model [Transformation] IC25 IC25 95% CI IC50 IC50 95% CI R2
Pr A.syriaca Logistic[None] 260.82 138.96–488.78 523.81 340.98–804.38 0.464 D.canadense ICPIN 146.67 136.50–311.68 520.43 410.72–665.35 N/A P.virgatum Gompertz[None] 199.91 73.64–541.00 547.28 307.32–971.75 0.401
R.sativus ICPIN 930.11 NCb No Effect N/A N/A
S.lycopersicum ICPIN 651.23 457.14–752.18 No Effect N/A N/A
Nd A.syriaca Logistic[None] 216.27 89.99–517.80 600.17 330.89–1085.43 0.516 D.canadense ICPIN 232.45 24.96–386.08 644.65 274.36–875.39 N/A P.virgatum ICPIN 260.10 60.50–333.73 550.19 408.54–913.53 N/A R.sativus ICPIN 541.88 370.36–911.43 1081.68 650.03–1411.86 N/A S.lycopersicum Gompertz[None] 1024.65 834.60–1260.82 1481.52 1320.30–1666.25 0.672
Sm A.syriaca Logistic [None] 254.86 163.44–396.19 455.04 342.56–605.74 0.607 D.canadense Gompertz [None] 19.56 7.73–47.42 89.99 47.42–170.00 0.688 P.virgatum Gompertz [None] 440.57 212.80–908.91 775.25 487.65–1234.95 0.266 R.sativus Gompertz [None] 517.80 35.39–7378.04 No Effect N/A 0.286 S.lycopersicum ICPIN 457.35 226.30–641.84 No Effect N/A N/A
Tb A.syriaca Gompertz[SQRT] 66.61 32.57–135.14 403.58 250.19–649.13 0.730 D.canadense ICPIN 50.78 12.00–165.57 225.99 156.62–277.87 N/A P.virgatum Logistic[None] 398.02 141.23–1118.44 No Effect N/A 0.234 R.sativus Logistic[None] No Effecta N/Ac No Effect N/A 0.064 S.lycopersicum Gompertz[None] 575.77 367.13–904.73 No Effect N/A 0.454
Dy A.syriaca Gompertz[None] 272.53 34.65–2093.11 No Effect N/A 0.194 D.canadense Gompertz[None] 212.30 72.28–618.44 757.58 407.32–1408.29 0.425
P.virgatum ICPIN 741.16 44.69–967.72 No Effect N/A N/A
R.sativus None No Effect N/A No Effect N/A N/A
S.lycopersicum ICPIN No Effect N/A No Effect N/A N/A
Er A.syriaca Logistic[None] 142.22 71.61–282.14 401.72 253.10–637.26 0.646 D.canadense Gompertz[None] 125.77 52.21–301.69 439.55 259.62–743.73 0.607 P.virgatum ICPIN 75.75 19.41–389.66 778.11 278.51–924.55 N/A
R.sativus ICPIN No Effect N/A No Effect N/A N/A
S.lycopersicum Gompertz[None] No Effect N/A No Effect N/A 0.226
Dry biomass includes all aboveground plant tissues (shoots), as well as the radish bulb forR.sativus. IC values were calculated through parametric, non-linear regression models [52] or through the non-parametric ICPIN approach [53]. The 95% confidence intervals (CI) were determined through the Wald method for parametric data or through boot-straps for ICPIN data.
aNo effect. Either the IC value could not be determined, or the predicted value exceeded the range of doses evaluated in the experiment. b
NC = Not calculable. ICPIN could not accurately predict CIs due to too few doses exhibiting IC25 effects.
cN/A = Not available.
could only be calculated for the crops in the Nd experiment, likely due to the higher concentra-tion of that specific REE in the final dose as compared to the other REE experiments. In all other cases, predicted 50% effects on crop biomass either fell outside of, or were not apparent within, the range of doses evaluated.
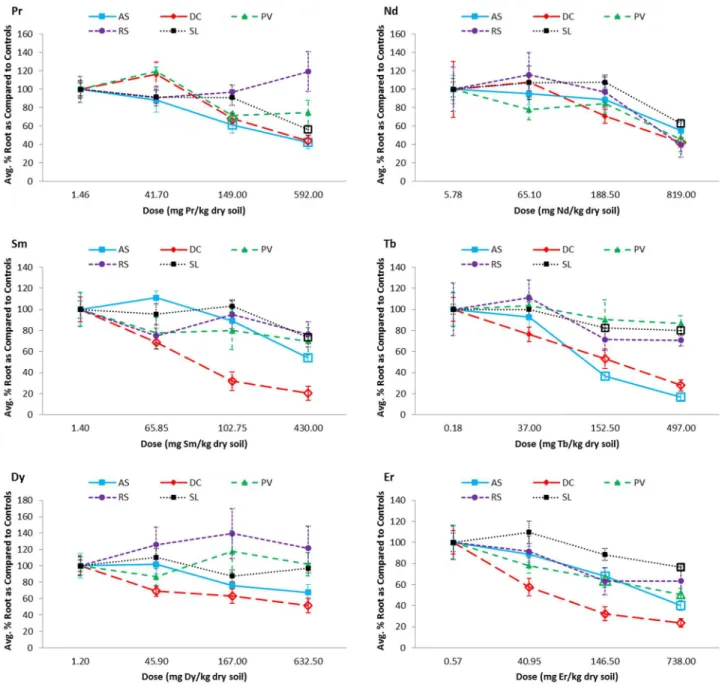
The REE dose at which significant reductions in biomass (as compared to the controls) were first detected vary both by species within a given REE treatment and for a given species across all REEs (Fig 1;S3 Table). Generally, negative effects of Pr and Nd on plant biomass first appear at higher doses (149.00 and 319.00 mg REE/kg respectively) than for Sm (D.canadense
andR.sativusat 26.85 mg Sm/kg), Tb (A.syriacaat 23.25 mg Tb/kg), Dy (A.syriacaat 78.65 mg Dy/kg), and Er (D.canadenseat 40.95 mg Er/kg). However, though effects were observed at lower doses for Tb, Dy, and Er, not all species experienced significant reductions in biomasses for these REEs as they did for Pr, Nd, and Sm. By species, REE doses causing a statistically sig-nificant biomass reduction spanned from 23.25 (Tb) to 592.00 (Pr) mg REE/kg forA.syriaca; from 26.85 (Sm) to 819.00 (Nd) forD.canadense; from 149.00 (Pr) to 1060.00 (Sm) or no effect (Tb and Dy) forP.virgatum; from 26.85 (Sm) to 1032.50 (Pr) or no effect (Tb and Dy) forR.
sativus; and from 317.00 (Sm) to 592.00 (Pr) or no effect (Dy and Er) forS.lycopersicum. As compared to their corresponding IC25 values (Table 5), the lowest dose at which ANOVA or Kruskal-Wallis analyses predict as being statistically lower than its corresponding controls (Fig 1,S3 Table) is generally greater than its IC25 value. Interestingly, forP.virgatumgrown in Tb and Dy soils, though IC25 values were determined, no statistical differences between doses were detected.
Belowground (root) biomass
Root biomass of the native species was generally affected at lower REE doses than the crops (Fig 2;S4 Table).Desmodium canadensewas often the most sensitive species, being the only species with significant biomass reductions (as compared to the controls) detected at doses less than 100 mg REE/kg (Sm, Dy, and Er). In addition,D.canadensewas the only species for which all REEs had a significant effect on root biomass in at least one dose, though the dosage at which the effects were noticeable varied considerably between the REEs (ranging from 40.95 mg/kg for Er to 819.00 mg/kg for Nd;Fig 2;S4 Table). Conversely, root biomass ofR.sativus
(including the radish bulb) was unaffected by all REEs within the range of doses for which it was evaluated. For the remaining species, REE concentrations causing significant effects on root biomass ranged from 146.50 (Er) to 430.00 mg REE/kg (Sm) forA.syriaca, with no effects observed in Nd or Dy; from 146.50 (Er) to 819.00 mg REE/kg (Nd) forP.virgatum, with no ef-fects observed in Sm, Tb, or Dy; and from 152.50 (Tb) to 819.00 mg REE/kg (Nd) forS. lycoper-sicum, with no effects observed in Dy.
Chloride experiment
Results revealed that there were no consistent significant differences among doses of calcium chloride and control with calcium carbonate in four species (although differences were ob-served with controls with no additional calcium added). However, significant differences were observed forD.canadenseat doses from 125 mg/kg CaCl2to 1000 mg/kg CaCl2(S1 Fig).
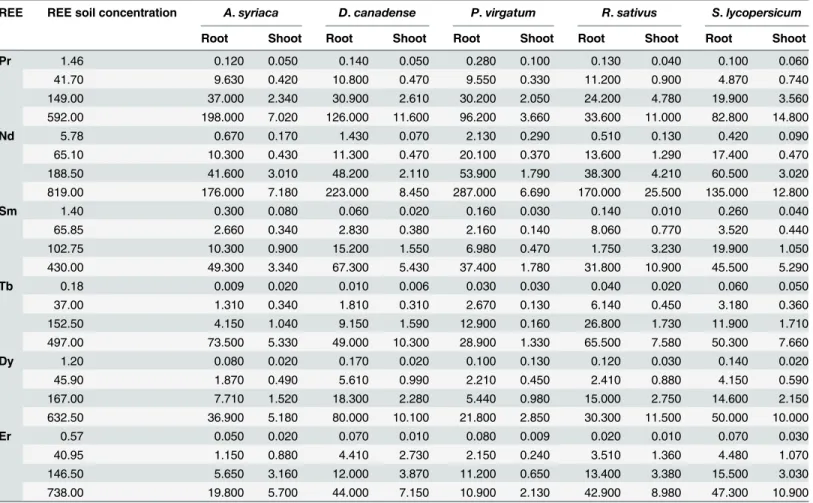
REE plant accumulation
Measured concentrations were always found to be greater in the roots than in the shoots for any given dose, with three exceptions:A.syriacagrown in the Tb control soils (0.18 mg Tb/kg soil),P.virgatumin the Dy control soils (1.20 mg Dy/kg soil), andR.sativusin the 102.80 mg Sm/kg dosed Sm soil. Overall, no species showed any distinct trend in REE root accumulation (i.e. lower vs. higher accumulation rates) at any given REE soil concentration. However, at any given soil dosage for a given REE it was observed that the cropR.sativusoften had the highest Fig 1. Dose-response curves for the aboveground, shoot (leaves and stems) biomass of all five tested plant species grown in rare earth element (REE) contaminated soils.Biomass is presented as the average percent biomass as compared to the controls, such that the controls always have a mean of 100%. Doses that were found to be significantly, negatively different from the controls based on statistical analyses using ANOVA (Dunnett's one-way post hoc comparison) or the Kruskal-Wallis test (Conover-Inman post hoc comparisons) are indicated with open bullets. Error bars represent standard error. AS = Asclepias syriaca, DC =Desmodium canadense, PV =Panicum virgatum, RS =Raphanus sativusand SL =Solanum lycopersicum.
concentration in its shoots (13 out of 24 cases), whereas the grassP.virgatumoften had the lowest detected shoot concentration (19 out of 24 cases).
REE Root:soil and shoot:soil ratios were fairly consistent within a given species for each REE, with no obvious increases or decreases with increasing soil concentrations (S5 Table). These ratios were also fairly consistent across REEs. The root:soil ratios (or transfer factor) ranges were: 0.07–0.33 (Pr), 0.07–0.35 (Nd), 0.03–0.19 (Sm), 0.03–0.18 (Tb), 0.03–0.14 (Dy), and 0.01–0.14 (Er) and the shoot:soil ratios: 0.008–0.068 (Pr), 0.006–0.050 (Nd), 0.002–0.057 Fig 2. Dose-response curves for the belowground, root dry biomass (and including the radish bulb forRaphanus sativus) of all five tested plant species grown in rare earth element (REE) contaminated soils.Only the controls, 2nd, 4th, and 6thREE doses were evaluated. Biomass is presented as the average percent biomass as compared to the controls, such that the controls always have a mean of 100%. Doses that were found to be significantly, negatively different from the controls based on statistical analyses using ANOVA (Dunnett's one-way post hoc comparison) or the Kruskal-Wallis test (Conover-Inman post hoc comparisons) are indicated with open bullets. Error bars represent standard error. AS =Asclepias syriaca, DC =Desmodium canadense, PV =Panicum virgatum, RS =Raphanus sativusand SL =Solanum lycopersicum.
(Sm), 0.001–0.021 (Tb—though much higher ratios were observed in the control dose), 0.005–
0.108 (Dy), and 0.003–0.067 (Er).
Discussion
Due to the increasing worldwide demands for REEs in modern technology, global REE mining and extraction activities have been on a steady rise. Though they have become widely used, very little is currently known about the potential environmental impacts and toxicities of these elements to native plants growing in contaminated soils, thus warranting further
environmental monitoring.
Effects on germination
Germination rates of all species were generally unaffected by REE soil concentrations. Some negative effects on speed of germination were identified for bothR.sativusin Nd soils andS.
lycopersicumin Er soils, but only at the highest dosage evaluated. Likewise, while effects were observed at intermediate doses for bothR.sativusin Pr soils andD.canadensein Sm soils, the effect was not apparent at the highest dose. Due in part to these inconsistencies, it is not possi-ble to rule out that these observed negative effects were due to variability in seed viability as Table 6. Rare earth elements (REE) soil concentration (mg REE/kg dry soil) and measured concentrations (mg REE/kg dry biomass) in the roots and shoots (aboveground biomass) of the five plant species grown in REE contaminated artificial soil.
REE REE soil concentration A.syriaca D.canadense P.virgatum R.sativus S.lycopersicum
Root Shoot Root Shoot Root Shoot Root Shoot Root Shoot
Pr 1.46 0.120 0.050 0.140 0.050 0.280 0.100 0.130 0.040 0.100 0.060
41.70 9.630 0.420 10.800 0.470 9.550 0.330 11.200 0.900 4.870 0.740
149.00 37.000 2.340 30.900 2.610 30.200 2.050 24.200 4.780 19.900 3.560
592.00 198.000 7.020 126.000 11.600 96.200 3.660 33.600 11.000 82.800 14.800
Nd 5.78 0.670 0.170 1.430 0.070 2.130 0.290 0.510 0.130 0.420 0.090
65.10 10.300 0.430 11.300 0.470 20.100 0.370 13.600 1.290 17.400 0.470
188.50 41.600 3.010 48.200 2.110 53.900 1.790 38.300 4.210 60.500 3.020
819.00 176.000 7.180 223.000 8.450 287.000 6.690 170.000 25.500 135.000 12.800
Sm 1.40 0.300 0.080 0.060 0.020 0.160 0.030 0.140 0.010 0.260 0.040
65.85 2.660 0.340 2.830 0.380 2.160 0.140 8.060 0.770 3.520 0.440
102.75 10.300 0.900 15.200 1.550 6.980 0.470 1.750 3.230 19.900 1.050
430.00 49.300 3.340 67.300 5.430 37.400 1.780 31.800 10.900 45.500 5.290
Tb 0.18 0.009 0.020 0.010 0.006 0.030 0.030 0.040 0.020 0.060 0.050
37.00 1.310 0.340 1.810 0.310 2.670 0.130 6.140 0.450 3.180 0.360
152.50 4.150 1.040 9.150 1.590 12.900 0.160 26.800 1.730 11.900 1.710
497.00 73.500 5.330 49.000 10.300 28.900 1.330 65.500 7.580 50.300 7.660
Dy 1.20 0.080 0.020 0.170 0.020 0.100 0.130 0.120 0.030 0.140 0.020
45.90 1.870 0.490 5.610 0.990 2.210 0.450 2.410 0.880 4.150 0.590
167.00 7.710 1.520 18.300 2.280 5.440 0.980 15.000 2.750 14.600 2.150
632.50 36.900 5.180 80.000 10.100 21.800 2.850 30.300 11.500 50.000 10.000
Er 0.57 0.050 0.020 0.070 0.010 0.080 0.009 0.020 0.010 0.070 0.030
40.95 1.150 0.880 4.410 2.730 2.150 0.240 3.510 1.360 4.480 1.070
146.50 5.650 3.160 12.000 3.870 11.200 0.650 13.400 3.380 15.500 3.030
738.00 19.800 5.700 44.000 7.150 10.900 2.130 42.900 8.980 47.300 10.900
Numbers represent the results of chemical analyses of pooled plant samples corresponding to the plant species and REE dose combination.
opposed to REE toxicity. The results obtained in this experiment are similar to those found in a previous experiment with lanthanum (La), where no effects on germination were observed; however, the range of doses tested in the La study was significantly lower [35]. In contrast, two other REEs, yttrium and cerium, were observed to negatively affect the germination rates of the same species evaluated in the present study [35].
There is a paucity of studies on the effects of REEs on germination and early growth. Hu et al. [22,30] conducted studies in nutrient solutions rather than in soil and demonstrated both growth stimulation and inhibition. In contrast, D’Aquino et al. [37] observed reduced germina-tion ofTriticum durumDesf. seeds placed on germination paper after soaking in a La3+or a combined REE solution, with the observed negative effects varying by both seed soaking times (2–8 hours) and by concentration (0.01–10 mM). In the current experiment, when seeds were grown directly in REE contaminated soils, no significant stimulation in germination was ob-served for any of the species and REEs studied. Though the results indicate a potential slight toxic effect of some REEs on the seeds of certain species, the high soil dosage required to elicit these effects would be more representative of levels found at contaminated sites near mining or processing facilities [19,20], as opposed to sites with more subtle inputs (e.g. fertilized lands, landfill leaching).
Effects on aboveground and belowground biomass
High soil concentrations of the six REEs were needed to reduce the aboveground biomass of all plant species (as determined through IC25 and IC50 analyses). Native species were found to be significantly more sensitive to REEs (IC25s from 146.67 to 741.16 mg/kg dry soil) than crops (IC25s from 651.23 mg/kg dry soil to no effect). The same trend was observed for the IC50s. Likewise, effects on root biomass were more noticeable in native species than in the crops. Nev-ertheless, it is believed that significant quantities of REEs would have to be released into the en-vironment to attain these potentially toxic levels. For instance, according to the information provided in Slooff et al. [18], the detected IC25 and IC50 values in this study are generally greater than the Nd and Pr soil concentrations reported at contaminated sites in the Nether-lands (i.e. 400 mg Nd/kg soil and 100 mg Pr/kg soil), with the exceptions of the results for the three native species grown in Nd-spiked soils. In contrast to the HREEs (Tb, Dy and Er), levels of the LREEs (Pr, Nd and Sm) in contaminated sites in China exceeded both the EC25s and EC50s of most of the plant species investigated in this study [20]. Information on soil pollution levels of Sm, Tb, Dy and Er is scarce. Low to medium background concentrations of these REEs have been reported in natural soils, with high degrees of variability (0.51–20.93 mg Sm/ kg soil, 0.13–2.3 mg Tb/kg soil, 0.51–12.1 mg Dy/kg soil and 0.16–6.2 mg Er/kg soil; see sum-maries in [54,55]). If a contamination factor of 100 times the background level is considered (as for Nd and Pr in the Netherlands [18]), it is likely that some plant species will be affected by these REEs; however, more site-specific baseline data from Canada and elsewhere around the world is necessary in order to form conclusions about their potential environmental impacts. In addition, further research on native species is required to properly measure hazards on other plant groups, such as bryophytes, pteridophytes, and woody plants.
Chloride effect
and references therein). In another experiment, it was shown that accumulation of chloride caused a reduction in gas exchange within leaves, as well as interacted with sodium to reduce other physiological processes inCitrus sinensis(L.) Osbeck cv. Hamlin seedlings [57]. The ad-verse effect of chloride associated with REEs had not been previously investigated. Our findings suggest that other experiments performed under hydroponic or soil conditions and which showed negative effects on plants [58,59,60,61,62] may be partly related to the chloride compo-nent of the tested compounds. Yet, undesirable effects of lanthanum have been observed with other REE forms [31,63,64], primarily with the nitrate form [30] that is more soluble than the oxide and the phosphate forms. Further research is thus needed to unravel the effect of REEs compared to their anions on plant phytotoxicity.
Uptake and accumulation
All species tested in this experiment were found to uptake and accumulate REEs from soils. Uptake and accumulation of REEs by the roots and shoots, respectively, was generally propor-tional to the doses tested. Accumulation into the shoots by the three native plant species (the most sensitive species) at the analyzed dose closest to the IC25 values also varied. The artificial soil used in this experiment was approximately pH = 6, representing a moderate value for Ca-nadian soils that are more basic in the western Canada, but more acidic in the eastern Canada. In a previous experiment, it was found that at a lower soil pH (4.08), cerium (Ce) was more toxic to the majority of plant species than at a higher soil pH (6.74), and that Ce uptake by roots and accumulation in shoots was also generally much greater at lower soil pHs [35]. Tyler and Olsson [65] also studied the effects of soil pH on the uptake of metals by a grass,Agrostis capillarisL. For the lanthanoids, it was observed that root concentrations were inversely related to soil pH and positively correlated with soil concentration. Other research has indicated that soil pH plays a vital role in the bioavailability of various REEs and their release into soils [65,66,67,68]. It is probable that in a worse-case scenario, where soil has become acidic, REE contamination would become more toxic to plants growing at the site.
As has been found in previous REE studies [27,35,42,65,69,70,71], accumulation of REEs was higher in the roots than in the shoots on a dry biomass basis. Specifically, Tyler and Olsson [28] found slightly lower concentrations of Pr, Nd, Sm, Tb, Dy and Er in the leaves of various species as compared to the roots. Fu et al. [27] observed concentrations ranging from 0.019 to 0.595, 0.001 to 0.097, and 0.0007 to 0.104 mg REE/kg dry weight in the roots, leaves, and stems, respectively, of ferns (MatteucciaTodaro spp.) in soils containing approximately 0.191 to 1.697 mg/kg of the six REEs studied in this experiment. Those results, as well as those of Markert and Li [26], were in congruence with our detected plant concentrations at lower doses. Zhang et al. [71] found significantly higher concentrations of REEs in ferns than in other plant groups, as well as higher concentrations in leaves than roots, with root:soil and leaf:soil ratios much great-er than those reported in this study (maximums of 7.26 (Sm) for root:soil and 16.07 (Nd) for leaf:soil). Wyttenbach et al. [72] observed Nd, Sm, and Tb leaf concentrations ranging from 0.033 to 0.544 mg/kg, 0.006 to 0.103 mg/kg and ~0.001 to 0.016 respectively in a variety of spe-cies grown in soils containing approximately 15.00 mg Nd/kg, 2.82 mg Sm/kg and 0.381 mg Tb/kg. Shoot to soil ratios varied between 0.002 (Rubus fruticosusL. for Sm and Tb) to 0.044 (Acer pseudoplantusL. for Tb) which is in concordance with the ratios observed for lower soil concentrations in our study (0.006 to 0.050). Another comprehensive experiment comparing 36 plant species grown in natural soils in Japan only detected REEs in 10 species, and only de-tected our six study REEs in up to three species:Dicranopteris dichotoma(Thunb.) Bernh.,
native to Canada, leaf concentrations were sometimes higher than the corresponding soil con-centrations [44]. On the high end, França et al. [29] measured Nd, Sm, and Tb leaf concentra-tions of tropical plants grown in Brazilian soils and detected REE concentraconcentra-tions ranging between 18 to 36 mg Nd/kg, 1.9 to 4.9 mg Sm/kg, and 0.24 to 0.47 mg Tb/kg to be<1.5–28 mg Nd/kg, 0.019–4.2 mg Sm/kg, and<0.009–0.24 mg Tb/kg respectively. As with several other studies, Pr, Dy and Er were not measured. Accumulation of REEs by plants at the lower doses in these experiments appears to correspond to rates reported for similar, natural REE soil con-centrations. Unfortunately, information for higher soil concentrations is lacking. In all cases it can be seen that accumulation rates vary with plant group as well as with species; therefore, testing a variety of plants other than the commonly used crops is highly desirable.
The REE plant:soil ratios, also referred to as transfer factors, in the present study were found to range from 0.001 to 0.278 for aboveground parts with only five of the 120 values above 0.100, with no immediate increase (hyper-accumulation) or decrease (plateauing) in ab-sorption relative to the increasing soil concentrations. In contrast, the transfer factors of the aboveground system varied between 0.010 to 0.369 with 63 of the 120 values at or above 0.100. This is higher than values reported in other studies [26,41,73]; however, our control results were on par with both the leaf:soil ratios (average = 0.051 to 0.276 for Pr, Nd and Sm, respec-tively) and root:shoot ratios (average = 0.105 to 0.442) obtained where only background soil concentrations were considered [74].
There is no indication in the literature that REEs are essential to plants [20]. Some studies suggest that they may replace calcium and hence cause growth stimulation at low doses [66], al-though this has been disputed [30,31]. In China, Changle and Nongle, two commercial formula-tions comprising the nitrate form of REEs are used as seed treatment or sprayed at low doses on crops as fertilizers with demonstrated positive effects ([75] and references therein). Other studies conducted in hydroponic cultures have also demonstrated some growth stimulations. This was not found in the present study in plants grown in low dose contaminated soils. Conversely, higher soil levels of REEs that may arise in the vicinities of mining areas, landfills or where phos-phate fertilizers are recurrently applied may be a concern for native terrestrial primary produc-ers. The present study indicated that reductions in both aboveground and belowground biomass of wild native plant species did occur in the presence of elevated soil levels of REEs, therefore monitoring of sites near REE mines and processing facilities is of great importance.
Supporting Information
S1 Fig. Effects of chloride on the plant species tested in the rare earth element (REE) experi-ments.Calcium chloride was used at doses relevant to those tested with the rare earth ele-ments. Two control doses (one with calcium carbonate, CaCO3, added to balance the Ca level with the highest Cl dose, and one with no CaCO3added) were used to examine the effect of cal-cium alone on plant biomass. Letters above bars represent results of Tukey’s honestly-signifi-cant-difference post hoc test. Different letters represent significant differences.
(TIFF)
S1 Table. Average percent germination and average speed of germination (both ± standard error) per pot of the five tested plant species grown in increasing soil concentrations (nom-inal doses 1 to 7) of six rare earth elements (REEs).
(XLSX)
determine doses that negatively differed from the controls. (XLSX)
S3 Table. Summary of ANOVA or Kruskal-Wallis analyses on aboveground, shoot biomass (and including the radish bulb forR.sativus) for five plant species grown in rare earth
ele-ment (REE) contaminated soils.No observed effect (NOEC) and lowest observed effect (LOEC) concentrations of the given REE were determined based on either Dunnett's one-way post hoc comparisons (ANOVA) or Conover-Inman post hoc comparisons (Kruskal-Wallis) for negative differences (i.e. reduced biomass) from the controls.
(XLSX)
S4 Table. ANOVA (or Kruskal-Wallis) results for root biomass for five plant species tested in rare earth element (REE) contaminated soils.Only the control, 2nd, 4th, and 6thdoses for each REE were included. Dunnett's one-way post hoc comparison (or the Conover-Inman test) was used to determine doses that were significantly negatively different from the controls. (XLSX)
S5 Table. Root:soil and shoot:soil ratios based on detected rare earth element (REE) con-centrations in dosed soils as well as in the roots and shoots of the five tested plant species.
(XLSX)
Acknowledgments
We wish to thank the staff at the Plant Toxicology Research Group at the National Wildlife Re-search Centre of Environment Canada for their technical assistance.
Author Contributions
Conceived and designed the experiments: CB DC. Performed the experiments: DC JEA JLP DME. Analyzed the data: DC. Contributed reagents/materials/analysis tools: CB. Wrote the paper: CB DC JEA.
References
1. Hu Z, Haneklaus S, Sparovek G, Schnug E. Rare earth elements in soils. Commun Soil Sci Plant Anal. 2006; 37: 1381–1420.
2. Stone R. As China’s rare earth R&D becomes even more rarefied, others tremble. Science. 2009; 325: 1336–1337. doi:10.1126/science.325_1336PMID:19745130
3. Rüttinger L, Feil M. Sustainable prevention of resource conflicts: new risks from raw materials for the fu-ture? Case study and scenarios for China and rare earths. Section Report 3.4, Research Project FKZ 370819 102. adelphi, Berlin, Germany. 2010 [cited 2015 Jan 12]. Available:http://www.adelphi.de/files/ de/news/application/pdf/rohkon_report_3.4_china.pdf.
4. Hurst C. China’s rare earth elements industry: What can the West learn? Institute for the Analysis of Global Security (IAGS). U.S. Army Foreign Military Studies Office, Fort Leavenworth, KS. 2010 [cited 2015 Jan 12]. Available:http://www.iags.org/rareearth0310hurst.pdf.
5. Avalon Rare Metals Inc. Nechalacho rare earth elements project. 2015 Feb 10 [cited 2015 Apr 22]. Available:http://www.avalonraremetals.com/_resources/factsheet/ProjectSheet.pdf.
6. Quest Rare Minerals Ltd. Strange Lake rare earth project. 2014 [cited 2015 Jan 12]. Available:http:// www.questrareminerals.com/strange_lake.php.
7. Long KR, Van Gosen BS, Foley NK, Cordier D. The principle rare earth element deposits of the United States: a summary of domestic deposits and a global perspective. In: Sinding-Larsen R, Wellmer F-W, editors. Non-Renewable Resource Issues: Geoscientific and Societal Challenges. Netherlands: Springer; 2012. p. 131–155. doi:10.1007/978-90-481-8679-2_7
9. Du X, Graedel TE. Global rare earth in-use stocks in NdFeB permanent magnets. J Ind Ecol. 2011; 15 (6): 836–843.
10. de Boer MA, Lammertsma K. Scarcity of rare earth elements. Chem Sus Chem. 2013; 6: 2045–2055.
11. Hayes-Labruto L, Schillebeeckx SJD, Workman M, Shah N. Contrasting perspectives on China’s rare earth policies: reframing the debate through a stakeholder lens. Energy Policy. 2013; 63: 55–68.
12. Gonzalez V, Vignati DAL, Leyval C, Giamberini L. Environmental fate and ecotoxicity of lanthanides: Are they a uniform group beyond chemistry? Environ Intern. 2014; 71: 148–157.
13. Volokh AA, Gorbunov AV, Gundorina SF, Revich BA, Frontasyeva MV, Pal CS. Phosphorus fertilizer production as a source of rare-earth elements pollution of the environment. Sci Total Environ. 1990; 95: 141–148. PMID:2169646
14. Turra C, Fernandes EAN, Bacchi MA. Evaluation on rare earth elements of Brazilian agricultural sup-plies. J Environ Chem Ecotoxicol. 2011; 3(4): 86–92.
15. Yang Q, Wang L, Zhou Q, Huang X. Toxic effects of heavy metal terbium ion on the composition and functions of cell membrane in horseradish roots. Ecotox Environ Saf. 2015; 111: 48–58. doi:10.1016/j. ecoenv.2014.10.002PMID:25450914
16. IPNI (International Plant Nutrition Institute). World production of phosphate rock. Better Crops. 1999 [cited 2015 Jan 12]; 83(1): 4–7. Available:http://www.ipni.net/publication/bettercrops.nsf/0/ 226AFC1599C06D538525798000820184/$FILE/Better%20Crops%201999-1%20p04.pdf.
17. Sneller FEC, Kalf DF, Weltje L, Van Wezel AP. Maximum permissible concentrations and negligible concentrations for rare earth elements (REEs). RIVM Report 601501 011. National Institute of Public Health and the Environment, the Netherlands. 2000 [cited 2015 Jan 12] Available:http://rivm. openrepository.com/rivm/bitstream/10029/9551/1/601501011.pdf.
18. Slooff W, Bont PFH, van den Hoop MAGT, Janus JA, Annema JA. Exploratory report: rare earth metals and their compounds. Bilthoven, the Netherlands: National Institute of Public Health and Environmen-tal Protection; 1993. Report No. 710401025.
19. Li J, Hong M, Yin X, Liu J. Effects of the accumulation of the rare earth elements on soil macrofauna community. J Rare Earth. 2010; 28(6): 957–964.
20. Liang T, Li K, Wang L. State of rare earth elements in different environmental components in mining areas of China. Environ Monit Assess. 2014; 186:1499–1513 doi:10.1007/s10661-013-3469-8PMID:
24135922
21. Pickard BG. Comparison of calcium and lanthanum ions in theAvena-coleoptile growth test. Planta. 1970; 91: 314–320. doi:10.1007/BF00387504PMID:24500095
22. Hu Z, Richter H, Sparovek G, Schnug E. Physiological and biochemical effects of rare earth elements on plants and their agricultural significance: a review. J Plant Nutr. 2004; 27(1): 183–220.
23. Liu M, Hasenstein KH. La3+uptake and its effect on the cytoskeleton in root protoplasts of Zea mays L. Planta. 2005; 220: 658–666. PMID:15449062
24. Babula P, Adam V, Opatrilova R, Zehnalek J, Havel L, Kizek R. Uncommon heavy metals, metalloids and their plant toxicity: a review. Environ Chem Lett. 2008; 6: 189–213.
25. Xiaoqing L, Hao H, Chao L, Min Z, Fashui H. Physico-chemical property of rare earths—effects on the energy regulation of photosystem II in Arabidopsis thaliana. Biol Trace Elem Res. 2009; 130: 141–151. doi:10.1007/s12011-009-8321-1PMID:19221699
26. Markert B, Li ZD. Natural background concentrations of rare-earth elements in a forest ecosystem. Sci Total Environ. 1991; 103: 27–35.
27. Fu F, Akagi T, Shinotsuka K. Distribution pattern of rare earth elements in fern: implication for intake of fresh silicate particles by plants. Biol Trace Elem Res. 1998; 64: 13–26. PMID:9845459
28. Tyler G, Olsson T. Rare earth elements in forest-floor herbs as related to soil conditions and mineral nu-trition. Biol Trace Elem Res. 2005; 106: 177–191. PMID:16116249
29. França EJ, De Nadai Fernandes EA, Turra C, Bacchi MA, Elias C, Tagliaferro F, et al. Survey of lantha-noids in plants from a tropical region. Int J Environ Heal. 2011; 5(1–2): 32–48.
30. Hu X, Ding Z, Chen Y, Wang X Dai L. Bioaccumulation of lanthanum and cerium and their effects on the growth of wheat (Triticum aestivumL.) seedlings. Chemosphere. 2002; 48: 621–629. PMID:
12143937
31. Diatloff E, Smith FW, Asher CJ. Effects of lanthanum and cerium on the growth and mineral nutrition of corn and mungbean. Ann Bot. 2008; 101: 971–982. doi:10.1093/aob/mcn021PMID:18292604 32. Zhang S, Shan XQ. Speciation of rare earth elements in soil and accumulation by wheat with rare earth
fertilizer application. Environ Pollut. 2001; 112: 395–405. PMID:11291446
34. Zhang C, Li Q, Zhang M, Zhang N, Li M. Effects of rare earth elements on growth and metabolism of medicinal plants. Acta Pharmaceutica Sinica B. 2013; 3(1): 20–24.
35. Thomas P, Carpenter D, Boutin C, Allison JE. Rare earth elements (REEs): effects on germination and growth of selected crop and native plant species. Chemosphere. 2014; 96: 57–66. doi:10.1016/j. chemosphere.2013.07.020PMID:23978671
36. Kataoka T, Stekelenburg A, Nakanishi TM, Delhaize E, Ryan PR. Several lanthanides activate malate efflux from roots of aluminium-tolerant wheat. Plant Cell Environ. 2002; 25: 453–460.
37. d'Aquino L, de Pinto MC, Nardi L, Morgana M, Tommasi F. Effect of some light rare earth elements on seed germination, seedling growth and antioxidant metabolism inTriticum durum. Chemosphere. 2009; 75(7): 900–905. doi:10.1016/j.chemosphere.2009.01.026PMID:19215958
38. Wang L, Zhou Q, Huang X. Photosynthetic responses to heavy metal terbium stress in horseradish leaves. Chemosphere. 2009; 77: 1019–1025. doi:10.1016/j.chemosphere.2009.07.065PMID:
19712958
39. Cowgill UM. Biogeochemical cycles for the chemical elements inNymphaea odorataAit. and the aphid Rhopalosiphum nymphaeae(L.) living in Linsley Pond. Sci Total Environ. 1973; 2: 259–303.
40. Greenwood NN, Earnshaw A. Chemistry of the Elements. 2nd ed. Great Britain: Butterworth-Heine-mann, Reed Educational and Professional Publishing Ltd; 1997.
41. Tyler G. Rare earth elements in soil and plant systems—a review. Plant Soil. 2004; 267: 191–206.
42. Brioschi L, Steinmann M, Lucot E, Pierret MC, Stille P, Prunier J, et al. Transfer of rare earth elements (REE) from natural soil to plant systems: implications for the environmental availability of anthropogenic REE. Plant Soil. 2012; 366(1–2): 143–136. doi:10.1016/j.jcis.2011.09.059PMID:22014394
43. Markert B. The pattern of distribution of lanthanide elements in soils and plants. Phytochemistry. 1987; 26(12): 3167–3170.
44. Ichihashi H, Morita H, Tatsukawa R. Rare earth elements (REEs) in naturally grown plants in relation to their variation in soils. Environ Pollut. 1992; 76:157–162. PMID:15091997
45. Patnaik P. Handbook of Inorganic Chemicals. USA: McGraw-Hill; 2003
46. Yoshida S, Muramatsu Y, Tagami K, Uchida S. Concentrations of lanthanide elements, Th, and U in 77 Japanese surface soils. Environ Int. 1998; 24(3): 275–286.
47. Masau M,Černý P, Chapman R. Dyprosian xenotime-(Y) from the Annie Claim #3 granitic pegmatite,
southeastern Manitoba, Canada: evidence of the tetrad effect? Can Mineral. 2000; 38: 899–905.
48. Mackenzie RC. A micromethod for determination of cation-exchange capacity of clay. J Colloid Sci. 1951; 6: 219–222.
49. Oldham MJ, Bakowsky WD, Sutherland DA. Floristic Quality Assessment System for Southern Ontario. Report. Peterborough, Ontario, Canada: Natural Heritage Information Centre, Ontario Ministry of Natu-ral Resources; 1995. PMID:8532914
50. United States Environmental Protection Agency (USEPA) (1996). Method 1638—Determination of trace elements in ambient waters by inductively coupled plasma—mass spectrometry. Washington, D. C.: USEPA. 1996 [cited 2015 Jan 12]; Available:http://water.epa.gov/scitech/methods/cwa/
bioindicators/upload/2007_07_10_methods_method_1638.pdf.
51. Boutin C, Carpenter D, Thomas P. Lanthanum chloride (LaCl3): effects on crops and selected native
plant species. Report produced for the Inorganics Unit, Ecological Assessment Division, Science and Technology Branch of Environment Canada. Ottawa, Ontario: Environment Canada Ottawa; 2012.
52. Environment Canada. Biological test method: test for measuring emergence and growth of terrestrial plants exposed to contaminants in soil. Report. Ottawa, Ontario: Method Development and Applications Section, Environmental Technology Centre. 2005 Feb (amended 2007 Jun). Report No.: EPS 1/RM/45 —February 2005 (with June 2007 amendments).
53. Norberg-King TJ. A linear interpolation method for sublethal toxicity: the inhibition concentration (ICp) approach (version 2.0). Technical Report. Duluth, MN: U.S. Environmental Protection Agency, Envi-ronmental Research Laboratory. 1993. Report No.: 03–93.
54. Carpenter D, Boutin C, Parsons J, Ellis DM. Heavy rare earth elements terbium, erbium, and dysprosi-um: effects on selected crops and native plant species. Report produced for the Inorganics Unit, Eco-logical Assessment Division, Science and Technology Branch of Environment Canada. Ottawa, Ontario: Environment Canada Ottawa; 2014.
55. Carpenter D, Allison JE, Boutin C. Samarium chloride hexahydrate (SmCl36H2O): effects on selected
56. Bar Y, Apelbaum A, Kafkafi U, Goren R. Relationship between chloride and nitrate and its effects on growth and mineral composition of avocado and citrus plants. J Plant Nutr. 1997; 20(6):715–731.
57. Bañuls J, Primo-Millo E. Effects of chloride and sodium on gas exchange parameters and water rela-tions ofCitrusplants. Physiol Plant. 1992; 86: 115–123.
58. Fashui H, Weiping S, Zhigang W, Mingliang Y, Jia Y, Jiajia Y, et al. Effect of La(III) on the growth and aging of root of loquat plantlet in vitro. Biol Trace Elem Res. 2005; 104(2): 185–191. PMID:15894818 59. Shi P, Huang Z, Chen G. Influence of lanthanum on the accumulation of trace elements in chloroplasts
of cucumber seedling leaves. Biol Trace Elem Res. 2006; 109:181–188. PMID:16444007
60. Xie ZB, Zhu JG, Chu HY, Zhang YL, Zeng Q, Ma HL, et al. Effect of lanthanum on rice production, nutri-ent uptake, and distribution. J Plant Nutr. 2002; 25(10): 2315–2331.
61. Zeng FL, Zhang MF, Zhou SM, Wu JG, Deng RW. The effect of lanthanide chloride on abscisic acid and electron-transport activity of some crops. Biol Trace Elem Res. 1999; 67: 277–284. PMID:
10201334
62. Zeng Q, Zhu JG, Cheng HL, Xie ZB, Chu HY. Phytotoxicity of lanthanum in rice in haplic acrisols and cambisols. Ecotox Environ Saf. 2006; 64: 226–233. PMID:16406581
63. Fashui H, Ling W, Chao L. Study of lanthanum on seed germination and growth of rice. Biol Trace Elem Res. 2003, 94:273–286. PMID:12972694
64. He YW, Loh CS. Cerium and lanthanum promote floral initiation and reproductive growth ofArabidopsis thaliana. Plant Sci. 2000; 159:117–124. PMID:11011099
65. Tyler G, Olsson T. Plant uptake of major and minor mineral elements as influenced by soil acidity and liming. Plant Soil. 2001; 230: 307–321.
66. Cao X, Chen Y, Wang X, Deng X. Effects of redox potential and pH value on the release of rare earth el-ements from soil. Chemosphere. 2001; 44: 655–661. PMID:11482653
67. Yufeng Z, Zhenghua W, Xiaorong W, Lemei D, Yijun C. Mobility of the rare earth elements with acid rainwater leaching in the soil column. Bull Environ Contam Toxicol. 2001; 67: 399–407. PMID:
11479670
68. von Tucher S, Schmidhalter U. Lanthanum uptake from soil and nutrient solution and its effects on plant growth. J Plant Nutr Soil Sci. 2005; 168: 574–580.
69. Fu F, Akagi T, Yabuki S Iwaki M. The variation of REE (rare earth elements) patterns in soil-grown plants: a new proxy for the source of rare earth elements and silicon in plants. Plant Soil. 2001; 235: 53–64.
70. Zhang S, Shan XQ. Speciation of rare earth elements in soil and accumulation by wheat with rare earth fertilizer application. Environ Pollut. 2001; 112: 395–405. PMID:11291446
71. Zhang ZY, Wang YQ, Li FL, Xiao HQ, Chai ZF. Distribution characteristics of rare earth elements in plants from a rare earth ore area. J Radioanal Nucl Chem. 2002; 252:461–465.
72. Wyttenbach A, Furrer V, Schleppi P, Tobler L. Rare earth elements in soil and in soil-grown plants. Plant Soil. 1998; 199: 267–273.
73. Bibak A, Stürup S, Knudsen L, Gundersen V. Concentrations of 63 elements in cabbage and sprouts in Denmark. Commun Soil Sci Plant. 1999; 30, 2409–2418.
74. Wahid PA, Kamalam NV, Prabhu RK, Sekhar JK, Vijayalakshmi S, Mahalingam TR, et al. Rare earth el-ement fluxes in diverse soils and their absorption by coconut palm. J Plant Nutr. 2003; 26(7): 1427– 1438.