8
PROTEIN CONSUMPTION BY BODYBUILDING
PRACTITIONERS AIMING MUSCLE
HYPERTROPHY
ORIGINAL ARTICLE
Daiane Menon
Jacqueline Schaurich dos Santos
Caxia do Sul University – UCS – Caxias do Sul, RS.
Mailing address:
Rua Cirilo Ruzzarim, 474, Lourdes – 95070-480 – Caxias do Sul, RS E-mail: [email protected]
ABSTRACT
The high demand for health clubs is often related to aesthetics and in most cases to increase of muscle mass, especially by practitioners of bodybuilding. There is a belief among athletes that additional protein (LWA) increases strength and improves performance. This study aimed to evaluate the protein consumption of bodybuilding practitioners aiming muscle mass increase, in a health club from Rio Grande do Sul. The sample consisted of 23 male bodybuilding practitioners, aged between 19 and 33 years. Bodybuilding practitioners who trained to gain muscle mass with minimum frequency of three times per week and had experience in endurance training for at least twelve weeks participated in the study. A form with personal information and some specific data concerning training and nutrition was filled out. Food record was held for three days. The anthropometric measurements were taken from the physical evaluation software database of the health club. Nutritional status was also assessed by the calculation of the Body Mass Index (BMI). Average protein intake was 1.7 g / kg. The current lean mass (61.7 kg) presented values higher than the initial lean mass (59.9 kg), which was lower for the three LWA intake classifications (low, recommended and above recommended). Statistically significant difference was detected for the classifications within the recommended range (p <0.001) and higher than recommendation (p <0.05), where, in both situations, the current lean mass was significantly higher than the initial lean mass. The findings in this study suggest that the sample is not characterized by the consumption of LWA above or below the recommendation, and presents hyperprotein diet feature.
Keywords: health clubs, food intake, hypertrophy, food supplements.
EXERCISE AND SPORTS MEDICINE CLINIC
INTRODUCTION
While aiming an“aesthetically perfect” body, many people test diets of any kind, hoping that a new level of wellness or physical
performance is reached1. Body building practitioners many times
risk their health in order to get a perfect body, exaggerating in physical exercises which can lead to lifetime damage, since there
is a genetic limit to muscular development2.
The food consumption of an athlete is differentiated from the rest of the individuals due to their relatively high energetic cost as well as the need for nutrients which range according to the type
of activity, the training stage and ingestion moment3.
Specialists state that food consumption is a crucial element for
mass can reach up to 60% in importance4,5. However, there is lack
of information from the part of the general public that a balanced and good-quality diet, except for in special situations, meets the nu-tritional needs of a physical exercises practitioner, including athletes of competitive level6.
There is an old popular belief among athletes that additional pro-tein (LWA) increases strength and improves performance; however, there is no support from research to this premise and it is observed that a small amount of the necessary protein for the muscular
deve-lopment is easily reached with a regular balanced diet1.
It is scary to see the belief in the mythology that increased needs for protein in the diet among bodybuilders and individuals
interested in increasing muscle mass.Weightlifters ingest around 1 to 3.5g of protein per body weight a day and most of this protein
is presented as supplements1.
The use of commercial protein and amino acids supplements has increased among athletes and sports people, with the purpose to substitute protein fromdiet, the use to increase the biological value of the proteins from diet as well as for their anticatabolic and anabolic effects7.
Thus, the present study had the aim to verify whether the food consumption of the bodybuilding practitioners who aim muscular hypertrophy is rich in protein (derived from eating and/or supple-mentation).
METHODS
9
When the BMI approach was through classification the eutrophic ‘status’ was the most frequent, characterizing 65.2% (n = 15) of the sample. The proportion of eutrophic individuals was significantly higher (p < 0.003) than with low weight, 8.7% (n = 2) and overweight, 26.1% (n = 6).
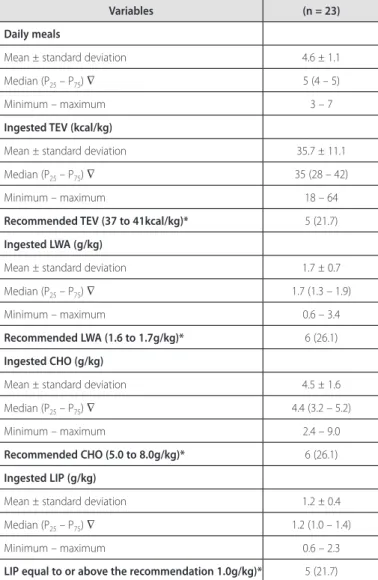
The information regarding the food ingestion is described in table 2. In the daily meals, the mean was of approximately five meals (SD = 1). Concerning the energetic value (TEV) ingested, the mean ingestion was of 35.7kcal/day (SD = 11.1). Considering the recommendation for the TEV (37-41kcal/day), it was verified that 52.2% (n = 12) ingested below the recommendation (from 18 to 35kcal/day), 26.1% (n = 6) ingested above the recommendation (from 42 to 64kcal/day) and21.7% (n = 5) ingested the TEV according to the recommendations (from 37to 41kcal/day). Comparing the presented proportions for the ingestion, no significant statistical difference has been found (p = 0.154).
Considering the results concerning the LWA, the mean in-gestion was 1.7g/kg of weight/day (SD = 0.7g/kg). Regarding the ingestion observed according to the recommended LWAlimit (1.6-1.7g/kg weight/day), it was verified that 30.4% (n = 7) ingested be-low the recommendation (from 0.6 to 1.5g/kg weight/day), 43.5% (n = 10) ingested above the recommendation (from 1.8 to 3.4g/kg weight/day) and 26.1% (n = 6) ingested the LWA according to the recommendation (from 1.6 to 1.7g/kg weight /day). Comparing the presented proportion for the protein ingestion, significant difference has not been observed (p = 0.568).
Concerning the CHO results, it was observed thatthe mean The present study was approved by the Ethics in Research
Com-mittee of the Caxias do Sul University Foundation (CEP/FUCS) of Caxias do Sul, in Rio Grande do Sul state,protocol number 088/08. The individuals agreed on participating in the research and signed the Free and Clarified Consent Form (TCLE) in two copies.
After having signed the form, the participants were leaded to a reserved room, where they were interviewed and told by the researcher herself about the three-day eating record filling, two days during the week and one day on the weekdays, where the interviewee took note of all the food, supplements and drinks ingested with their respective quantities, specifying
the manufacturers and amount in home measures8. The book
“Practical Methods for Calculation of Diets” was used for portions
visual effect9. These eating records were calculated through the
Dietwin professional nutritional assessment software, version 2008. In this same room a form on personal information and some specific data about the training and food consumption was filled out.Concerning the training, the weekly frequency and duration time of the bodybuilding activity were inquired about, while the food consumption was investigated through question about supplementation use and daily mount ingested.
The anthropometric measures, the calculation of the initial and current lean mass were taken from the physical evaluation form which are available on the database of the computer physical eval-uation software Physical Test, version 4.1 for Windows, 1994-2003, where the used method follows the Pollock and Jackson protocol, 1984, which uses the following seven skinfolds (subscapular, tricipital, chest, medial axillary, supra iliac, abdominal and thigh). The initial lean mass used corresponded to three to six months prior to the current lean mass performance. The body mass index (BMI) was calculated with the weight and height measures, through the following formula: BMI = weight (kg) / height2 (m); the cohort points adopted were: low
weight BMI< 18.5), eutrophic (BMI = 18.5 to 24.9), overweight (BMI = 25 to 29.9) and obesity (BMI ≥ 30)10.
The results were presented through the position (mean and median) and dispersion (standard deviation and interquartile am-plitude), positions as well as through the distribution of the simple and relative frequencies. The symmetry of the distribution of the variables was investigated by the Kolmogorov-Smirnov test (p > 0.200). The chi-square test was used for the comparison of pro-portions, considering the theoretical distribution of homogeneity among the compared categories. Considering the comparison of the variables concerning the total energetic value ingestion (TEV), protein (LWA), carbohydrate (CHO) and lipids (LIP), and concerning the use or absence ofLWA supplement, the Mann-Whitney test was used. Initial and final lean mass was compared using the Student’s t test for paired data. The Statistical Package to Social Sciences soft-ware for Windows 13.0, with significance level of (α) 5% was used.
RESULTS
Table 1 demonstrates the characterization of the studied sample composed of 23 individuals. Regarding age, variation amplitude of 19 to 33 years, with mean of 25.8 years (SD = 3.7) was observed. Mean height found was of 1.75m (SD = 0.06) and for weight the mean found was of 69.6kg (SD = 8.5 kg).
Data concerning the BMI presented mean of 22.7 (SD = 2.8).
Table 1. Descriptive measures for the general characterization of the sample.
Variables (n = 23) Age
Mean± standard deviation 25.8 ± 3.7
Median (P25 – P75) ∇ 26 (24 – 29)
Minimum – maximum 19 – 33
Height
Mean ± standard deviation 1.75 ± 0.06
Median (P25 – P75) ∇ 1.75 (1.71 – 1.78)
Minimum – maximum 1.62 – 1.89
Current weight
Mean ± stadandard deviation 69.6 ± 8.5
Median (P25 – P75) ∇ 70.2 (63.0 – 75.9)
Minimum – maximum 56.1 – 83.8
Current BMI
Mean ± standard deviation 22.7 ± 2.8
Median (P25 – P75) ∇ 23.2 (21.2 – 25.3)
Minimum– maximum 16.7 – 27.7
Classification *
Low weight 2 (8.7)
Eutrophic 15 (65.2)
Overweight 6 (26.1)
10
ingestion was of 4.5g/kg of weight /day (SD = 1.6g/kg). Conside-ring the recommendation for ingestion limit for CHO (5.0-8.0g/kg weight/day), it was verified that 69.6% (n = 16) ingested below the recommendations (from 2.4 to 4.8g/kg weight/day), 4.3% (n = 1) ingested above the recommendations (9.0g/kg weight/day) and 26.1%(n = 6) ingested CHO according to the recommendation in-terval (from 5.0 to 8.0g/kg weight/day). Comparing the proportions presented for the ingestion, significant statistical difference has been detected (p < 0.001), showing that the proportion of the investiga-ted individuals with ingestion of CHO below the recommendation was significantly higher in this sample.
Concerning the LIP ingestion, the mean was of 1.2g/kg weight/ day (SD = 0.4g/kg). In the ingestion observed according to the limit for LIP recommendation (1.0g/kg weight/day), it was observed that 21.7% (n = 5) ingested below the recommendation (from 0.6-0.9g/ kg weight/day), 56.5% (n = 13) ingested above the recommendation (from 1.0 to 2.3g/kg weight/day) and 21.7% (n = 5) ingested exactly the recommended amount. Comparing the observed proportions, it was seen that the differences were not statistically significant (p < 0.062); however, the borderline significance presented by the test (0.05 < p < 0.10) suggested that the sample’s proportion with LIP ingestion above the recommendation tends to be higher in this sample.
Table 2. Measures of central tendency and variability for the number of daily meals, TEV, LWA, CHO and LIP.
Variables (n = 23) Daily meals
Mean ± standard deviation 4.6 ± 1.1
Median (P25 – P75) ∇ 5 (4 – 5)
Minimum – maximum 3 – 7
Ingested TEV (kcal/kg)
Mean ± standard deviation 35.7 ± 11.1
Median (P25 – P75) ∇ 35 (28 – 42)
Minimum – maximum 18 – 64
Recommended TEV (37 to 41kcal/kg)* 5 (21.7)
Ingested LWA (g/kg)
Mean ± standard deviation 1.7 ± 0.7
Median (P25 – P75) ∇ 1.7 (1.3 – 1.9)
Minimum – maximum 0.6 – 3.4
Recommended LWA (1.6 to 1.7g/kg)* 6 (26.1)
Ingested CHO (g/kg)
Mean ± standard deviation 4.5 ± 1.6
Median (P25 – P75) ∇ 4.4 (3.2 – 5.2)
Minimum – maximum 2.4 – 9.0
Recommended CHO (5.0 to 8.0g/kg)* 6 (26.1)
Ingested LIP (g/kg)
Mean ± standard deviation 1.2 ± 0.4
Median (P25 – P75) ∇ 1.2 (1.0 – 1.4)
Minimum – maximum 0.6 – 2.3
LIP equal to or above the recommendation 1.0g/kg)* 5 (21.7)
* Values presented in n (%); ∇: P25 concentrates 25% of the sample with values lower or equal to the defined by P25; P50 = median: concentrates 50% of the sample with values lower or equal to the defined by P50; P75: concentrates 75% of the sample with values lower or equal to the defined by P75.
Table 3. Measures of central tendency and variability for the initial and current lean mass.
Estimators
Lean mass (kg)
p (value) Initial Current
Mean ± standard deviation 59.9 ± 6.1 61.7 ± 5.9
<0.001 Median (P25 – P75) ∇ 59.7 (55.1 – 65.7) 61.1 (56.6 – 65.2)
Minimum – maximum 49.8 – 73.1 51.9 – 76.2
* Student’s t test for paired data; ∇: P25 concentrates 25% of the sample with values lower or equal to the ones defined by P25; P50 = median: concentrates 50% of the sample with values lower or equal to the ones defined by P50; P75: concentrates75% of the sample with values lower or equal to the ones defined by P75.
Table 4. Measures of central tendency and variability for theinitial and current lean mass, according to the classification of ingestion of LWA.
Estimators and classification of the LWA ingestion
Lean mass
p (value) Initial Current
LWAIng below recommendation (LWA < 1.6)
Mean ± standard deviation 63.2 ± 3.3 63.7 ± 3.4
0.039 Median (P25 – P75) ∇ 63.7 (60.5 – 66.2) 63.2 (59.8 – 67.2)
Minimum – maximum 58.1 – 66.7 59.8 – 68.8
Recommended LWAIng (1.6 – 1.7)
Mean ± standard deviation 60.5 ± 4.6 63.0 ± 4.5
0.003 Median (P25 – P75) ∇ 60.5 (57.1 – 64.9) 63.2 (59.6 – 66.3)
Minimum– maximum 53.2 – 66.2 56.5 – 69.3
LWAIng above the recommendation (LWA > 1.6)
Mean ± standard deviation 57.3 ± 7.4 59.4 ± 7.5
0.001 Median (P25 – P75) ∇ 55.1 (51.6 – 60.5) 57.3 (53.9 – 62.8)
Minimum– maximum 49.8 – 73.1 51.8 – 76.2
* Student’s t test for paired data; ∇: P25 concentrates 25% of the sample with values below or equal to the ones deined by P25; P50 = median: concentrates 50% of the sample with values lower or equal to the ones deined by P50; P75: concentrates 75% of the sample with values lower or equal to the ones deined by P75.
Table 3 shows that the current lean mass presented higher values than the initial lean mass, where the initial mean was 9.9kg (SD = 6.1) and final was 61.7kg (SD = 5.9). According to the Student’s t test (p < 0.001), the current lean mass mean was significantly higher than the initial lean mass.
11
According to the Guidelines by the Brazilian Society of Sports and Exercise Medicine6, the suitable ingestion of protein for strength
athletes would be from 1.6 to 1.7 grams per kilo of body weight per day. In the present study, the mean of ingestion of the sample was within the daily protein recommendations, but the majority was ingesting values above the recommendation. In a study carried out with 11 male individuals from Cascavel city, PR, practitioners of bodybuilding with muscle hypertrophy as aim, the majority (63.6%) of them ingested more than 2g/kg/day a hyperprotein diet in the majority of the individuals14. According to Duran et al.15, some studies
showed that health club goers usually have a hyperprotein diet due to fashion and lack of information and suitable guidance.
In an observational prospective study, six male bodybuilding athletes whose protein offer of 2.5g/kg weight/day did not bring additional benefit to 1.5g/kg/day to increase the protein flow and synthesis as well as positive nitrogen balance, were investigated. Increase in protein offer (2.5g/kg de weight/day) was not different concerning muscle gain16. Cyrinoet al.17, in a similar study with six
male bodybuilders suggest that protein ingestion between 1.5 and 2.5g of protein/kg body weight/day, associated with weight trai-ning, can significantly contribute to the strength and muscle mass increaseIn the present study, similar results were found in which the three classifications of LWA ingestion were statistically significant, current lean mass was higher than the initial lean mass in all groups; however, concerning the LWA ingestion within the recommended range and above recommendation, greater significant result was observed. Once again, the discussion is about the difficulty in
sta-ting the real protein needs of a population of health club goers18.
The nutritional needs in caloric terms correspond to consumption between 37 and 41kcal/kg/ weight/day for bodybuilding practitio-ners. Depending on the aims, the calorie rate may present broader variations, with calorie amount ranging between 30 and 50kcal/kg/
weight/day6. In the present study the total calorie value was below
the recommendation.
In order to optimize the muscular recovery, it is recommended that the carbohydrate consumption is within 5 and 8g/kg weight/ day. In long duration activities and/or intense training, there is need of up to 10g/kg weight/day for suitable recoveryof muscular
glycogen and/or increase of muscle mass6. In the present study,
the CHO consumption was below the recommendation, a result
corroborated in the study by Oliveira et al.14 where 90.9% of the
bodybuilding practitioners with hypertrophy aim presented glycid consumption below the recommendation. Moreover, in a study carried out in 2004 in Cotia, metropolitan region of São Paulo, with 32 students who had been practicing any physical exercise for at least three months, with frequency equal or above three times a week, the carbohydrate consumption obtained higher percentage of unsuitability, with almost half of the population (46.9%) presen-ting a hypoglycidic diet15.
Hernandez et al.6 suggest that an adult has a daily need of about
1g of fat per kg/body weight, which means 30% of the total calo-ric value (TCV) of the diet. The athletes have the same nutritional recommendation of the general population. In this sample, the lipids ingestion was higher thanthe recommendation. These data
were also found in the study by Oliveira et al.14 and corroborated
by Garcia19bodybuilders.
Figure 1. Median and interquartile amplitude for the TEV ingestion according to the use of supplements.
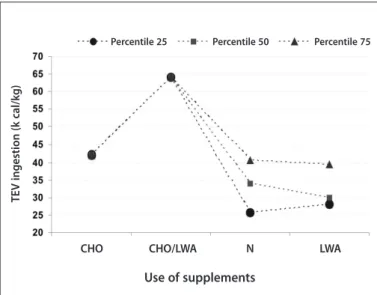
Figure 2. Median and interquartile amplitude for the LWA ingestion according to the use of supplements.
Figure 2 demonstrates the ingestion of protein-based mentation (LWA) which the individuals who did not use supple-ments (N) presented median ingestion of 1.6g/kg weight/day, while among the ones who used LWA, median ingestion was of 1.7g/ kg weight/day, which implies in absence of statistically significant difference (p > 0.05) between the two groups.
DISCUSSION
Strength training is considered the most efficient physical ac-tivity for alteration of body composition by muscle mass increase. Such alterations in body composition occur after many weeks of training11. Marciniket al.12, when following 10 young adults for 12
weeks during a training program with weights, found significant increase in lean mass (1.3kg or 2%). Similar results were found in the present study when the initial and current lean mass was compared at the moment of the assessment. In the study by Wilmore13,
alte-rations in the body mass of men submitted to 10 weeks of weight
training were not found; however, significant alterations were found
in the lean mass (+2.4%) and fat mass (-7.5%).
TE
V ingestion (k cal/k
g)
Percentile 25 Percentile 50 Percentile 75
Use of supplements
CHO CHO/LWA N LWA
Percentile 25 Percentile 50 Percentile 75
LW
A
i ngestion (g/k
g)
CHO CHO/LWA N LWA
12
Therefore, having this study as a starting point, it can be con-cluded that the sample is not characterized by LWA consumption below or within the recommendation; the majority of the indi-viduals presented characteristics of hyperprotein diet. Neverthe-less, the protein consumption within all the recommendation ranges was effective in the muscle mass gain in the bodybuilding practitioners, with ingestion within and above the recommen-ded value presenting more remarkable increase. The analysis of
the calories and other macronutrients consumption evidenced that for calories and carbohydrate in the sample in general, in-gestion was below the recommended values, but for lipids, va-lues above the recommendation were found in the daily intake of the sample.
All authors have declared there is not any potential conflict of interests concerning this article.
REFERENCES
1. Mahan LK, Escott-Stump S. Alimentos, Nutrição & Dietoterapia. São Paulo: Roca, 2005.
2. Silva LM, Moreau RL. Uso de esteróides anabólicos de grandes academias de São Paulo. Rev Bras Cienc Farm 2003;39:328-33.
3. Tirapegui J. Nutrição, Metabolismo e Suplementação na atividade física. São Paulo: Atheneu, 2005.
4. Bacurau R. Nutrição e suplementação esportiva. São Paulo: Phorte, 2000.
5. Uchida MC, Charro MA, Bacurau RF, Navarro F, Pontes JF, Marchetti PH. Manual da Muscu-lação. Uma abordagem teórico-prática ao treinamento de força. Ed. 4. São Paulo: Editora Phorte, 2006.
6. Hernandez AJ, Nahas RM, Rodrigues T, Meyer F, Zogaib P, Lazzoli JK, et al. Modificações dietéticas, reposição hídrica, suplementos alimentares e drogas: comprovação de ação ergogênica e potenciais riscos para a saúde. Rev Bras Med Esporte. 2009;15.
7. Araújo AC, Soares YN. Perfil de utilização de repositores protéicos nas academias de Belém, Pará. Revista de Nutrição Campinas 1999;12:5-19.
8. Silva SM, Mura JD. Tratado de alimentação, nutrição e dietoterapia. São Paulo: Roca, 2007. 9. Dal Bosco S, Conde RS, Machado KI. Métodos práticos para cálculos de dietas. Lageado, RS:
Univates, 2007.
10. WHO – World Health Organization. Obesity: preventing and managing the global epidemic. WHO Technical Report Series; 894. Geneva, Switzerland, 2000.
11. Fleck SJ, Kraemer WJ. Resistance Training Sports. Designing resistance training programs. 2.ed. Cham-paing IL: Human Kinetics, 1997;231-44.
12. Marcinik EJ, Potts J, Schlabach G, Will S, Dawson P, Hurley BF. Effects of strength training on lactate threshold and endurance performance. Med Sci Sports Exerc 1991;23:739-43.
13. Wilmore JH. Alterations in strength, body composition and anthropometric measurements consequent to a 10-week weight training program. Med Sci Sports Exerc 1974;6:133-8.
14. Oliveira AF, Fatel EC, Soares BM, Círico D. Avaliação Nutricional de praticantes de musculação com objetivo de hipertrofia muscular do município de Cascavel, PR. Colloquium Vitae 2009;1:44-52.
15. Duran AC, Latorre MR, Florindo AA, Jaime PC. Correlação entre consumo alimentar e nível de ativi-Correlação entre consumo alimentar e nível de ativi-dade física habitual de praticantes de exercícios físicos em academia. R Bras Ci e Mov 2004;12:15-9. 16. Maesta N, Cyrino ES, Angeleli AY, Burini RC. Efeito da Oferta Dietética de Proteína Sobre o Ganho
Muscular, Balanço Nitrogenado e Cinética da 15N-Glicina de Atletas em Treinamento de Musculação. Rev Bras Med Esporte 2008;14:215-20.
17. Cyrino ES, Maesta N, Burini RC. Aumento de força e massa muscular em atletas de culturismo suple-mentados com proteína. Revista Treinamento Desportivo 2000;5:9-18.
18. Blanco B, Suarez S. Gimnasios: um mundo de información para la confusión em nutrición. Annais Venezolanos de Nutrición 1998;11:55-65.