O
ri
gi
na
l
a
rt
ic
le
s
Prevalence of phenotypic frailty during the aging process in a
Portuguese community
Mafalda Duarte1,2 Constança Paúl1
1 Unidade de Investigação e Formação sobre Adultos e Idosos – UNIFAI. Porto, Portugal.
2 Instituto Superior de Saúde do Alto Ave – ISAVE. Póvoa de Lanhoso, Portugal.
Funding support: This work was developed in the Unity of Study and Formation on Adults and Elderly (Unidade de Investigação e Formação sobre Adultos e Idosos - UNIFAI) and it was partially funded by a doctoral scholarship by Fundação Ciência e Tecnologia (FCT), granted to the PROTEC Housing Program (SFRH/PROTEC/49236/2008).
Correspondence Mafalda Duarte
E-mail: [email protected]
Abstract
The present study is based on the conceptual model defined by Fried which explains phenotypic frailty through the presence of the following criteria: weight loss; exhaustion; low physical activity; slowness and weakness. The aim of the present study was to identify the behaviour of phenotypic frailty and outline the profile of the frail elderly person. In order to do this, a random stratified sample of 339 individuals residing in the community was obtained. A frailty protocol was developed, composed of measures related to the aging process and phenotypic frailty. The results indicated a high prevalence of this syndrome (34.9%). It occurs more frequently among women (40.9%) and at more advanced ages (60.4%). The criteria that appeared most frequently in association with frailty are low physical activity (88.9%) and slowness (86.4%). Frail elderly individuals were characterized by being widow/separated/divorced (46.7%); illiterate (71.1%); living within a family with some degree of dependence (41.6%); living in unsuitable conditions (44.9%); having limited social relations (54.2%) and not receiving social support (37.6%). It can be concluded that frailty is a prevalent condition, and that the profile of the frail individual is associated with a set of characteristics that result in greater vulnerability, which suggests possible areas of intervention to minimize and delay this syndrome.
INTRODUCTION
With increasing life expectancy levels, it is important to be able to perceive, explain and intervene in the aging process.1 According to census data, the elderly population in Brazil increased by 19% in the last decade. The normal course of the aging process is correlated with a gradual decline in functional abilities. Elderly individuals who are at a high risk of decline are described as frail.2 The term frailty was rarely used in literature prior to 1980. Since then, there has been a significant increase in studies referring to frail elderly individuals.3 The origin of this concept lies in biological approaches, which characterized the first studies of this issue.4,5 In literature, there is a clear evolution of the study of frailty, which is ongoing and has led to a more extensive approach that contemplates nutritional, psychological, cognitive and social factors related to the aging process.6 In general, there are two main multidimensional approaches to explaining frailty in the elderly populaiton.7,8 A quantitative approach9 was developed by the Rockwood team,10 whereas a more qualitative style can be seen in the studies developed by Fried.11 Different practical implications have emerged from this theoretical basis of the conditions of frail elderly individuals.12 Given the lack of investigative studies of this nature in Portugal, the aim of the present study was to analyze phenotypic frailty in a community-based population. The cycle of frailty13,14 indicates that certain biological factors amalgamate the physiological abnormalities experienced by older people. The results of the Cardiovascular Health Study (CHS)11 explained phenotypic frailty through the presence of three or more of the following criteria: 1) weight loss: non-intentional weight
loss in the previous year (≥ 5% of body weight
in the previous year); 2) resistance (exhaustion): self-reported fatigue, identified by two questions on the Depression Scale created by the Center of Epidemiological Studies (CES-D); 3) the level of physical activity: the result is calculated based on the amount of kilocalories (kcal) used per week and measured based on the self-report of the physical activities and exercise performed; 4) slowness: measured by the walking speed and indicated in seconds (distance of 4.6 m); 5) weakness: decrease
in strength (measured using a dynamometer). Based on these classifications, the authors defined three levels of frailty: a subject who exhibits three (or more) of these criteria is considered “frail”; those who exhibit one or two of these indicators are classified as “pre-frail”; and those who exhibit no impairment are considered “robust” (no frailty). Longitudinal studies claim that this syndrome leads to situations of disability, hospitalization, institutionalization and death.15
This was a pioneer investigative study in Portugal which sought to characterize the profile of frail elderly individuals in sociodemographic terms.
METHODS
Sample
The present study was developed in Portugal, in the county of Guimarães, using a randomly stratified sample, which ensured the representativeness of the study population. The creation of the two age groups was based on data
from the Census of 2001,16 which defined the
following age groups: between 50 and 59 years (39.5%), 134 subjects; between 60 and 69 years (31.6%), 107 subjects; between 70 and 79 years (19.8%), 67 subjects; and 80 years or more (9.1%), 31 subjects, giving a total of 339 respondents. The inclusion criterion was anybody aged 50 years or more. This would enable us to discover the profile of the study population and the trajectory of frail elderly individuals, thereby favoring early interventions. No exclusion criteria were defined.
Instrument
and Richardson);17 indicators of physical health and functionality (Questionnaire on Geriatric Risk Indicators; Katz Index of Functional Assessment (Katz);18 Lawton and Brody´s Assessment Scale for Instrumental Activities of Daily Living (Lawton & Brody);19 and psychosocial dimensions (Geriatric Depression Scale [15 item version] (Sheikh & Yesavage);20 the Mini Mental State Examination (Folstein et al.)21 and the WHO’s Quality of Life Scale [WHOQOL – Bref] (Canavarro et al.).22 The criteria of phenotypic frailty were also included in the assessment protocol. Similar to previous investigative studies that tested phenotypic frailty, the authors developed a model based on the original.23-28 The present study also proposed an adjusted model of frailty, with the following integrated criteria:
• Weight loss: Have you gained or lost weight for no apparent reason in the last six months?Have you been eating less due to a loss of appetite? (Measured with a Soehnle scales);
• Resistance (exhaustion): Geriatric Depression Scale (GDS) – Do you feel full of energ y?;20
• Physical activity (energy expenditure):
Pastime Scale – Do you engage in sports activities (swimming, cycling, walking, g ymnastics, fitness)?;
• Slowness: Timed Up and Go (<10 seconds = independent; 10 seconds = dependent in some way);29
• Weakness (hand strength): measured using
a Support/GRIP-D dynamometer (stratified
for gender – Men ≥ 31 kg; Women ≥ 18kg).30
Data Collection Procedure
A team of ten technicians was created for the data collection process, containing professionals from the areas of nursing, psychology and social services. In order to select and recruit these professionals, an interview guide was created, which determined their experience in the area and their motivational bases. The training sessions were monitored in three phases: 1) the framework
of the aims of the research; 2) the presentation and sharing of the specific criteria for the administration of the protocol and; 3) role-play and problem solving. This was conducted in an attempt to increase congruence and reliability during the data collection process. Two-person teams were created, containing technicians from different areas of specialization, thereby promoting the merging of skills during the data collection process. The data was collected personally in the home of the elderly participants, where each protocol involved a mean application time of 45/60 minutes. The field work took place over a period of six months and satisfied the principles of anonymity, confidentiality and voluntary participation, while also respecting the principles of autonomy, beneficence, non-maleficence, justice and integrity, as per the Helsinki Declaration (1964) and the Nuremberg Code (1949). The present study received approval from the Research Ethics Committee of the ICBAS-Universidade do Porto. All of the participants signed a free and informed consent form.
RESULTS
The results are presented in four levels of different analysis. We began by characterizing the sample from a sociodemographic point of view. Subsequently, we analyzed the prevalence of phenotypic frailty and how the frailty criteria were distributed in the study sample. Finally, we presented the profile of elderly individuals who are frail due to demographic determinants.
Sociodemographic characterization of the sample
Prevalence of phenotypic frailty
Based on the phenotypic frailty11 and
considering the criteria defined in the adjusted model used in this investigation, we analyzed the prevalence of the criteria of frailty. It is important to highlight that one of the subjects was eliminated from the study for not completing these criteria in
full. This individual was therefore excluded from the final sample. Considering the three levels of frailty, 14.2% of the elderly individuals did not score points for any of the five criteria, while 172 (50.9%) individuals scored between 1 and 2 points and 118 (34.9%) scored between three and five points for the criteria defined by phenotypic frailty (Table 2).
Table 1. Sociodemographic characterization. Guimarães. Portugal. 2015.
N %
Gender
Male 158 46.6
Female 181 53.4
Age (m. sd) 64.4 (9.25)
Marital status
Single 17 4.7
Married 277 82.0
Widowed/Separated/Divorced 45 13.3
Education
Incomplete 38 11.2
Complete 301 88.8
Table 2. Prevalence of phenotypic frailty. Guimarães. Portugal. 2015.
Criteria N= 338
n % n %
No frailty 0 criterion 48 14.2 48 14.2
Pre-frail 1 criterion 63 18.6 172 50.9
2 criteria 109 32.2
Frail
3 criteria 74 21.9
118 34.9
4 criteria 39 11.5
In order to understand how phenotypic frailty is correlated with gender and age, the variable age was categorized. Based on the analysis in Table 3, the distribution of gender was equal for all levels of frailty, with the exception of frail elderly individuals (40.9% female and 28.4% male). Concerning the distribution in the three age groups defined, the percentages related to the frailty criteria were higher with advancing age. Notably, all of the participants aged 75 years or more were classified as frail. This age group was divided between pre-frail (37.7%) and frail (60.4%). In the 65 to 74 years age group, the distribution was spread throughout all groups, although there was a greater concentration in the pre-frail and
frail groups, with 44.1% and 45.2%, respectively. Only 10.8% of the cases in the 65 to 74 years age group were considered to exhibit no frailty. In the youngest age group (50 to 64 years), most of the participants were classified as pre-frail (57.5%), with the remainder divided equally between the robust (no frailty) and frail groups (20.0% and 22.5%, respectively). Based on these results, it seems clear that there is a need to provide early treatment when this syndrome manifests, given that half of the individuals aged between 50 and 64 years in the present study were classified as pre-frail. In the oldest group, 60.4% were classified as frail. Thus, more than half of the population over 75 years is considered frail.
Table 3. Distribution of phenotypic frailty by gender and age. Guimarães, Portugal, 2015.
No Frailty Pre-Frail Frail
Population n % n % n %
Gender
Female 181 25 13,8 82 45,3 74 40,9
Male 157 23 14,6 90 57,0 44 28,4
Age
50-64 193 38 20,0 111 57,5 44 22,5
65-74 93 10 10,8 41 44,1 42 45,1
≥75 52 0 0,0 20 37,7 32 60,4
In order to understand how each criteria of the phenotype is correlated with the level of frailty (Table 4), only the frail and pre-frail cases were considered. Those classified without frailty could not be used for any of the criteria in this analysis. For the pre-frail individuals, slowness and physical activity were the most relevant indicators, with values of 55.2% and 53.5%, respectively. The least relevant indicators were resistance (7.5%) and weight loss (14.5%).
Profile of the frail elderly individual
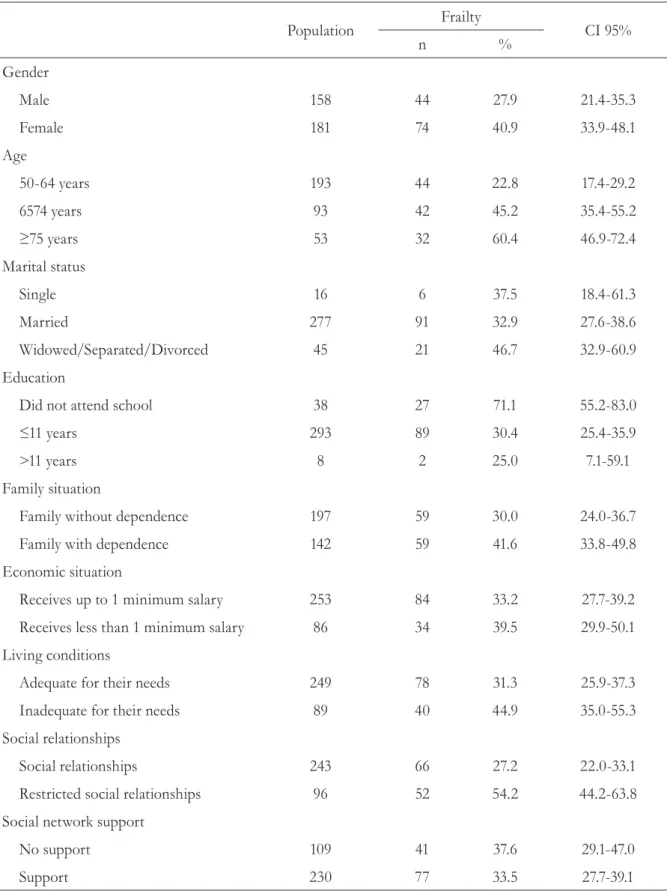
While analyzing the prevalence of phenotypic frailty, considering the sociodemographic characteristics, Vassar Statistics* software was used to calculate the upper and lower limits for the delimitation of the confidence intervals (95%). In the data analysis, a greater prevalence of frailty was confirmed among women (40.9%) and among the oldest elderly individuals: between 65 and 74 years (45.2%) and those aged 75 years or more (60.4%). Concerning marital status, the prevalence of frailty was notable among those who were widowed, separated or divorced (46.7%), while the value was slightly lower for those who were single (37.5%). Concerning the level of education, the prevalence of frailty was higher among those with less education (71.1% of the frail did not attend school; 30.4% completed 11 years of schooling or less and 25% completed more than 11 years of educational studies). Concerning the family environment, 41.6% of those classified as frail are part of a family containing at least one dependent member. These data are significant, since it is clear that frail individuals live in a
* (http://faculty.vassar.edu/lowry/VassarStats.html)
family environment that is characterized by a certain form of dependence. Concerning their economic situation, the prevalence of frailty was more common among those with less economic power. In total, 39.5% of those classified as frail received less than one minimum salary per month. In terms of their living conditions, frailty was more common among those who lived in less favorable housing conditions: 44.9% of those classified as frail admitted that their home was inadequate for their needs. Concerning social relationships, frailty was more common among people who had restricted social relationships: 54.2% of those classified as frail had a limited social network. Concerning the support of a social network, 37.6% of those classified as frail did not have any support on a social level.
As can be seen in Table 5, the most fragile individuals in the study sample were female, in the older age groups, with a low level of education (illiterate). Concerning the family environment, they generally lived with family members who were dependent, and their living conditions were considered inappropriate. In the social dimension, frail elderly individuals tend to establish limited (reduced) relationships and do not have any type of support related to social responses.
Table 4. Frailty criteria by levels. Guimarães. Portugal. 2015.
Criteria
Pre-Frail N=172
Frail N=118
n % n %
Weight loss 25 14.5 47 40.0
Resistance 13 7.5 61 51.6
Physical activity 92 53.5 105 88.9
Slowness 95 55.2 102 86.4
Table 5. Profile of frail elderly individuals based on sociodemographic characteristics. Guimarães. Portugal. 2015.
Population Frailty CI 95%
n %
Gender
Male 158 44 27.9 21.4-35.3
Female 181 74 40.9 33.9-48.1
Age
50-64 years 193 44 22.8 17.4-29.2
6574 years 93 42 45.2 35.4-55.2
≥75 years 53 32 60.4 46.9-72.4
Marital status
Single 16 6 37.5 18.4-61.3
Married 277 91 32.9 27.6-38.6
Widowed/Separated/Divorced 45 21 46.7 32.9-60.9
Education
Did not attend school 38 27 71.1 55.2-83.0
≤11 years 293 89 30.4 25.4-35.9
>11 years 8 2 25.0 7.1-59.1
Family situation
Family without dependence 197 59 30.0 24.0-36.7
Family with dependence 142 59 41.6 33.8-49.8
Economic situation
Receives up to 1 minimum salary 253 84 33.2 27.7-39.2
Receives less than 1 minimum salary 86 34 39.5 29.9-50.1
Living conditions
Adequate for their needs 249 78 31.3 25.9-37.3
Inadequate for their needs 89 40 44.9 35.0-55.3
Social relationships
Social relationships 243 66 27.2 22.0-33.1
Restricted social relationships 96 52 54.2 44.2-63.8
Social network support
No support 109 41 37.6 29.1-47.0
DISCUSSION
The sample of the present study mainly contained women, who were mostly married, with a mean age of 64.4 years. A significant percentage of these individuals were illiterate.
Concerning the prevalence of phenotypic frailty, the impact of this syndrome on the population was clear, with 34.9% of the sample considered frail. Similar to previous studies that tested phenotypic frailty, this result is within the interval detected, which ranges from 4.0 to 59.1%.31 However, the prevalence of frailty varies widely due to the definition of the concept (which has implications on the assessment instruments used) and the population studied. In the present study, more than half of the sample (50.9%) was classified as pre-frail, which is a similar result to those recorded in earlier studies.27,32 This finding is significant, since longitudinal studies in the literature support the idea that individuals in this stage of life exhibit a great possibility of becoming frail over time.24
Upon analysis of the prevalence of the levels of frailty by gender, it was clear that more women were classified with this condition (40.9%). These results are similar to those found in an epidemiological study conducted by Fried,11 in which frailty was also more common among women. Fernandez-Bolaños33 also identified that the prevalence of frailty was significantly greater among women than among men in their study population. Concerning age, older people in the present study were classified as more frail (60.4%), which is similar to an earlier study,31 in which the authors concluded that the condition of frailty increases with advancing age. The results of the present study are in line with those found in the literature, since they demonstrated that individuals with a more advanced age are more likely to become frail elderly individuals.12
The most significant criteria of phenotypic frailty among the pre-frail were slowness (55.2%) and low levels of physical activity (53.5%). The most significant criteria of phenotypic frailty
among the frail were also slowness (86.4%) and low levels of physical activity (88.9%). Considering these results on a multidimensional level, it seems that the participants of the present study experienced a set of early indicators of the process of senescence, which could be correlated with the prevalence of frailty.
Upon analysis of the prevalence of this condition based on sociodemographic characteristics (other than gender and age), it was found that the condition was more prevalent among those who were widowed/separated/divorced (46.7%) and illiterate (71.1%). Several studies have indicated that absent or reduced social relationships (due to marital status) can lead to an individual becoming frailer, given that they socialize less and are less active.34 These assumptions were also put forth in an explanatory model defended by Rockwood,34 in which frailty was correlated with socially isolated individuals.10 Furthermore, Fried11,15 reported a greater prevalence of frailty among populations with a low level of education. Concerning the social and family environment, frail individuals were more often found in families containing a member with some degree of dependence (41.6%). This finding is confirmed in literature, given that an overload of caregiving responsibilities is considered a predisposing factor for frailty among elderly individuals.35 People with unfavorable economic conditions (39.5%) and inadequate living conditions (44.9%) seem to be frailer. The results show that these individuals have more limited social networks (54.2%) and have no support from a social network (37.6%). Therefore, it seems clear that the profile of the frail elderly individual is guided by a set of characteristics related to weakness on social and interpersonal levels. Several studies in the literature have indicated that the incidence of frailty is correlated with a low socioeconomic level.36-38 A number of researchers have claimed that frailty is influenced by poverty.12 According to Morley,39 poor social conditions worsen the physiopathology of the syndrome of frailty. This
statement corroborated the findings of Woo,40
The present study contains a number of limitations related to the variables that made up the protocol. In future studies, it would be pertinent to include other variables, such as nutritional status and lifestyle. It would also be beneficial to define the exclusion criteria, which are essentially related to the presence or absence of the pathology. These modifications would provide the authors with a more reliable phenotypic percentage.
CONCLUSION
This investigative study (a pioneer study in Portugal) is relevant since it expands conceptual knowledge of frailty and tests these measurements
among elderly individuals in a representative sample of the population. Thus, the present study sought to provide tools for geriatric practice, as well as for future research projects. Based on the theoretical model adopted, it was possible to conclude that this problem exhibits a significant prevalence in the elderly population in the community studied. This result strengthens the need for increased care concerning frailty, bearing in mind that it is more common among women of advancing age and has been correlated with adverse personal and social characteristics. Awareness of this problem will lead to the creation and implementation of timely preventive measures that can delay or minimize this syndrome in the elderly population.
REFERENCES
1. Intituto Nacional de Estatística. Censos 2011: resultados definitivos. Lisboa: INE; 2011.
2. Corapi KM, Mcgee HM, Barker M. Screening for frailty among seniors in clinical practice. Nat Clin Pract Rheumatol 2006;2(9):476-80.
3. Bergman H, Ferrucci L, Guralnik J, Hogan DB, Hummel S, Karunananthan S, et al. Frailty: an emerging research and clinical paradigm: issues and controversies. J Gerontol Ser A Med Sci 2007;62(7):731-7.
4. Buchner DM, Wagner EH. Preventing frail health. Clin Geriatr Med 1992;8(1):1-17.
5. Campbell AJ, Buchner DM. Unstable disability and the fluctuations of frailty. Age Ageing 1997;26(4):315-8.
6. Levers MJ, Estabrooks CA, Ross KJC. Factores contributing to frailty: literature review. J Adv Nurs 2006;56(3):282-91.
7. Abellan Van Kan G, Rolland Y, Bergman H, Morley JE, Kritchevsky SB, Vellas B. The I.A.N.A Task Force on frailty assessment of older people in clinical practice. J Nutr Health Aging 2008;12(1):29-37.
8. Pel-Little RE, Schuurmans MJ, Emmelot-Vonk MH, Verhaar HJ. Frailty: defining and measuring of a concept. J Nutr Health Aging 2009;13(4):390-4.
9. Strandberg TE, Pitkãlã KH, Tilvis RS. Frailty in older people. Eur Geriatr Med 2001;2:344-55.
10. Rockwood K, Howlett SE, Macknight C, Beattie BL, Bergman H, Hébert R, et al. Prevalence, attributes, and outcomes of fitness and frailty in community- dwelling older adults report from Canadian study of health and aging. J Gerontol Ser A Biol Sci Med Sci 2004;59:1310-7.
11. Fried LP, Tangen C, Walston J, Newman AB, Hirsch C, Gottdiener J, et al. Frailty in older adults: evidence for phenotype. J Gerontol Ser A Biol Sci Med Sci 2001;6(3):146-56.
12. Markle RM, Browne G. Conceptualization of frailty in relation to older adults. J Adv Nurs 2003;44(1):58-68.
13. Fried LP. Frailty. In: Hazzard WR, Bierman RL, Blass JP, Ettinger WH, Halter JB, editors. Principles of Geriatric Medicine and Gerontology. 4th ed. New York: McGraw Hill; 1994. p. 119-156. .
14. Waltson J, Fried LP. Frailty and the older man. Med Clin North America 1999;83(5):1173-94.
15. Fried LP, Ferrucci L, Darer J, Williamson JD, Anderson G. Untangling the concepts of disability, frailty and comorbidity: implications for improved targeting and care. J Gerontol Ser A Biol Sci Med Sci 2004;59(3):255-63.
16. Instituto Nacional de Estatística. Censos 2001: resultados definitivos. Lisboa: INE; 2002.
Received: August 19, 2014 Revised: April 26, 2015 Accepted: July 7, 2015
18. Katz S, Amasa B, Ford MD, Roland WM, Beverly A, Jackson BS, et al. Studies of illness in the aged. The index of ADL: a standardized measure of biological and psychosocial function. J Am Med Assoc 1963;185:914-9.
19. Lawton M, Brody E. Assessment of older people: self maintaining and instrumental activities of daily living. Gerontologist 1969;9(3):179-86.
20. Sheikh JI, Yesavage JA. Geriatric Depression Scale (GDS). Recent evidence and development of a shorter version. Clin Gerontol 1986;5(1-2):165-73.
21. Guerreiro M, Silva AP, Botelho MA, Leitão O, Castro C, Garcia C. Adaptação à população portuguesa na tradução do Mini Mental State Examination (MMSE). Rev Port Neurol 1994; 1:9-10.
22. Canavarro MC, Simões MR, Vaz Serra A. WHOQO-Bref: versão em Português de Portugal do
Instrumento Abreviado de Avaliação de Qualidade de vida da Organização Mundial de Saúde. Lisboa: Fundação Calouste Gulbenkian; 2006.
23. Woods FN, La Croix AZ, Gray SL. Frailty:
emergence and consequences in women aged 65 and older in the Women´s Health Initiative Observational Study. J Am Geriatr Soc 2005;53(8):1321-30.
24. Gill TM, Evelyne A, Gahbauer A, Allore HG, Han L. Transitions between frailty states among community-living older persons. Arch Int Med 2006;166(4):418-23.
25. Cawthon PM, Marshall LM, Michael Y, Dam TT, Ensrud KE, Barret-Connor E, et al. Frailty in older men: prevalence, progression and relationship with mortality. J Am Geriatr Soc 2007;55(8):1216- 23.
26. Ávila- Funes JA, Helmer C, Amieva H, Barbeger-Gateau P, Le Golff M, Richie K, et al. Frailty among community-dwelling elderly people in France: the Three- City Study. J Gerontol Ser A Biol Sci Med Sci 2008;63(10):1089-96.
27. Santos - Eggimann B, Cuénoud P, Spagnoli J, Junod J. Prevalence of frailty in middle-aged and older community-dwelling living in 10 countries. J Gerontol Ser A Biol Sci Med Sci 2009;64(6):675-81.
28. Rochat S, Cumming RG, Blyth F, Creasey H, Handelsman D, Le Couteur DG, et al. Frailty and use
health community services by community-dwelling older men: the Concord Health and Ageing in men project. Age Ageing 2010;39(2):228-33.
29. Podsiadlo D, Richardson S. The timed “Up and Go” test of basic functional mobility for frail elderly persons. J Am Geriatr Soc 1991;39(2):142-8.
30. Kerr A, Syddall HE, Cooper C, Turner GF, Briggs RS, Sayer AA. Does admission grip strength predict length of stay in hospitalized older patients. Age Ageing 2006;35(1):82-4.
31. Collard RM, Boter H, Schoevers RA. Prevalence of frailty in community- dwelling older persons: a systematic review. J Am Geriatr Soc 2012;60(8):1487-92.
32. Graham JE, Snih SA, Berges IM, Ray LA, Markides KS, Ottenbacher KJ. Frailty and 10-year mortality in community-living Mexican American older adults. Gerontology 2009;55(6):644-51.
33. Fernandez- Bolaños M, Otero A, Zunzunegui MV, Beland F, Alarcón T, De Hoyos, et al. Sex differences in the prevalence of frailty in a population aged 75 and older in Spain. J Am Geriatr Soc 2008;56(12): 2370-1.
34. Rockwood K, Fox RA, Stolee P, Robertson D, Beattie BL. Frailty in elderly people: an evolving concept. Can Med Assoc J. 1994;150(4):489-95.
35. Tomomitsu MR, Lemos ND, Perracini MR. Prevalence and associated factos to frailty among senior caregivers. Geriatr Gerontol 2010;4(1):3-12.
36. Topinkóva E. Aging, disability and frailty. Ann Nutr Metab 2008;52 Supl 1: 6-11.
37. Corner CE. Frailty: the looming epidemic. Ala Nurse 2009;35(4):25-6.
38. Lang IA, Hubbard RE, Andrew MK, Llewellyn DF, Melzer D, Rockwood K. Neighborhood deprivation, individual socioeconomic status, and frailty in older adults. J Am Geriatr Soc 2009;57(10):1776-80.
39. Morley JE, Mitchell HP, Miller DK. Something about frailty [editorial]. J Gerontol Ser A Biol Sci Med Sci 2002;57(11):698-704.
40. Woo J, Goggins W, Shama A, Ho SC. Social