Influence of the Self-Reported Skin Color on the Prevalence of
Metabolic Syndrome in an Urban Brazilian Population
Paulo José Bastos Barbosa, Ines Lessa, Naomar de Almeida Filho, Lucélia Batista N. Cunha Magalhães, Jenny Araújo
Collective Health Institute; Universidade Federal da Bahia (UFBA), Salvador, BA, Brasil.Abstract
Background: The metabolic syndrome (MS) has a high prevalence in different parts of the world, with variations between different ethnic groups.
Objective: This study aims at exploring the influence of the self-reported skin color on the prevalence of MS
Methods: Cross-sectional study, carried out in a population subgroup (n=,49 adults) in Salvador, Brazil. The self-reported skin color (white, mulatto or black) was used as well as the MS criterion of ATP-III. The Chi-square test for tendency was used to analyze the prevalence gradient between the groups and logistic regression, for association analysis.
Results: The general prevalence of MS, adjusted for potentially confounder variables, did not differ among whites
(.%), mulattos (.%) and blacks (.4%). The analysis by sex showed, among men, a reduction in the MS prevalence of whites (6.%, 95%CI: 0.7–.7), in comparison to blacks (7.5%, 95%CI: .–.8) and an intermediate prevalence among mulattos, .9%, 95%CI: 8.6–5., p tend. = 0.00. Among the women, the tendency was the opposite, being higher among the blacks, 7.0%, 95%CI: .–.8, and lower among the whites, 0.5%, 95%CI: 5.6–5.4, p tend. = 0.0. The multivariate analysis of the association between skin color and MS (white = group of reference) showed that the black color of the skin was a protective factor among black men, with a prevalence ratio (PR) = 0.60 (0.6–0.97), whereas it tended to be a risk factor among black women, with a PR = . (0.94–.78).
Conclusion: The prevalence of MA presented an inverse variation according to the color of skin between men and women. To be black was a protective factor among men and a risk factor among women. (Arq Bras Cardiol 00; 94() : -9)
Key-words: Metabolic syndrome; prevalence; color; skin; population; Salvador (BA); Brazil.
Introduction
The Metabolic Syndrome (MS) is characterized by a set of abnormalities (arterial hypertension and alterations in the lipid and glycidic metabolism) often correlated with insulin resistance1 and central obesity and is strongly associated
with the development of atherosclerosis. Currently, MS has been identified as one of the most potent and investigated determinant factors of cardiovascular diseases and of type 2 diabetes mellitus (DM2)2-8.
The MS has high prevalence; however, the analyses of its associations with several variables have shown aspects that need to be clarified. Among these are the associations with distinct ethnic/racial groups and the identification of the sex variable as a modifier of the effect of this association 9-14. In the United States, Ford et al10, in 2001, verified that
the MS prevalence among African descendants, when
Mailing Address: Paulo José Bastos Barbosa •
Rua Amazonas, 216 - Cond. Pituba Ville Nº 229 - Residencial Paul Gauguin, Apto. M302 – Pituba - 41830-380 - Salvador, BA, Brazil.
E-mail: [email protected], [email protected]
Manuscript received June 29, 2008; revised manuscript received December 06, 2008; accepted on December 12, 2008
compared to Whites, was higher among women (25.7% vs. 22.8%) and lower among men (16.4% vs. 24.8%)10.
It has also been observed that the prevalence of risk factors that characterize the MS substantially differ among distinct ethnic groups, with a different behavior between genders9,10,15. Considering, on the one hand, that the current
different prevention strategies allow the early identification of populations and individuals, as well as intervention on those exposed to higher cardiovascular risk, and on the other hand, that the city of Salvador is the capital city with the highest degree of miscegenation of African descendants in the country, the aim of this study was to analyze the influence of the self-reported color of the skin on the prevalence of MS in men and women, in an attempt to find possible explanations for eventual differences between the analyzed groups.
Methods
This is a cross-sectional study, using the sample from the Cardiovascular Disease and Diabetes Mellitus Monitoring Project (MONIT)16, carried out in the capital city of
arterial hypertension of 25%, 95% confidence level and design error of 2%.
As the project included several other objectives, the “n” was increased to approximately 2,500 people, estimating 1.7 eligible individuals per household. A 20% loss was predicted due to several reasons. The sampling was carried out at three stages: 1) the census sectors of 8 of the 10 hydrographic basins of the city, with similar sociodemographic characteristics, were grouped in 108 “Research Areas” and the latter were classified by socioeconomic level (SEL): high, mixed or low. The areas contained 16,592 households, with around 83,000 inhabitants aged ≥ 20 years. Proportionally to the number of sectors in each SEL, 37 were probabilistically drawn by lot; per systematic sample (interval = 10), 1,540 households were drawn by lot, with a loss of 18.3% and favorable response to participation of 1,258 families from 63 census sectors; 3) at the third stage, the participants were chosen by drawing lots, with a maximum of two participants per household, one of each sex, excluding pregnant women16.
The project was submitted to and approved by the Medical Ethics Committee of the Regional Council of Medicine of the State of Bahia and all participants signed the Free and Informed Consent Form.
The global sample included 2,404 individuals, who answered questions about risk factors for cardiovascular disease (CVRF) and DM, had six blood pressure (BP) measurements and two measurements of the waist circumference (WC) at home. A total of 1,546 participants came in for blood collections as well as weight and height measurements (64.3% of the sample) and a final sample of 1,437 individuals were analyzed in this study (92.9% of those that completed the protocol).
The skin color was self-defined by the studied individuals as one of the following categories: white, mulatto and black, according to the definitions used in the demographic censuses of the Brazilian Institute of Geography and Statistics (IBGE)17. The use
of the self-reported skin color sought to understand, particularly, aspects of the ethnic-social field and, implicitly, the cultural aspects of the studied population and thus considered in this study. The question of the skin color for the self-classification as white, mulatto or black, predicted to be closed, was not accepted by around 20% of the population, who self-classified using 18 other connotations of skin color/ethnicity. Some examples are fair, light-skinned, brunet, dark-skinned, negro, “cabo-verde”, sarara (light-haired mulatto), light brunet, medium mulatto and dark mulatto, dark, colored, brown, etc.
These data were reclassified in the three predicted categories. The terms “fair”, “light-skinned” and “light brunet” were considered equivalent to White (in Salvador, state of Bahia, people with white/fair skin and no facial characteristics that are typical of African-descendants receive this denomination), whereas the terms “black”, “dark”, “colored” and “negro” were classified as Black. The others were classified as Mulattos.
The socioeconomic level (SEL) was defined according to the criterion used in Brazil by IBGE18, resulting from the
sum of pre-established scores for availability and quantity of specified real estate and assets, availability of house employees and level of schooling of the head of the family. The original
classification of the A to E strata was grouped in this study as A+B (high SEL), C (medium SLE) and D+E (low SEL).
The level of schooling was categorized in three strata: a) high (Complete High School, Complete or Incomplete College or University); b) medium (Complete Elementary School or Incomplete High School); c) low (illiterate or incomplete Elementary School).
Individuals that performed a mild physical activity (walking, swimming, cycling or dancing for ≥ 4 hours a week), moderate physical activity (running, gymnastics or soccer playing for
≥ 3 hours a week) or intense physical activities (training for competition) were considered as practicing physical activity in leisure time.
The following procedures were performed:
a) BP was measured in two blocks of three measurements (10-minute interval between the blocks); the mean of the five last measurements was obtained.
b) The waist circumference (WC) was measured as a whole unit in centimeters (cm) at the level of the natural waist (the narrowest part between the thorax and hips), with the individual breathing softly, in the standing position, feet placed side-by-side, with body weight distributed uniformly;
c) Height and weight were measured for the body mass index (BMI) calculation, using standardized equipment, sporadically verified by INMETRO (The National Institute of Metrology, Standardization and Industrial Quality);
d) After a 12-hour fast, biochemical analyses of glycemia (Labtest in fluorinated plasma), cholesterol (Tender enzymatic method), triglycerides (modified Soloni technique) and HDL cholesterol (Labtest) were performed.
The metabolic syndrome was defined according to the revised criteria of ATP III19, adjusting CC values for our
population20, characterizing the diagnosis of MS by the
presence, in the same individual, of three or more of the following abnormalities: a) abdominal obesity determined by the WC (> 84 cm for women and > 88 for men); b) hypertriglyceridemia (≥ 150 mg/dl); low HDL-c (< 40 in men and < 50 in women); c) arterial hypertension (≥130/85 mmHg) or current drug treatment for arterial hypertension; d) hyperglycemia (fasting glycemia ≥ 100 mg/dl) or current drug treatment for diabetes mellitus (DM).
The MS was the dependent variable; the skin color, however, was the main independent variable. Age, level of schooling, SEL, smoking status, alcohol consumption and exercise practice were co-variables of interest. In all analyses, the gender variable was treated as a modifier of effect.
Statistical Analysis
Considering gender a modifier of effect in the association between MS and ethnicity9-12, the association between MS and
The gross and adjusted prevalence and 95%CI of the MS and its components were measured separately, at the skin color variable strata between men and women.
The logistic regression model was used to analyze the association between MS and skin color in both sexes and the influence of the variables with a potential for confounding and interaction. The prevalence ratio (PR) with its 95%CI was the measurement of the used association, estimated based on the Odds Ratio (OR), relrisk procedure (STATA package). The confounding was defined as a difference ≥ 10% between the gross and adjusted PR. For the selection of the confounding variables, we also considered the current scientific knowledge in the literature. The interaction was evaluated through the maximum likelihood ratio test, considering a p < 0.05 as the level of statistical significance. The “White” color of skin was considered as the reference in the comparisons of MS prevalence among the skin color groups. The statistical package STATAtm, version 7.0, was used for the statistical analysis.
Results
The studied subgroup was similar to the original sample, except for the higher frequency of individuals with low SEL (55.2% vs. 59.9%) and low level of schooling (43.2 vs. 47.5%), among women20. There was a loss of information on the skin
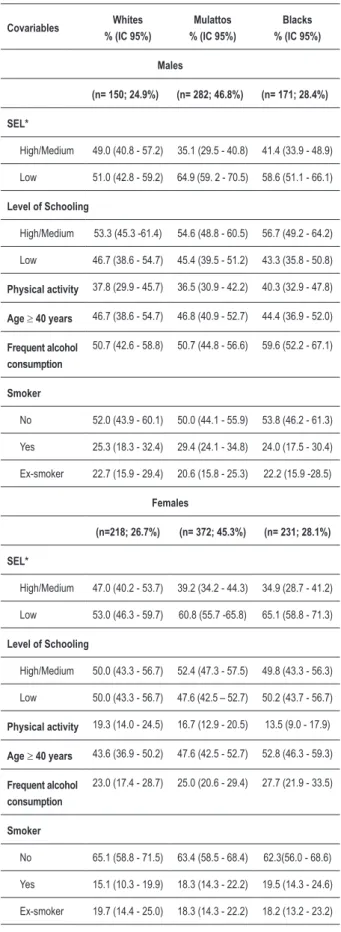
color in 13 questionnaires. Of the 1,424 participants, 603 (42.3%) were males and 821 (57.7%) were females. The distribution of whites, mulattos and blacks in the male sex was 24,.9%, 46.8% and 28.3%, respectively and 26.6%, 45.3 and 28.1% in the female sex, respectively. The characteristics of the population at the different strata of skin color in the male sex had the following results: Whites tended to have the highest SEL; the physical activity in leisure time and higher alcohol consumption, however, were more frequent among the Blacks, who also tended to be younger; a lower SEL and the habit of smoking predominated among the mulattos (Table 1). In the female sex, a higher SEL and physical activity in leisure time were more frequent among the Whites, with a decreasing gradient towards the Blacks. Age, alcohol consumption and the habit of smoking showed an increasing gradient from the Whites to the Blacks; the level of schooling was similar among the three groups of women (Table 1).
Table 1 also shows more significant differences of white males in relation to women regarding physical activity, with a two-fold difference; 2.2-two-fold difference for alcohol consumption; and a 1.7-fold difference for smoking. Among the mulattos, it was observed that the differences were similar and among Blacks, it was verified that men presented a 1.2-fold higher SEL, developed physical activity in leisure time 3-fold more often and consumed 2.2-fold more alcohol, whereas the women predominated in the age range ≥ 40 years.
The prevalence of MS increases with age, doubling for each decade between 20 and 49 years (6.9% from 20 to 29 years; 14.3% from 30 to 39 years; 32.4 % from 40 to 49 years) and reaching 40.9% from the age of 50 years onward (similarly among whites, mulattos and blacks) (Figure 1).
The prevalence of MS, with and without adjustment (by age, physical activity at leisure time, smoking status, SEL and level of schooling) was similar among whites (23.3%); mulattos
Covariables Whites
% (IC 95%)
Mulattos % (IC 95%)
Blacks % (IC 95%)
Males
(n= 150; 24.9%) (n= 282; 46.8%) (n= 171; 28.4%)
SEL*
High/Medium 49.0 (40.8 - 57.2) 35.1 (29.5 - 40.8) 41.4 (33.9 - 48.9)
Low 51.0 (42.8 - 59.2) 64.9 (59. 2 - 70.5) 58.6 (51.1 - 66.1)
Level of Schooling
High/Medium 53.3 (45.3 -61.4) 54.6 (48.8 - 60.5) 56.7 (49.2 - 64.2)
Low 46.7 (38.6 - 54.7) 45.4 (39.5 - 51.2) 43.3 (35.8 - 50.8)
Physical activity 37.8 (29.9 - 45.7) 36.5 (30.9 - 42.2) 40.3 (32.9 - 47.8)
Age≥ 40 years 46.7 (38.6 - 54.7) 46.8 (40.9 - 52.7) 44.4 (36.9 - 52.0)
Frequent alcohol consumption
50.7 (42.6 - 58.8) 50.7 (44.8 - 56.6) 59.6 (52.2 - 67.1)
Smoker
No 52.0 (43.9 - 60.1) 50.0 (44.1 - 55.9) 53.8 (46.2 - 61.3)
Yes 25.3 (18.3 - 32.4) 29.4 (24.1 - 34.8) 24.0 (17.5 - 30.4)
Ex-smoker 22.7 (15.9 - 29.4) 20.6 (15.8 - 25.3) 22.2 (15.9 -28.5)
Females
(n=218; 26.7%) (n= 372; 45.3%) (n= 231; 28.1%)
SEL*
High/Medium 47.0 (40.2 - 53.7) 39.2 (34.2 - 44.3) 34.9 (28.7 - 41.2)
Low 53.0 (46.3 - 59.7) 60.8 (55.7 -65.8) 65.1 (58.8 - 71.3)
Level of Schooling
High/Medium 50.0 (43.3 - 56.7) 52.4 (47.3 - 57.5) 49.8 (43.3 - 56.3)
Low 50.0 (43.3 - 56.7) 47.6 (42.5 – 52.7) 50.2 (43.7 - 56.7)
Physical activity 19.3 (14.0 - 24.5) 16.7 (12.9 - 20.5) 13.5 (9.0 - 17.9)
Age ≥ 40 years 43.6 (36.9 - 50.2) 47.6 (42.5 - 52.7) 52.8 (46.3 - 59.3)
Frequent alcohol consumption
23.0 (17.4 - 28.7) 25.0 (20.6 - 29.4) 27.7 (21.9 - 33.5)
Smoker
No 65.1 (58.8 - 71.5) 63.4 (58.5 - 68.4) 62.3(56.0 - 68.6)
Yes 15.1 (10.3 - 19.9) 18.3 (14.3 - 22.2) 19.5 (14.3 - 24.6)
Ex-smoker 19.7 (14.4 - 25.0) 18.3 (14.3 - 22.2) 18.2 (13.2 - 23.2)
* SEL- Socioeconomic level
General % (95%CI)
Males % (95%CI)
Females % (95%CI)
Gross Adjust.* Gross Adjust.* Gross Adjust.*
Caucasians 25.0
(20.5 – 29.4)
23.3 (19.6 – 26.9)
28.7 (21.3 – 36.0)
26.2 (20.7 – 31.7)
22.5 (16.9 – 28.1)
20.5 (15.6 - 25.4)
Mulattos 21.9
(18.7 – 25.0)
23.3 (21.2 – 25.4)
19.9 (15.2 – 24.5)
21.9 (18.6 – 25.1)
23.4 (19.1 – 27.7)
23.8 (20.8 – 26.8)
Blacks 25.1
(20.9 – 29.4)
23.4 (19.9 – 26.9)
18.1 (12.3 – 24.0)
17.5 (12.3 – 22.8)
30.3 (24.3 – 36.2)
27.0 (22.2 – 31.8)
p Tend.† 0.93 0.02 0.05
*Adjusted for age, physical activity in leisure time, smoking status, socioeconomic level and level of schooling. † = Chi-square p value for tendency
Table 2 – Prevalence of metabolic syndrome by skin color and sex. (23.3%) and blacks (23.4%); p = ns (Table 2). However, when analyzed by sex, there was a decrease of 37% in the gross prevalence of MS in white males toward the blacks (p tend. = 0.02). At the adjusted analysis, the prevalence gradient was maintained: 26.2, 95%CI (20,7–31,7) among the whites; 21.9%, 95%CI (18.60–25.1) among the mulattos and 17.5%, 95%CI (12.3–22.8) among the blacks. The trend is inverted among women, for both the gross and adjusted rates (Table 2). The prevalence of MS (adjusted by age, physical activity at leisure time, smoking status, SEL and level of schooling) was higher among black women, 27.0%, 95%CI (22.2–31.8), when compared to white women, 20.5%, 95%CI (15.6–25.4), with an intermediate prevalence among the women that self-reported being mulatto, 23.8%, 95%CI (20.8-26.8). When the data are plotted in a chart, the behavior of the MS prevalence in the skin color strata in the general population, between
men and women, clearly identifies the modification of the sex variable effect on this association (Figure 2).
Table 3 shows the prevalence of factors that constitute the MS. There was a higher prevalence of abdominal obesity, DMms and SAHms among the black women, whereas the white women presented a higher prevalence of low HDL-c. Among men, central obesity (CO), HDL-c < 40mg/dl and hypertriglyceridemia were more prevalent among the Whites, whereas arterial hypertension predominated among Blacks.
Taking the white skin color as reference, the PR of the metabolic syndrome was calculated by skin color (Table 4). Among the men, after adjusted by age, physical activity at leisure time, smoking status, SEL and level of schooling, the black skin color behaved as a protective factor, in a statistically significant fashion, 0.60, 95%CI (0.36-0.97). Among the women, the black skin color behaved as a risk factor, reaching an almost statistical significance level, 1.33, 95%CI (0.94-1.78).
Figure 2 – Prevalence of metabolic syndrome adjusted for Age, physical activity
in leisure time, smoking status, socioeconomic level and level of schooling. 23.3
26.2
20.5 23.3
21.9 23.4
17.5
27 23.8
0 5 10 15 20 25 30
General
Whites Mullatos Blacks
Females Males
0 5 10 15 20 25 30 35 40 45
20 to 29
% MS General
% MS Whites
% MS Mullatos
% MS Blacks
Age range (years)
A
> 50 40 to 49
30 to 39
Table 3 – Distribution of factors that constitute the metabolic syndrome by skin color and sex.
Males Females
Whites n=150 Mulattos n=282
Blacks n=171
Whites n=218
Mulattos n=372
Blacks n=231
WC 40.0
(32.1 - 47.9)
31.9 (26.4 - 37.4)
30.4 (23.4 - 37.4)
32.1 (25.9 - 38.4)
36.0 (31.1 - 40.9)
39.4 (33.0 - 45.7)
FG 12.0
(6.7 – 17.3)
14.2 (10.1 – 18.3)
12.3 (7.3 - 17.2)
12.4 (8.0 – 16.8)
16.1 (12.4 – 19.9)
19.5 (14.3 – 24.6)
SAH 40.0
(32.1 - 47.9)
40.4 (34.7 - 46.2)
45.6 (38.1 - 53.1)
32.1 (25.9 - 38.4)
37.1 (32.2 - 42.0)
46.3 (39.8 - 52.8)
HDL-c ↓ 40.0
(32.1 - 47.9)
30.8 (25.4 - 36.3)
15.2 (9.8 - 20.6)
58.7 (52.1 - 65.3)
48.7 (43.5 - 53.7)
46.7 (40.3 - 53.2)
TG ↑ 37.3
(29.5 - 45.2)
32.6 (27.1 - 38.1)
33.9 (26.7 - 41.1)
26.6 (20.7 - 32.5)
25.3 (20.8 - 29.7)
26.8 (21.1 - 32.6)
WC =waist circumference ≥ 84 cm for females and ≥ 88 cm for males; FG= Fasting glycemia ≥ 100 mg/dl and/or hypoglycemiant drug use for DM; SAH= BP ≥ 130/85mmHg and/or anti-hypertensive drug use; HDL ↓=HDL-c < 40 mg/dl in males and < 50 mg/dl in females; TG ↑= triglycerides ≥ 150 mg/dl.
Whites Mulattos Blacks
Males 1(reference) 0.76 (0.50 – 1.12) 0.60 (0.36 – 0.97)
Females 1(reference) 1.00 (0.71 – 1.36) 1.33 (0.94 – 1.78)
*Adjusted for age, physical activity in leisure time, smoking status, socioeconomic level and level of schooling.
Table 4 – Association between skin color and metabolic syndrome at the multivariate analysis*
Discussion
In the present study, the sex variable confirmed its status as a modifier of the association effect between skin color and MS. When the prevalence of MS is analyzed at the different strata of skin color, there was no statistically significant difference. However, when the association was analyzed separately by sex, it was observed that whereas among men, the highest prevalence was observed in whites and the lowest in blacks, the gradient was inverted among women, with a higher prevalence of MS among blacks (Figure 2).
Ford et al10, in 2001, found a MS prevalence of 21.8% of
the adult population of the USA, with no significant difference between the sexes10. However, when the authors analyzed
the prevalence of MS by gender and ethnic group, they found a higher prevalence among the African-descendants (25.7%) when compared to white women (22.8%), and a lower prevalence among African-American men (16.4%) when compared to white men (24.8%).
The Salvador data are similar to those of the aforementioned authors. Considering Ford’s results and also our results, a lower prevalence of MS occurred among black men (or African descendants) occurred because, in spite of presenting a higher prevalence of SAHms, this ethnic group presented a lower prevalence of abdominal obesity, low HDL-c and hypertriglyceridemia (Table IV). The authors did not describe characteristics such as level of schooling, SEL, dietary habits and physical activity practice in the studied population. Such fact limits the interpretation of the differences in prevalence observed among the ethnic-racial groups studied.
In Brazil, although there was no statistically significant difference between the SM prevalence among “distinct” racial groups, Salaroli and cols., in a population-based study in the city of Vitoria, state of Espirito Santo, southeastern Brazil, found, similar to our study, a higher prevalence of MS among black women, as well as a lower prevalence among black men21.
It has been demonstrated that black men present lower triglyceride and higher HDL-c levels than white men9,22-26,
whereas, among adult women, these differences are lower or nonexistent22,26. The finding of higher levels of HDL
2
-cholesterol subfraction (the more protective fraction of HDL-c) among black children constitutes evidence that can suggest some influence of genetic factors. However, it is mainly considered that the factors related to lifestyle can explain the differences in lipid profiles between blacks and whites at the adult age. Hence, black women, similarly to black men, in childhood and adolescence, present lower triglyceride and higher HDL-c levels than white women27-30,but these
disappear throughout time.
Some authors have demonstrated that central obesity is associated with the onset of alterations in the glycidic metabolism, increase in triglyceride and decrease in HDL-c levels, regardless of ethnicity9,23,24,31. Based on this evidence
References
americans. Ann Epidemiol. 2000; 10 (5): 263-70.
10. Ford ES, Giles WH, Dietz WH. Prevalence of the metabolic syndrome among US adults: findings from the third National Health and Nutrition Examination Survey. JAMA. 2002; 287 (3): 356-9.
11. Meigs JB, Wilson PW, Nathan DM, D’Agostino RB Sr, Williams K, Haffner SM. Prevalence and characteristics of the metabolic syndrome in the San Antonio Heart and Framingham Offspring Studies. Diabetes. 2003; 52 (8): 2160-7.
12. Ford ES, Giles WH. A comparison of the prevalence of the metabolic syndrome using two proposed definitions. Diabetes Care. 2003; 26 (3): 575-81. 13. Ferdinand KC. The cardiometabolic syndrome and cardiovascular disease
in racial and ethnic minorities: new areas of research and intervention. J Cardiometab Syndr. 2007; 2 (4): 235-7.
14. Ajjan R, Carter AM, Somani R, Kain K, Grant PJ. Ethnic differences in cardiovascular risk factors in healthy Caucasian and South Asian individuals with the metabolic syndrome. J Thromb Haemost. 2007; 5 (4): 754-60. 15. Salsberry PJ, Corwin E, Reagan PB. A complex web of risks for metabolic
syndrome: race/ethnicity, economics, and gender. Am J Prev Med. 2007; 33 (2): 114-20.
16. Lessa IML, Araújo MJ, Aquino E, Almeida Filho N. Projeto-monitoramento das doenças crônicas não transmissíveis (MONIT): relatório de pesquisa apresentado ao Centro Nacional de Epidemiologia (CENEPI). Brasília: Fundação Nacional de Saúde (MS); 2000.
17. Instituto Brasileiro de Geografia e Estatística (IBGE). Síntese dos indicadores sociais, 1998. Rio de Janeiro; 1999.
18. Roldan B, San Millan JL, Escobar-Morreale HF. Genetic basis of metabolic abnormalities in polycystic ovary syndrome: implications for therapy. Am J
levels, when compared to white women, than that observed in the male sex31.
Regarding the population of this study, we observed a higher proportion of black women with a low level of schooling that did not practice physical activity in leisure time (Table I). Supposedly, this would explain, in part, the higher prevalence CO and MS in this subgroup. Moreover, a higher proportion of individuals that practice physical activity in leisure time among the black men would help explain the lower prevalence of these conditions among them (Table I). However, the distribution of thee variables does not seem to be enough to explain the higher prevalence of CO and MS among white men.
The low birth weight would be another factor that could help to explain the association between skin color and MS32-34. Thus, malnutrition during intrauterine life seems to
cause metabolic alterations that have as priority the supply of nutrients to the brain to the detriment of the striated musculature and pancreas, resulting in insulin resistance35. In
the present study, we do not have data on birth weight of the analyzed individuals.
The non-inclusion in the present study of the analysis of dietary habits and psychosocial factors of individuals might have resulted in limitations for a better understanding of the association between skin color and MS. Moreover,
considering that the prevalence of MS increases with age and this is a cross-sectional study, the survival bias can influence the finding of differences in the prevalence of MS among whites, mulattos and blacks. Among the men, the proportion of individuals aged ≥ 40 years was very similar in the three groups, and among the women, this proportion tended to be higher among blacks.
Thus, we do not believe that this type of bias can fully explain the different prevalence rates found, but it might have contributed, together with dietary habits and psychosocial factors, to explain the different MS rates among whites, mulattos and blacks, in men and women.
Potential Conflict of Interest
No potential conflict of interest relevant to this article was reported.
Sources of Funding
This study was partially funded by Cnpq.
Study Association
This article is part of the thesis of doctoral submitted by Paulo José Bastos Barbosa, from Instituto de Saúde Coletiva - UFBA.
1. Reaven GM. Banting lecture 1988: role of insulin resistance in human disease. Diabetes. 1988; 37 (12): 1595-607.
2. Alexander CM, Landsman PB, Teutsch SM, Haffner SM. NCEP-definedNCEP-defined metabolic syndrome, diabetes, and prevalence of coronary heart disease among NHANES III participants age 50 years and older. Diabetes. 2003; 52 (5): 1210-4.
3. Lakka HM, Laaksonen DE, Lakka TA, Niskanen LK, Kumpusalo E, Tuomilehto J, et al. The metabolic syndrome and total and cardiovascular disease mortality in middle-aged men. JAMA. 2002; 288 (21):2709-16.JAMA. 2002; 288 (21):2709-16.
4. Laaksonen DE, Lakka HM, Niskanen LK, Kaplan GA, Salonen JT, Lakka TA. Metabolic syndrome and development of diabetes mellitus: application and validation of recently suggested definitions of the metabolic syndrome in a prospective cohort study. Am J Epidemiol. 2002; 156 (11): 1070-7. 5. Pyorala M, Miettinen H, Laakso M, Pyorala K. Hyperinsulinemia predicts
coronary heart disease risk in healthy middle-aged men: the 22-year follow-up results of the Helsinki Policemen Study. Circulation. 1998; 98 (5): 398-404.Circulation. 1998; 98 (5): 398-404. 6. Rewers M, Zaccaro D, D’Agostino R, Haffner S, Saad MF, Selby JV, et al. InsulinInsulin
sensitivity, insulinemia, and coronary artery disease: the Insulin Resistance Atherosclerosis Study. Diabetes Care. 2004; 27 (3): 781-7.
7. Kullo IJ, Cassidy AE, Peyser PA, Turner ST, Sheedy PF 2nd, Bielak LF. Association between metabolic syndrome and subclinical coronary atherosclerosis in asymptomatic adults. Am J Cardiol. 2004; 94 (12): 1554-8.
8. Does diagnosis of the metabolic syndrome detect further men at high risk of cardiovascular death beyond those identified by a conventional cardiovascular risk score? The DECODE Study. Eur J Cardiovasc Prev Rehabil. 2007; 14 (2): 192-9. 9. Okosun IS, Liao Y, Rotimi CN, Prewitt TE, Cooper RS. Abdominal adiposity
Pharmacogenomics. 2004; 4 (2): 93-107.
19. Grundy SM, Cleeman JI, Daniels SR, Donato KA, Eckel RH, Franklin BA, et al. Diagnosis and management of the metabolic syndrome: an American Heart Association/National Heart, Lung, and Blood Institute Scientific Statement. Circulation. 2005; 112 (17): 2735-52.
20. Barbosa PJ, Lessa I, Almeida Filho N, Magalhaes LB, Araujo J. Criteria for central obesity in a Brazilian population: impact on metabolic syndrome. Arq Bras Cardiol. 2006; 87 (4): 407-14.
21. Salaroli LB, Barbosa GC, Mill JG, Molina MC. Prevalence of metabolic syndrome in population-based study, Vitoria, ES-Brazil. Arq Bras Endocrinol Metab. 2007; 51 (7): 1143-52.
22. Chaturvedi N, McKeigue PM, Marmot MG. Relationship of glucose intolerance to coronary risk in Afro-Caribbeans compared with Europeans. Diabetologia. 1994; 37 (8): 765-72.
23. Folsom AR, Burke GL, Ballew C, Jacobs DR Jr, Haskell WL, Donahue RP, et al. Relation of body fatness and its distribution to cardiovascular risk factors in young blacks and whites: the role of insulin. Am J Epidemiol. 1989; 130 (5): 911-24.
24. McKeigue PM, Shah B, Marmot MG. Relation of central obesity and insulin resistance with high diabetes prevalence and cardiovascular risk in South Asians. Lancet. 1991; 337: 382-6.
25. Miller GJ, Kotecha S, Wilkinson WH, Wilkes H, Stirling Y, Sanders TA, et al. Dietary and other characteristics relevant for coronary heart disease in men of Indian, West Indian and European descent in London. Atherosclerosis. 1988; 70 (1-2): 63-72.
26. Slack J, Noble N, Meade TW, North WR. Lipid and lipoprotein concentrations in 1604 men and women in working populations in north-west London. BrBr Med J. 1977; 2: 353-7.
27. Srinivasan SR, Frerichs RR, Webber LS, Berenson GS. Serum lipoproteinSerum lipoprotein profile in children from a biracial community: the Bogalusa Heart Study. Circulation. 1976; 54 (2): 309-18.
28. Morrison JA, deGroot I, Edwards BK, Kelly KA, Mellies MJ, Khoury P, et al. Lipids and lipoproteins in 927 schoolchildren, ages 6 to 17 years. Pediatrics. 1978; 62 (6): 990-5.
29. Berenson GS, Srinivasan SR, Cresanta JL, Foster TA, Webber LS. DynamicDynamic changes of serum lipoproteins in children during adolescence and sexual maturation. Am J Epidemiol. 1981; 113 (2): 157-70.
30. Belcher JD, Ellison RC, Shepard WE, Bigelow C, Webber LS, Wilmore JH, et al. Lipid and lipoprotein distributions in children by ethnic group, gender, and geographic location--preliminary findings of the Child and Adolescent Trial for Cardiovascular Health (CATCH). Prev Med. 1993; 22 (2): 143-53. 31. Srinivasan SR, Wattigney W, Webber LS, Berenson GS. Race and gender
differences in serum lipoproteins of children, adolescents, and young adults--emergence of an adverse lipoprotein pattern in white males: the Bogalusa Heart Study. Prev Med. 1991; 20 (6): 671-84.
32. Haslam DW, James WP. Obesity. Lancet. 2005; 366: 1197-209.
33. Hofman PL, Regan F, Jackson WE, Jefferies C, Knight DB, Robinson EM, et al. Premature birth and later insulin resistance. N Engl J Med. 2004; 351 (21): 2179-86.
34. Yajnik C. Interactions of perturbations in intrauterine growth and growth during childhood on the risk of adult-onset disease. Proc Nutr Soc. 2000; 59 (2): 257-65.