RÔMULO DIAS NOVAES
EFEITOS DA INFECÇÃO EXPERIMENTAL COM Trypanosoma cruzi SOBRE A MORFOLOGIA E FUNÇÃO CARDÍACA E PANCREÁTICA DE RATOS WISTAR
Tese apresentada à Universidade Federal de Viçosa, como parte das exigências do Programa de Pós-Graduação em Biologia Celular e Estrutural, para obtenção do título de Doctor Scientiae.
VIÇOSA
RÔMULO DIAS NOVAES
EFEITOS DA INFECÇÃO EXPERIMENTAL COM Trypanosoma cruzi SOBRE A MORFOLOGIA E FUNÇÃO CARDÍACA E PANCREÁTICA DE RATOS WISTAR
Tese apresentada à Universidade Federal de Viçosa, como parte das exigências do Programa de Pós-Graduação em Biologia Celular e Estrutural, para obtenção do título de Doctor Scientiae.
APROVADA: 17 de setembro de 2012.
______________________________ ______________________________ Ana Cristina Rodrigues Lacerda Cristiane Alves Silva Menezes
______________________________ _______________________________ Leandro Licursi de Oliveira Márcia de Carvalho Vilela
AGRADECIMENTOS
À Universidade Federal de Viçosa e ao Programa de Pós-Graduação em Biologia Celular e Estrutural, pelo apoio em minha formação pessoal e profissional.
À CAPES, pelo apoio financeiro.
À minha orientadora Profª. Izabel Regina dos Santos Costa Maldonado, pelo acolhimento de um recém-chegado à UFV, pelos ensinamentos, confiança, paciência e apoio em questões pessoais e profissionais.
Aos meus Coorientadores Prof. Clóvis Andrade Neves e Prof. Antônio José Natali, pelos ensinamentos, paciência e disposição em ajudar.
Ao Prof. André Talvani Pedrosa, pelo apóio na inoculação dos animais, disposição em ajudar e incentivo para continuar a caminhada.
À Profª. Ana Cristina Rodrigues Lacerda, pela disposição em participar da banca examinadora e por representar um modelo de busca pela integração entre a pesquisa e a prática docente.
À Profª. Cristiane Alves Silva Menezes, pela disposição em participar da banca examinadora.
Ao Prof. Leandro Licursi de Oliveira, pela disposição em participar da banca examinadora, pelos conselhos em pesquisa, e pela solicitude em ajudar e abrir as portas do seu laboratório para a realização de experimentos.
À Profª. Maria do Carmo Gouveia Peluzio por seus conselhos, ótima convivência e pelo apoio nas análises de estresse oxidativo.
Ao Prof. Sérgio Luis Pinto da Matta pela ótima parceria nos trabalhos de pesquisa, sua alegria contagiante, e ensinamentos que levarei por toda a vida pessoal e profissional.
Ao Prof. Clóvis Andrade Neves pelos conselhos pessoais e profissionais, pela confiança no nosso trabalho de equipe e solicitude em ajudar.
Ao Prof. José Eduardo Serrão pelos estímulos constantes para a busca de qualidade de pesquisa, pelo apoio de infraestrutura e financeiro para a utilização dos laboratórios da UFV e realização das análises de microscopia eletrônica.
A todos os professores do Programa de Pós-Graduação em Biologia Celular e Estrutural, por todos os ensinamentos e incentivo.
A todos os funcionários do Programa de Pós-Graduação em Biologia Celular e Estrutural, em especial Beth e Diana, pela ótima convivência, paciência e auxílio em todos os momentos necessários.
Aos amigos do laboratório de Biologia Estrutural: Kener, Marlí, Wagner, Márcia, Edson, Daniel, Maria do Carmo, Marcília, Marcelo, Suzana, Andréa, Rafael, Daiane e Lílian, pela disposição em ajudar, pelas conversas e momentos de descontração, pela companhia na luta do dia-a-dia e pelo incentivo constante.
Aos amigos Carla Veloso Gonçalves Ribeiro e Gilmar Edilberto Valente pelo apoio profissional, disponibilidade em ajudar, confiança no trabalho que realizamos e oportunidade de dividir alguns bons momentos juntos.
Ao companheiro de trabalho e amigo Alex Bhering por iluminar nossos caminhos em meio aos procedimentos e técnicas em histologia, pela paciência, pela companhia e pelos momentos de descontração.
Á amiga de Viçosa Marisa, pelo acolhimento e apoio nas horas de necessidade.
As amigas Arlete e Reggiani pela parceria, momentos de descontração e apoio pessoal e profissional.
Aos amigos do coração que fazem o dia-a-dia mais feliz mesmo que a distância nos separe de alguns: Aline, Ana Izaura, Arlete, Eliziária, Kener e Reggiani.
À minha mãe e meu pai por tudo que fizeram por mim e que me permitiu chegar até aqui.
À Deus, pela minha vida e pela força para superar as dificuldades e continuar a caminhada.
ÍNDICE
RESUMO...vii
ABSTRACT...viii
ARTIGO 1...1
ARTIGO 2...17
ARTIGO 3... 39
RESUMO
NOVAES, Rômulo Dias, D.Sc., Universidade Federal de Viçosa, setembro de 2012. Efeitos da infecção experimental com Trypanosoma cruzi sobre a morfologia e função cardíaca e pancreática de ratos Wistar. Orientadora: Izabel Regina dos Santos Costa Maldonado. Coorientadores: Antônio José Natali e Clóvis Andrade Neves.
ABSTRACT
NOVAES, Rômulo Dias, D.Sc., Universidade Federal de Viçosa, September, 2012. Effects of experimental Trypanosoma cruzi infection on the cardiac and pancreatic morphology and function in Wistar rats. Adviser: Izabel Regina dos Santos Costa Maldonado. Co-advisers: Antônio José Natali and Clóvis Andrade Neves.
Artigo 1
Use of fluorescence in a modified disector method to estimate the
myocytes number in cardiac tissue
Rômulo Dias Novaes,1 Arlete Rita Penitente,1 André Talvani,2 Antônio José Natali,1 Clóvis Andrade Neves,1 Izabel R.S.C. Maldonado,1
1
Federal University of Viçosa, MG, Brazil; 2
Federal University of Ouro Preto, MG, Brazil;
Running title: Fluorescence to estimate cardiomyocytes number
Key-words: cardiomyocytes, fluorescence microscopy, morphology.
Abstract
Study basis: Currently, conventional disector methods require a considerable financial, technical and operational cost to estimate the cells quantity, including cardyomyocytes, in a 3D area.
Objective: to use fluorescence microscopy in a modified disector method to determine myocytes number in cardiac tissue in normal and pathological conditions.
Methods: Were used four-month-old male Wistar rats with weight of 366.25 ± 88.21g
randomized in control (CG, n=8) and infected (IG, n=8) groups. IG animals were inoculated with T. cruzi Y strain (300,000 trypomastigotes/50g wt). After eight weeks, the animals were weighted and euthanized. The left ventricles (LV) were removed for stereological analysis of numerical density of cardiomyocytes (Nv[c]) and total number of these cells in the LV (N[c]). These parameters were estimated using a fluorescent disector (FD) and compared with the conventional optical (OD) and physical (PD) disector methods.
Results: In both disector methods, IG animals presented significant decrease of Nv[c] and N[c] compared to CG animals (P< 0.05). There was no significant difference in these variables despite the disector method applied in CG and IG animals (P> 0.05). A strong correlation, equal or above 96%, was obtained between FD, OD and PD.
Introduction
Over the past years a great effort was made to develop a reliable and reproducible method to estimate the number of particles in organs and tissues, but, until 1984 all these methods had intrinsic bias1-3. In 1984, Sterio described several modifications in the approaches used to estimate the objects quantity in three-dimensional space and introduced the disector method4. Currently, most authors consider the disector method unbiased and the well-established theoretical background makes the method largely acceptable5-7.
The disector may be obtained through two different methods that are based in the same theoretical principles and basic requirements to estimate the particles quantities. These methods are the optical and physical disector4,8-10. Although both the methods have reduced the bias of particle quantity estimation, they still required the acquisition of a large number of histological images and a great deal of time to perform the counts. Particularly, the optical disector also require a light microscope of high cost adapted with axis-Z mobile stage11. Moreover, the physical disector are extremely laborious because require serial histological sections and images with a perfect alignment in the different parallel sections3,10.
Considering that the aim of the sampling design for stereology is to obtain the maximal amount of quantitative structural information at a given total cost, time or effort, the purpose of this study was to use fluorescence microscopy in a modified disector method to determine myocytes number in cardiac tissue on normal and pathological conditions. Thus, a murine model of T. cruzi infection that recognizably conduces to disruption of cardiac myocytes and modifies the number of these cells in the myocardium was used12. We hypothesized that the proposed method may reduce the operational cost observed in the conventional methods as well as maintain the accuracy of the cell quantity measurements.
Materials and methods
Animals and experimental groups
occur increase or decrease of the variables of interest. Thus, considering the significance level α=0.05, the minimal significant number of animals used in statistical analysis was: P=(1/2)events; so, if n=5, P=(1/2)5 or P=0.03; thus, P<0.0510. Due to the intrinsic variability of the parasitism in target organs and the mortality associated with T. cruzi infection a correction factor of 50% was incorporated to the initial calculation, determining samples of 8 animals, randomly allocated into control (CG, n= 8) and infected (IG, n= 8) groups.
Infection
Animals from IG were inoculated intraperitoneally with T. cruzi Y strain (300,000 trypomastigotes/50g body weight in 1 mL of infected mice blood13. Infection was confirmed four days post-inoculation by the presence of trypomastigotes in peripheral blood collected from the rat’s tail as described by Brener14. All experimental procedure were conducted in accordance with the Brazilian College of Animal Experimentation and approved by the Animal Research Ethics Commission of the Veterinary Department at the Federal University of Viçosa, Brazil (protocol number 30/2009).
Biometrical analysis
Eight weeks after inoculation the animals were euthanized under anesthesia and the hearts were removed. The left ventricles (LV) were dissected and weighed separately. The LV volume was obtained by the submersion method, where the liquid displacement from the organ volume is weighed. Due to the specific gravity (σ) of isotonic saline is 1.0048, the volume is obtained by: volume= weight/σ, or simply volume (103 mm3) ≈ weight (g)15. The LV weight and volume was determined including the interventricular septum.
Tissue processing and determination of histological areas
cleared in xylol and embedded in paraffin. Blocks were cut into 3 μm sections and stained by hematoxylin-eosin (H&E) or 4',6-diamidino-2-phenylindole at 0.2% (DAPI)18.
The representative number of disectors used in stereological analysis for each animal was determined considering the stabilization of the coefficient of variation (CV) of myocytes nuclei number in crescents random samples of disectors (5, 10, 15, 20 and 25). Thus, was calculated the arithmetical mean and the respective CV for each sample size. When the increase of disector numbers resulting in no significant difference of CV between 3 consecutive samples, the smallest sample size was considered as the minimal representative19. Using this method, the variation of myocytes nuclei number was stabilized from the sample of 10 disectors.
Optical and physical disector methods
Sections stained with H&E were mounted on histology slides using Entelan® mounting medium (Merk, Darmstadt, Germany) and the images were captured using a light microscope (Olympus BX-60®, Tóquio, Japan) connected to a digital camera (Olympus QColor-3®, Tokyo, Japan). Observation was made with a ×100 planachromatic immersion oil objective (NA= 1.25) to clearly identified cardiomyocyte (cmy) nuclei boundaries16,17.
The number of cardiomyocyte nuclei (cmyn) in a 3-dimensional probe was estimated using the optical (OD) and physical (PD) disector methods3. The disector consists of 2 parallel planes aimed at sampling ‘‘top points’’ of particles in between. Sampling volume was created with 2 parallel sections separated by 3 µm (h) and 2 reference planes both containing a test frame (AT). In both disector methods, a pair of photomicrographs separated by h distance is used to form the two reference planes. In the OD, the parallel photomicrographs are obtained in the same histological area adjusting the focal plane (h= 3 µm) using the micrometrical screw. In the PD, two serial sections are obtained in the microtome (h= 3 µm) and the same histological area is photographed in both sections, supplying two photomicrographs physically separated.
Fluorescent disector method
lamp and a filter for dye excitation at 365 nm and a light emission at 460 nm. Observation was made with the same 100× planachromatic lens previously described. In this method, using the 3 µm (h) sections, the two reference planes required to delimitate the disector are obtained in a unique image and pars of photomicrographs are not required as in the conventional methods. Furthermore, the cmyn presents in all thickness of the section may be observed inside or outside of the focal plane. To avoid repeat cells count, sections were obtained in semi-series, using 1 in every 20 sections. The FD was additionally obtained with a ×40 objective lens only to demonstrate the possibility of applying the method using smaller magnifications.
Estimation of numerical density and total number of cardiomyocytes
The numerical density of cmyn (Nv[c], cmyn per mm3) was determined from 10 random disector pairs for each animal, being defined as Nv[c]= Q-[cmyn] / h×AT ; where Q-represents the number of profiles of cmyn counted in the test area on the disector reference section (‘‘look up’’ plane)3,17. In the FD, the Q- value in the Nv[c] formula was multiplied by a correction factor of 0.5 to avoid overestimation of the measures. The total number of cmyn in the LV (N[c]) was estimated as the product of Nv[c] / LV volume. The counts were performed in an AT= 2670 µm2. All stereological analysis was performed using the software Image Pro-Plus 4.5® (Media Cybernetics, Silver Spring, USA).
Statistical analysis
Results
There was no statistical difference in body mass (CG, 502.17 ± 57.76 g vs. IG, 494.69 ± 87.90 g; P> 0.05) and left ventricle volume (CG, 456.47 ± 26.18 mm3 vs. IG, 487.69 ± 34.89 mm3; P> 0.05) between the groups.
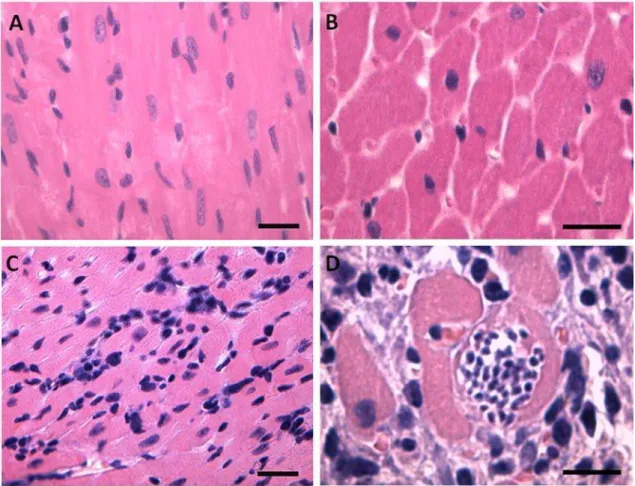
Histopathological analysis of the LV showed a marked diffuse inflammatory infiltrate in IG. Moreover, was observed in this group a disorganization of histological structure with an increased interstitial area and a larger distance between the ventricular myocytes. These cells also showed an increased cross-sectional area and some these presented a narrowing of cytoplasm region induced by a large amount of T. cruzi amastigote forms (Fig. 1).
myocardium structure (magnification ×400, bar = 15µm, H&E stain). In D panel are observed diffuse inflammatory infiltrate with evident increase of the interstitial space and the myocyte diameter. In this panel is observed a large number of amastigote forms of T. cruzi in the myocyte cytoplasm (magnification ×1000, bar = 15µm, H&E stain).
The conventional OD is represented in the fig. 2. In this method, the disector was obtained in the same microscopic image adjusting the Z axis of microscope to create an optical separation of 3 µm between the images. In the physical method (image not show) the disector was obtained using the microscopic images of two different serial histological sections physically separated at the same distance as in the OD (3 µm).
counted because they violate at least 1 of the 3 preceding requirements. (B) The cmyn 1, is in the focus of the ‘‘look-down’’ plane and the cmyn 2 is a shadow outside the focus. If h and AT is known the disector volume is determined. Dividing the number of counted nuclei by this volume, a direct estimate of Nv[c] is obtained (magnification ×1000, bar= 15µm, H&E stain).
The proposed disector method, named fluorescent disector (FD), is represented in the fig. 3. In this method, the disector was obtained in the same microscopic image thought the differential fluorescence emission by the cmyn. While in the OD and PD a total of 160 photomicrographs (80 disector pairs) were required in the stereological analysis, in FD a half of microscopic images (80 individual disectors) were used.
In the FD was incorporated a correction factor of 50% in the formula used to determine Nv[c] in OD and PD. Thus, the formula used to estimate Nv[c] in the FD was Nv[c]= Q-[cmyn] × 0.5 / h×AT; where the constant 0.5 was established to avoid overestimation of cmyn count in FD.
cardiomyocyte nuclei (cmyn). Superficial cmyn (look up plane) appears in the focal plane with more brightness, and cmyn in deep planes (look down plane) is observed outside the focal plane with low bright. The unions of these reference planes at distance h apart with an unbiased counting frame of area (AT) constitute a Fluorescent disector (FD). (A) The cmyn 1, 2 and 3 in the ‘‘look-up’’ plane may be counted and the nuclei 4 and 5 are in look down plane and not may be counted. Fibroblast nuclei are indicated by asterisk (magnification ×1000, bar= 15µm, 6-diamidino-2-phenylindole stain). (B) There are four cmyn into the frame in the ‘‘look-up’’ plane (1, 2, 3 and 4) that may be counted. The cmyn 5, 6 are observed in look down plane and the nucleus 7 hit on forbidden edge of AT. Thus these not may be counted because violate the requirements to count (magnification ×400, bar= 15µm, 6-diamidino-2-phenylindole stain). The same principles to cmyn count described to the conventional disector are used in this method.
The results of Nv[c] and N[c] obtained using the different disector methods are showed in the table 1. In both disector methods, the infected animals presented significant decrease of both variables compared to control animals. There was no significant difference in these variables values despite the disector methods used.
Table 1. Numerical density and absolute number of cardiomyocytes in the left ventricular myocardium from control and infected rats.
OD PD FD
Nv[c] / mm3
Control 175424.64 ± 6135.36 183977.32 ± 9162.78 172429.44 ± 8123.37
Infected 90771.41 ± 3314.30* 95352.20 ± 3144.13* 91141.127 ± 3741.09*
N[c] x 104
Control 7948.51 ± 471.45 8302.75 ± 519.98 8017.90 ± 474.789
×1000). *, denotes statistical difference from CG (P< 0.01), Mann-Whitney U test. There are no statistical differences between the disector methods, Kruskal-Wallis test.
The result of correlation analysis of the Nv[c] and N[c] obtained using the different disector methods is presented in the table 2. A strong, direct and significant correlation was obtained in all correlations between both the methods.
Table 2. Correlations between the results of numerical density and absolute number of left ventricular myocytes obtained using different disector methods in control and infected rats.
Nv[c] / mm3 N[c]
Correlation (r) P value Correlation (r) P value Control
OD x PD 0.98 <0.0001 0.98 <0.0001 OD x FD 0.96 <0.0001 0.97 <0.0001 PD x FD 0.96 <0.0001 0.96 <0.0001 Infected
OD x PD 0.99 <0.0001 0.99 <0.0001 OD x FD 0.97 <0.0001 0.98 <0.0001 PD x FD 0.97 <0.0001 0.97 <0.0001 OD, Optical disector; PD, Physical disector; FD, Fluorescent disector; Nv[c], numerical density of cardiomyocytes; N[c], absolute number of cardiomyocytes. The results are relative to the data obtained using a ×100 objective lens (magnification ×1000). Correlations were tested using the Spearman’s method.
Discussion
semi-quantitative context20. With the refinement these morphological approaches, was incorporated in the histological and pathological analysis the use of a two-dimension (2D) quantitative system to describe the morphometrical characteristics of organs and tissues1,21,22. These refinements introduced significant advances in histo-quantitative studies. However, the estimation of microscopic parameters in a three-dimension (3D) space remained as an issue still not well resolved, and the conventional morphometric methods present intrinsic bias that reduced the reliability of the morphological measurements2,3,23.
Considering the intrinsic bias of several morphometrical measurements, calculations of probability statistics and geometry applied in geology and other soil sciences were adapted to the study of biological materials1,24, forming the basis of actual stereology3. The development of stereology constitutes an important evolution in the histo-quantitative methods, allowing the development of more accurate and reliable morphological data9,10,25,26.
The objects quantity estimation in biological tissue has been a crucial issue in morphological studies and diagnostic pathology, constituting the more refined measures in stereology3,7. The development of disector methods by Sterio in 1984 led to a creative and relatively simple way to estimate the particle number in an organ or tissue4. However, the disector methods still require a series of technical requirements that increase the time and cost of data acquisition5,8,10. The need to obtain and analyze a large number of microscopic images is a common limitation of both OD and PD methods, especially when several groups and tissue samples are studied at once. Moreover, the costs to acquisition or adaptation of a microscope with controlled Z axis contribute to limit the application of OD11. On other hand, obtain a PD is extremely laborious because involve the quality of the microtomy, appropriated processing of serial sections and technical ability to determine a perfect alignment of these sections4. Furthermore, minimal alignment error can lead to a bias in the cell count characterized by an overestimation or underestimation of stereological outcomes. Thus, these conventional disector methods still require a considerable financial, technical and operational cost to estimate the particle quantity in a 3D area11.
N[c] was required in FD. The introduction of a correction factor was necessary to reduce the overestimation of the measurements. In the conventional methods, the particle count results exclude those which hit the forbidden plane (generally look down plane), contributing to reduce the measurement bias27,28. As in the FD the presence or absence of the same particle cannot be observed in both disector planes, as occurs in OD and PD, the calculation of probability determine a 0.5 correction factor to the N[c] formula, considering 50% of chance of a particle is observed or not in both planes.
The application of the FD using the proposed method provided similar results of Nv[c] and N[c] in relation the other disector methods, without significant difference between the methods. Both methods presented sufficient sensibility to determine the reduction of left ventricle myocyte number in the murine model of cardiac infection T. cruzi-induced. This model was selected to the present study because of the well-established tropism to cardiac tissue presented by this parasite and its ability to reduce the number of myocytes due to parasite replication, differentiation and cell evasion, which propagates in an ongoing destructive process12,13. In addition, the correlations between the FD with the conventional methods were strong, indicating that the FD method may be equally reliable to estimate the myocytes number in cardiac tissue. The reliability of the measures seems to be maintained in both health and pathological conditions.
Although the FD also constitute an optical method, the present study demonstrated that the FD also may be obtained using objective lens with lower magnifications (×40) compared with the conventional lens (×100) required in OD. In OD, lower magnifications are not often used because determine a large depth-of-field, fact that difficult the acquisition of different disector focal planes (look up and look down) because it maintains all section structures inside the focus, despite of the Z axis adjust3.
Conclusion
of FD in simple microscopes using the epifluorescence mode, 4) distinction of the disector look up and look down planes using lower magnifications, 5) reliability of stereological results demanding reduced technical and operational cost in relation to the OD and PD methods.
Conflict of interest
There is no conflict of interest.
References
1. Weibel ER, Kistler GS, Scherle WF. Practical stereological methods for morphometric cytology. J Cell Biol. 1966; 30(1):23-38.
2. Aherne WA. Methods of counting discrete tissue components in microscopical sections. J R Micr Soc. 1967; 87(3):493-501.
3. Mandarim-de-Lacerda CA. Stereological tools in biomedical research. An Acad Bras Cienc 2003; 75(4):469-86.
4. Sterio DC. The unbiased estimation of number and sizes of arbitrary particles using the disector. J Microsc. 1984;134(Pt2):127-136.
5. Dorph-Petersen KA, Nyengaard JR, Gundersen HJ. Tissue shrinkage and unbiased stereological estimation of particle number and size. J Microsc. 2001; 204(Pt3):232-246.
6. Charleston LB, Thyer AC, Klein NA, Soules MR, Charleston JS. An improved method for the production of slides from oversized samples of glycol methacrylate-embedded tissues: Application for optical disector based stereology. J Histotechnol 2003; 26(1): 49-52.
8. Gundersen HJ, Bagger P, Bendtsen TF, Evans SM, Korbo L, Marcussen N, et al. The new stereological tools: disector, fractionator, nucleator and point sampled intercepts and their use in pathological research and diagnosis. APMIS. 1988; 96(10):857-881.
9. Weibel ER. Measuring through the microscope: development and evolution of stereological methods. J Microsc. 1989; 155(Pt3):393-403.
10.Cruz-Orive LM, Weibel ER. Recent stereological methods for cell biology: a brief survey. Am J Physiol. 1990; 258(4 Pt1):148-156.
11.Xavier-Vidal R. Disector Z-axis mechanical method for stereology. An Acad Bras Cienc. 2010; 82:539-544.
12.Marin-Neto JA, Cunha-Neto E, Maciel BC, Simões MV. Pathogenesis of chronic Chagas’ heart disease. Circulation 2007; 115(9):1109-1123.
13.Martinelli PM, Camargos ERS, Azevedo AA, Chiari E, Morel G, Machado CRS. Cardiac NGF and GDNF expression during Trypanosoma cruzi infection in rats. Auton Neurosci. 2006; 130(1-2):32-40.
14.Brener Z. Therapeutic activity and criterion of cure on mice experimentally infected with Trypanosoma cruzi. Rev Inst Med Trop São Paulo. 1962; 4:389-396.
15.Scherle W. A simple method for volumetry of organs in quantitative stereology. Mikroskopie. 1970; 26(1):57-63.
16.Xavier-Vidal R, Neves MC, Villar VC, Viana WN, Mandarim-de-Lacerda CA. Estereologia do miocárdio em fetos humanos. Estudo quantitativo das modificações estruturais nos dois últimos trimestres de gestação. Arq Bras Cardiol. 1993; 60(4):221-224.
17.Xavier-Vidal R, Madi K. Comparação entre os miocárdios ventriculares direito e esquerdo durante período fetal humano. Uma avaliação estereológica. Arq Bras Cardiol. 1999; 72(5):581-586.
19.Moro L, Vasconcelos AC, Santos FGA, Alves CM, Nunes JES, Sampaio IBM. Determination of the minimal representative number of microscopical fields to quantify apoptosis in canine lymph nodes. Arq Bras Med Vet Zootec. 2004; 56(3):408-410.
20.Bucher O. Contribution on the method of morphometry. Anat Anz. 1967; 120(1), 39-40.
21.Rohr H. Principles, possibilities of use and limits of morphometry. Acta Histochem. 1976; 16:83-89.
22.Rohr H, Oberholzer M, Barstsch G, Keller M. Morphometry in experimental
pathology: methods, baseline data and applications. Int Rev Exp Pathol. 1976; 15:233-325
23.Elias H, Hyde DM. A guide to practical stereology. 1st ed. NewYork: Karger, 1983.
24.Chalkley HW. Methods for quantitative morphological analysis of tissue. J Natl Cancer Inst. 1943; 4:47-53.
25.Collan Y. Stereology in diagnostic pathology. Pathologica 1997; 89:462-466.
26.Von Bartheld C. Counting particles in tissue sections: choices of methods and
importance of calibrationto minimize biases. Histol Histopathol. 2002; 17(2):639-648.
27.Weibel ER. Stereological Methods: practical methods for biological morphometry. 1st ed. London: Academic Press, 1979.
28.Mouton PR. Principles and practices of unbiased stereology. An introduction for bioscientist. 1st ed. Baltimore: John Hopkins University Press, 2002.
Artigo 2
Trypanosoma cruzi infection alters glucose metabolism at rest and during
exercise without modifying the morphology of pancreatic islets in rats
Rômulo D. Novaesa, Reggiani V. Gonçalvesb, Arlete R. Penitentea, André Talvanic, Maria C.G. Peluziod, Clóvis A. Nevesa, Antônio J. Natalie, and Izabel R.S.C.
Maldonadoa
a
Department of General Biology, Federal University of Viçosa, Viçosa, MG, Brazil
b
Department of Morphology, Federal University of Pelotas, Pelotas, RS, Brazil
c
Department of Biological Sciences and NUPEB, Federal University of Ouro Preto, Ouro
Preto, MG, Brazil
d
Department of Nutrition and Health, Federal University of Viçosa, MG, Brazil
e
Department of Physical Education, Federal University of Viçosa, Viçosa, MG, Brazil
Correspondence: Izabel R.S.C Maldonado, Federal University of Viçosa, Department of
Physical Education. Av. Peter Henry Rolfs, s/nº, Zip code: 35.570-000. Viçosa-MG, Brasil.
Abstract
This study investigated the effects of Trypanosoma cruzi infection on pancreatic morphology and glucose metabolism at rest and during exercise. Wistar rats were randomized into control (CG=10) and infected (IG=10) groups. The IG animals were inoculated with Trypanosoma cruzi Y strain (300,000 trypomastigotes/50 g). After 9 weeks the animals were subjected to glucose (OGTT) and insulin (ITT) tolerance tests and a treadmill running protocol. Blood glucose, lactate and time to fatigue were determined. After euthanasia, the pancreases were removed for morphological and biochemical analyses. The IG presented abnormal glucose kinetics in OGTT and a similar glucose curve in ITT compared to the CG. During the exercise test the IG showed anticipation of time to fatigue. At the point of fatigue no difference was found in blood glucose and lactate between the groups. There was significant correlation between lactate levels and the time to fatigue. The IG presented marked pancreatic inflammation, fibrosis and protein oxidation. The number of β cells in the IG animals was not reduced. Trypanosoma cruzi infection impaired pancreas morphology and glucose metabolism at rest and during exercise in rats, which could constitute an additional mechanism in the induction of exercise intolerance in Chagas’ disease.
Introduction
Chagas’ disease (ChD) is a neglected illness caused by the intracellular protozoan parasite Trypanosoma cruzi (T. cruzi), which remains as an important health problem in 18 developing countries in South and Central America [4,28]. Its main clinical manifestations are cardiac and/or digestive disturbances, with a prevalence of about 12-14 million cases worldwide [28].
Although there is sufficient evidence showing that T. cruzi is able to spread and infect several organs such as the gonads, kidney, liver and pancreas in humans [30,32] and animals [7,33,34], these infection sites have not been researched to the same extent as cardiac and intestinal manifestations, and thus remain neglected. Some studies addressed the involvement of the pancreas in ChD [7,30,32-34]. Traditionally, this observation has been based on evidence of altered glucose and insulin responses after oral glucose tolerance tests in chronic chagasic patients and post-mortem histopathological analyses of the pancreas [18,35,37]. Although the direct pathological and functional repercussions of T. cruzi on the heart and gut are the primary focus of investigations and interventions in ChD [4,28], it is evident that pancreatic infections also present an important clinical significance in this disease [26,35]. This importance is clear according to the concept of the enteroinsular axis, considering the interrelationships of pancreatic secretions and the intestinal tube in several peptidergic routes that participate in the metabolism of energy substrates [8]. In fact, it has been shown that patients with the digestive form of chronic Chagas’ disease frequently present variable degrees of pancreatic morphological changes and glucose metabolism dysfunctions [18,26]. In addition, previous studies suggested that chagasic individuals present permanently elevated blood glucose levels and a high predisposition toward the development of type 2 diabetes mellitus (DM2) compared to healthy subjects [18,26,35].
animal models have been carried out to investigate blood glucose levels during exercise in T. cruzi infection. Thus, the present study was designed to investigate the effects of T. cruzi infection on pancreatic morphology and glucose metabolism at rest and during exercise and the relationship between these variables and exercise tolerance. We hypothesized that the dysfunction in glucose metabolism might be an additional component involved in reduced exercise tolerance in rats.
Materials and Methods
Animals and infection
Twenty 4-month-old male Wistar rats (Rattus norvegicus) with an initial weight of 366.25 ± 31.17 g were used in the experiments and were provided with a rodent diet (AIN-93M) [29] and water ad libitum. The animals were divided into an uninfected control group (CG, n=10) and an infected group (IG, n=10) and maintained under a controlled environment with a temperature of 22 ± 2 ºC and 12-h light/dark cycles. The rats of the IG were inoculated intraperitoneally with 1 mL of infected mice blood containing the T. cruzi Y strain (300,000 trypomastigotes/50 g body weight), according to the method of Martinelli et al. [22]. Infection was confirmed by the presence of trypomastigotes in peripheral blood aliquots collected 4 days after inoculation [3]. All animals were euthanized 9 weeks after inoculation by cervical dislocation while under anesthesia. The experimental protocols were conducted in accordance with the Brazilian College for Animal Experimentation and were approved by the Animal Research Ethics Committee from the Federal University of Viçosa, Brazil (protocol 30/2009).
Body mass and underweight
Pancreatic function and insulin tolerance
The oral glucose tolerance test (OGTT) was used to investigate pancreatic function through the insulin response induced by a glycemic load. Prior to the OGTT all rats were fasted for 16 h, although water was not restricted. Then, anhydrous glucose was orally administered to the animals (3 g/kg of body weight) diluted in 3 mL distilled water (w/v) with a feeding syringe. Blood samples were collected by tail vein puncture at 0 (fasting glucose), 30, 60, 90 and 120 min after the glucose load to determine blood glucose via the glucose oxidase method (OneTouch Ultra®, Jonson & Jonson, CA, USA). The area under the blood glucose response curve (AUC) was calculated for each animal using the trapezoidal method [27].
Forty-eight hours after OGTT, the insulin tolerance test (ITT) was performed to investigate the peripheral tolerance to insulin. Before the ITT the animals were fasted for 2 h to eliminate any differences in stomach contents or plasma insulin between the rats. The rats were injected subcutaneously at the back of the neck with 0.5 units/kg insulin (Biochemica, Florida, USA) and the blood glucose was measured at the same times described for the OGTT (0, 30, 60, 90 and 120 min) using the same glucose oxidase method. The ratio of the glucose decay constant (KITT) was calculated using the formula 0.693/(T1/2), where the T1/2 of plasma glucose was determined from the glucose curve during its phase of linear decay (0-30 min) [9].
Exercise test protocol and metabolic parameters
Basel, Switzerland) and glucose oxidase (OneTouch Ultra®, Jonson & Jonson, CA, USA), respectively. The distance traveled (m) and time to fatigue (min) were also recorded.
Protein oxidation, fibrosis
The protein carbonyl content was measured using the 2,4-dinitrophenylhydrazine (DNPH) procedure [38]. Total protein levels in the lung tissue were measured using the Bradford method [2].
For each group, 20 sections of 8-µm thickness stained with Sirius red and Fast green were used to quantify the amount of collagen and total protein in pancreatic tissue using a
previously described spectrophotometric method [19]. In this method, the maximal absorbance of Sirius red (540 nm) and Fast green (605 nm) dyes corresponds to the amount
of collagen and non-collagen proteins, respectively.
Histological processing, histochemistry and immunohistochemistry
Histopathology, stereology and karyometry
The inflammatory process was evaluated by determining the relationship between the total number of polymorphonuclear (PMN) and mononuclear (MN) cells observed in the pancreas of control and infected animals [5]. These cells were evaluated in a test area of 3.4×103 µm2 at a magnification of ×1000 across five random, non-coincident microscopic fields for each animal and a total of 170×103 µm2 of pancreas tissue for each group [12]. All morphological analyses were performed using the image analysis software Image Pro-Plus 4.5® (Media Cybernetcs, Silver Spring, MD, USA).
The stereological parameters analyzed were: (A) the volume density (Vv) of the islets in pancreatic tissue (Vvi) and β cells per islet (Vvc); (B) the number of β cells per islet area (NAC) and islet volume (NVC); and (C) the islet volume (Vi). The point-counting method was used to estimate the parameters of item A using the formula Vv [structure] = PP [structure] / PT; where PP is the number of points that hit the structure and PT is the total number of test points [21]. For this analysis, Vvi was estimated using a test system of 200 points in a standard test area of 73×103 µm2 across five random, non-coincident microscopic fields for each animal and a total of 3.6×106 µm2 of pancreas tissue for each group. The relationship between the number of points of the test system that hit the islet profile and those that specifically hit β cells was used to calculated Vvc. A total of 100 islet profiles of the pancreas were examined in order to estimate items B and C. The Vvi was investigated under a magnification of ×40 and the other parameters were determined under a magnification of ×400.
NVC by the islet volume. The islet volume (Vi) was calculated using Cavalieri’s principle: Vi = Σ t × Σ Ai [21].
Sections stained with aldehyde-fuchsin were used for the karyometric study of β-cell nuclei. In the karyometric analysis 50 β cell nuclei for each animal were analyzed under a magnification of ×400. Using a calibrated linear scale the longest axis (D) and shortest axis (d) of the β cells were measured. The geometric axis of the nucleus (Dn) was calculated using the equation Dn = (D × d)1/2. This parameter was used to calculate the nuclear volume from the formula V = π/6 × Dn [31].
In liver sections stained with the carmine method, the volume density of glycogen cytoplasmic inclusions in the histological area (Vv[glyc], %) was estimated according a stereological protocol previously described [25].
Statistical analysis
The data are presented as the mean ± standard deviation (mean ± SD). Normal distribution of the data was verified using the Kolmogorov-Smirnov test. The blood glucose, lactate, protein carbonyl levels and index of inflammatory processes were compared using the Student’s t-test. Stereological and karyometric data were compared using the Mann-Whitney U test. The relationship between blood glucose, lactate and total time to fatigue was assessed by linear regression. A probability of p<0.05 was considered statistically significant.
Results
Body mass, underweight and liver glycogen
Fig. 1. Representative photomicrographs of the liver from uninfected rats (a, n=10) and
rats infected with Trypanosoma cruzi (b, n=10). Glycogen cytoplasmic inclusions are indicated by the arrowhead (best carmine method for glycogen; bar = 70µm). Observe the similar glycogen distribution in uninfected and infected animals.
Pancreatic functioning and insulin tolerance
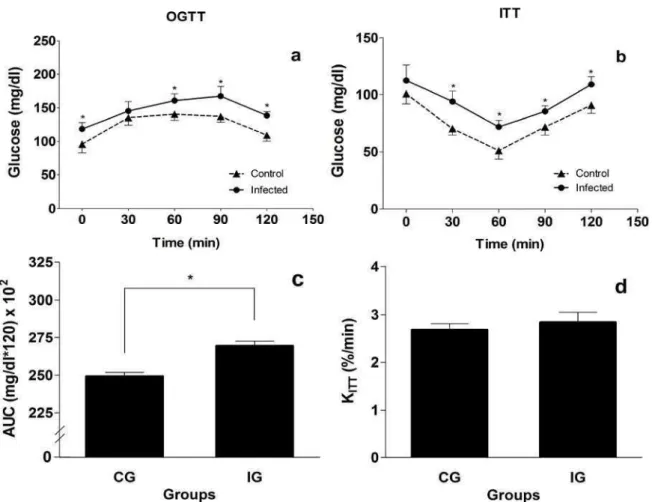
Animals of the IG presented fasted glucose levels that were significantly higher than the CG animals (p<0.05). In the OGTT, the IG animals showed high levels of blood glucose at all testing times and abnormal glucose kinetics compared to the CG. For the IG animals, the increase in blood glucose was prolonged and the glucose decay was delayed, only occurring after 90 min (Fig. 2a). The area under the glucose curve was significantly higher in the IG compared to the CG (Fig. 2c).
Fig. 2. Blood glucose response after the oral glucose tolerance test (OGTT) and insulin tolerance test (ITT) of rats from control (CG, n=10) and infected (IG, n=10) groups. In the OGTT the area under the glucose curve (AUC) was calculated and in the ITT the glucose decay rate (KITT) was determined. The data are expressed as mean ± SD. The statistical difference between groups was *p < 0.001.
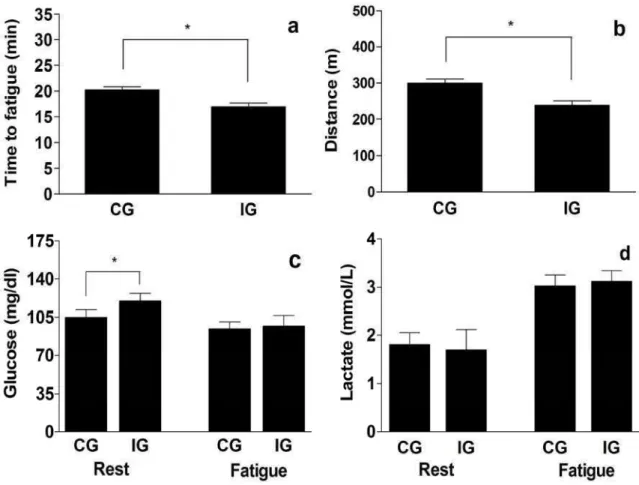
Exercise test protocol and metabolic parameters
correlation was found between the blood levels of lactate and glucose at the point of fatigue and between lactate and total time to fatigue during the exercise test (Fig. 4a-d) in both groups.
Fig. 4. Correlation between temporal and metabolic parameters of running capacity until the point of fatigue in rats from the control (CG, n=10) and infected (IG, n=10) groups. The correlation data are representative of rats from the control (A and C) and infected (B and D) groups. All correlations were statistically significant (p < 0.05).
Histopathological analysis
and disorganization of the exocrine pancreas and minor inflammatory infiltrates in the pancreatic islets (asterisk) (H&E staining, bar = 100 µm). (h) Vacuolization and hypochromia of acinar cells (H&E staining, bar = 25 µm). (I) Detailed cell vacuolization, suggesting the occurrence of apoptosis (H&E staining, bar = 15 µm).
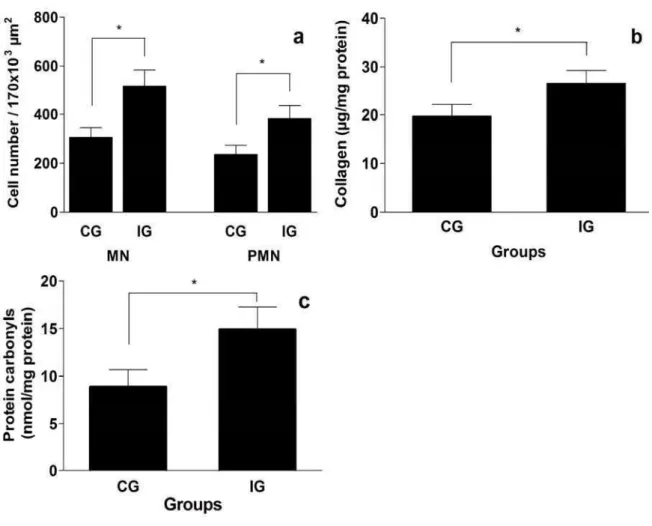
The number of both MN and PMN cells was significantly higher in IG compared to CG (p < 0.05) (Figure 6a). The IG animals also showed significantly higher collagen and protein carbonyl contents compared to CG animals (p < 0.05) (Figure 6b and c).
Stereology and karyometry
The quantitative morphological parameters are shown in Table 1. No significant differences were found between the groups for all relative and absolute parameters estimated in the stereological analysis. The karyometric variables were significantly reduced in IG animals compared to CG animals (p < 0.05).
Table 1. Stereology of the pancreatic tissue and Karyometry of β cell nuclei in rats from control (CG, n=10) and infected (IG, n=10) groups.
Parameters Control group Infected group
Vv [islet] (%) 2.920 ± 1.451 2.760 ± 1.370
Vi [µm3] 2022648.264 ± 641182.222 1727643.212 ± 759538.311 Vv [β cell] (%) 64.690 ± 10.950 60.480 ± 9.300 NAC [β cells/µm2] 0.010 ± 0.005 0.008 ± 0.003 NVC [β cells/µm3] 0.043 ± 0.014 0.034 ± 0.010 N [β cell/islet] 69250.763 ± 28165.934 73145.215 ± 36424.107
Nuclei axis (µm) 7.130 ± 0.530 6.460 ± 0.630*
Nuclei area (µm2) 12.770 ± 1.930 10.520 ± 1.990* Nuclei volume - (µm3) 192.650 ± 44.480 144.790 ± 39.820*
Vv, volume density; NAC, number density per islet area; NVC, number density per islet volume; Vi, islet volume. Data are expressed as mean ± S.D. Statistical difference between groups (*p < 0.001).
Discussion
induce infection, which was confirmed in all of the IG animals. Our results showed that the inoculum and the consequential T. cruzi infection were sufficient to induce a marked dysfunction in glucose kinetics at rest and during exercise and a reduction in exercise tolerance in the IG animals. Interestingly, such alterations occurred in the presence of marked morphological changes in the exocrine pancreas and minimal changes in the endocrine pancreas.
Changes in glucose metabolism in ChD have been reported in human [18,26,35] and animal model of T. cruzi infection [34]. Evidence has been found showing that the modifications in body composition are able to alter the insulin response and consequently glucose kinetics [9]. Due to the systemic characteristics of ChD the occurrence of anorexia and weight loss are not unusual [36], which are events that can affect the levels of blood glucose in OGTT and ITT and during exercise. After 9 weeks of infection no significant difference was found in body mass, Lee index, or the volume density of glycogen inclusions in the liver tissue between IG and CG animals, a finding that reduced the influence of body mass and changes in the glycogen stores on the results obtained.
Since the same glucose curves were found in the ITT for both the IG and CG animals, a dysfunction in glucose kinetics does not seem to be related to the peripheral insulin resistance in T. cruzi infection, a finding that was reinforced by the similar glucose decay rates (KITT) found in both groups. Insulin resistance cannot be disregarded in the pathogenesis of glucose metabolism dysfunctions in ChD; however, it has been reported that insulin resistance appears to be mainly related to the comorbidities associated with ChD, such as obesity and diabetes mellitus [18,35].
[13,41,42]. However, whether or not these molecular changes are associated with dysfunctions in glucose and lactate metabolism due to T. cruzi infection warrants further investigation.
Although no statistical differences were found between the blood glucose and lactate levels at the end of the exercise test, reductions in time to fatigue and the distance traveled during the exercise test were found. In addition, the blood glucose and lactate levels showed an inverse and significant correlation at the end of the exercise test, similar to those observed between lactate and total time to fatigue. These findings suggest that the IG animals presented a higher energetic expenditure and a more active anaerobic metabolism compared to the CG. A lower energetic efficiency due to the increased anaerobic metabolism of glucose is proposed as a mechanism for partially explaining the exercise intolerance in T. cruzi infection. This mechanism is not unrealistic considering the possible negative influence of the infection in the electron transport chain and hence in the aerobic process of energy production [13,41,42]. In this context, a previous study showed that chagasic patients had increased levels of anaerobic metabolism that were associated with vascular dysfunction, reduced levels of VO2 max, lactate dehydrogenase, citrate synthase and, consequently, exercise tolerance [23]. Thus, a more glycolytic and less oxidative glucose metabolism is consistent with an increased production of lactate and with the anticipation of fatigue point during a progressive exercise protocol, as used in the present study. However, there is sufficient evidence that the determination of exercise tolerance is multifactorial. Thus, as T. cruzi is able to parasitize and damage structures such as peripheral nerves and skeletal muscles, equally important elements in determining the exercise tolerance [16,17,23,40], we cannot attribute the results exclusively to the metabolic changes. In this context, the weak correlation between glucose and lactate levels and time to fatigue indicates that other organs and tissues should be investigated to improve the knowledge about the pathophysiological mechanism related to exercise intolerance in Chagas’ disease.
fibrosis and microvascular damage, and parasympathetic denervation of pancreatic islets with the predominance of sympathetic stimuli [7,26,34,35]. Similar mechanisms have been described in other severe protozoan infections, such as malaria [6,34]. Some studies reported that hypoinsulinemia caused by the direct disruption of β cells by T. cruzi may be an important mechanism involved in the dysfunction of glucose metabolism, especially hyperglycemia [18,34]. This mechanism was not supported in the present study because of the number of β cells in the pancreatic islets of IG animals compared to CG animals was not reduced. However, possible functional changes rather than structural defect in insulin-producing cells cannot be excluded. Thus, it is possible that the occurrence of hypoinsulinemia in T. cruzi infection was due to a reduction in the glucose-induced release of insulin by β cells and a failure in the counter-regulation of hypoglycemia dependent on parasympathetic stimuli [18,26,34]. Furthermore, due to the high content of protein carbonyl in pancreatic tissue, we cannot rule out the possibility of an endocrine pancreatic dysfunction secondary to oxidative inhibition of receptors or other proteins that participate in cell signaling pathways. Although this mechanism is possible, it must still be proven. In fact, as an abnormal glucose curve in the OGTT was observed in the present study, it is possible that functional changes in β cells could be directly linked to a dysfunction in glucose metabolism at rest rather than peripheral insulin resistance. As the levels of insulin were not investigated these functional changes cannot be determined, which was the main limitation of the present study.
indicate the need to extend investigations to other organs, suggesting that the pancreas may not be exclusively involved in the metabolic abnormalities observed in T. cruzi infection.
Acknowledgments
Research supported by FAPEMIG (PRONEX). Rômulo D. Novaes was recipient of Ph.D. scholarship from CAPES.
References
1. L.L. Bernardis, B.D. Petterson, Correlation between “Lee index” and carcass fat content in weanling and adult female rats with hypothalamic lesions. J. Endocrinol. 40 (1968) 527-528.
2. M. Bradford, A rapid and sensitive method for quantitation of microgram quantities of protein utilizing the principle of protein-dye-binding. Anal. Biochem. 72 (1976)
248-254.
3. Z. Brener, Therapeutic activity and criterion of cure on mice experimentally infected with Trypanosoma cruzi. Rev. Inst. Med. Trop. São Paulo 4 (1962) 389-396.
4. A. Biolo, A.L. Ribeiro, N. Clausell, Chagas cardiomyopathy-where do we stand after a hundred years? Prog. Cardiovasc. Dis. 52 (2010) 300-316.
5. I.S. Caldas, A. Talvani, S. Caldas, C.M. Carneiro, M. Lana, P.M.M. Guedes, M.T. Bahia, Benznidazole therapy during acute phase of Chagas disease reduces parasite load but does not prevent chronic cardiac lesions. Parasitol. Res. 103 (2008) 413-421. 6. I.A. Clark, F.M. Al Yaman, L.S. Jacobson, The biological basis of malarial disease.
Int. J. Parasitol. 27 (1997) 1237-1249
7. C.E.P. Corbett, L.H.G. Scremin, R.A. Lombardi, J.J. Gama-Rodrigues, M. Okumura, Pancreatic lesions in acute experimental chagas’ disease. Rev. Hosp. Clín. Fac. Med. São Paulo 57 (2002) 63-66.
8. W. Creutzfeldt, R. Ebert, M. Nauck, F. Stöckmann, Disturbances of the entero-insular axis. Scand. J. Gastroenterol. 82 (1983) 111-119.
10.L.Jr. Gallo, J.A. Neto, J.C. Manco, A. Rassi, D.S. Amorim, Abnormal heart rate responses during exercise in patients with Chagas’ disease. Cardiology 60 (1975) 147-62.
11.G. Gomori, Aldehyde fuchsin: A new stain for elastic tissue. Am. J. Clin. Pathol. 20 (1950) 665-666.
12.H.J. Gundersen, T.F. Bendtsen, L. Korbo, N. Marcussen, A. Moller, K. Nielsen, J.R. Nyengaard, B. Pakkenberg, F.B. Sorensen, A. Verterby, Some new, simple and efficient stereological methods and their use in pathological research and diagnosis. APMIS 96 (1988) 379-394.
13.S. Gupta, J. Wen, N.J. Garg, Oxidative stress in Chagas disease. Interdiscip. Perspect. Infect. Dis. ID190354 (2009) 1-8.
14.L.G. Koch, S.L. Britton, Artificial selection for intrinsic aerobic endurance running capacity in rats. Physiol. Genomics 5 (2001) 45-52.
15.A.C. Lacerda, U. Marubayashi, C.H. Balthazar, C.C. Coimbra, Evidence that brain nitric oxide inhibition increases metabolic cost of exercise, reducing running performance in rats. Neurosci. Lett. 393 (2006) 260-263.
16.M.M.O. Lima, M.C. Pereira, M.O.C. Rocha, F.R. Beloti, M.C.N. Alencar, A.L.P. Ribeiro, Left ventricular diastolic function and exercise capacity in patients with Chagas cardiomyopathy. Echocardiography 27 (2010a) 519-524.
17.M.M.O. Lima, M.O.C. Rocha, M.C.P. Nunes, L. Sousa, H.S. Costa, M.C.N. Alencar, R.R. Britto, A.L.P. Ribeiro, A randomized trial of the effects of exercise training in Chagas cardiomyopathy. Eur. J. Heart Fail. 12 (2010b) 866-873.
18.R.G. Long, R.H. Albuquerque, A. Prata, A.J. Barnes, T.E. Adrian, N.D. Christofides, S.R. Bloom, Response of plasma pancreatic and gastrointestinal hormones and growth hormone to oral and intravenous glucose and insulin hypoglycaemia in Chagas’s disease. Gut 21 (1980) 772-777.
19.A. López-De León, M. Rojkind, A simple micromethod for collagen and total protein determination in formalin-fixed paraffin-embedded sections. Histochem. Cytochem.
33 (1985) 737-743.
21.C.A. Mandarim-de-Lacerda, Stereological tools in biomedical research. An. Acad. Bras. Ciênc. 75 (2003) 469-486.
22.P.M. Martinelli, E.R.S. Camargos, A.A. Azevedo, E. Chiari, G. Morel, C.R.S. Machado, Cardiac NGF and GDNF expression during Trypanosoma cruzi infection in rats. Auton. Neurosci. 130 (2006) 32-40.
23.M. Montes de Oca, S.H. Torres, J.G. Loyo, F. Vazquez, N. Hernández, B. Anchustegui, J.J. Puigbó, Exercise performance and skeletal muscles in patients with advanced Chagas disease. Chest 125 (2004) 1306-1314.
24.S.A. Morris, H.B. Tanowitz, M. Wittner, J.P. Bilezikian, Pathophysiological insights into the cardiomyopathy of Chagas' disease. Circulation 82 (1990)1900-1909.
25.R.D. Novaes, R.V. Gonçalves, D.C. Marques, M.C. Cupertino, M.C. Peluzio, J.P. Leite, I.R. Maldonado, Effect of bark extract of Bathysa cuspidata on hepatic oxidative damage and blood glucose kinetics in rats exposed to paraquat. Toxicol. Pathol. 40 (2012) 62-70.
26.L.C.M. Oliveira, Y. Juliano, N.F. Novo, M.M. Neves, Blood glucose and insulin response to intravenous glucose by patients with chronic Chagas’ disease and alcoholism. Braz. J. Med. Biol. Res. 26 (1993) 1187-1190.
27.P. Pushparaj, C.H. Tan, B.K.H. Tan, Effects of Averrhoa bilimbi leaf extract on blood glucose and lipids in streptozotocin-diabetic rats. J. Ethnopharmacol. 72 (2000) 69-76. 28.A. Rassi-Jr, A. Rassi, J.A. Marin-Neto, Chagas disease. Lancet 375 (2010) 1388-1402. 29. P.G. Reeves, F.H. Nielsen, G.C. Fahey Jr, AIN-93 purified diets for laboratory
rodents: final report of the American Institute of Nutrition ad hoc writing committee
on the reformulation of the AIN-76A rodent diet. J. Nutr. 123 (1993) 1939-1951.
30.A. Rocha, L.C. de Oliveira, R.S. Alves, E.R. Lopes, Pancreatic neuronal loss in chronic Chagas’ disease patients. Rev. Soc. Bras. Med. Trop. 31 (1998) 43-49.
31.M.A. Sala, M.C. Komesu, R.A. Lopes, C.G. Maia, Karyometric study of basal cell carcinoma. Braz. Dent. J. 5 (1994) 11-4.
32.J.C. Saldanha, V.M. Santos, M.A. Reis, D.F. Cunha, V.P.A. Teixeira, Morphologic and morphometric evaluation of pancreatic islets in chronic Chagas’ disease. Rev. Hosp. Clin. Fac. Med. São Paulo 56 (2001) 131-138.
34.V.M. Santos, M.A. Lima, M. Cabrine-Santos, D.S. Marquez, G.A. Pereira, E. Lages-Silva, L.E. Ramírez, Functional and histopathological study of the pancreas in hamsters (Mesocricetus auratus) infected and reinfected with Trypanosoma cruzi. Parasitol. Res. 94 (2004) 125-133.
35.V.M. Santos, S.F.C. Cunha, V.P. Teixeira, J.P. Monteiro, J.A. Santos, T.A. Santos, L.A. Santos, D.F. Cunha, Frequency of diabetes mellitus and hyperglycemia in chagasic and non chagasic women. Rev. Soc. Bras. Med. Trop. 32 (1999) 489-496. 36.C. Schebeleski-Soares, R.C. Occhi, S.M. Franzói-de-Moraes, M.M.D. Oliveira, F.N.
Almeida, M.J.O. Toledo, S.M. Araújo, Preinfection aerobic treadmill training improves resistance against Trypanosoma cruzi infection in mice. Appl. Physiol. Nutr. Metab. 34 (2009) 1-8.
37.W.M. Sherman, Metabolism of sugars and physical performance. Am. J. Clin. Nutr. 62 (1995) 228S-241S.
38.R.S. Sohal, S. Agarwal, A. Dubey, W.C. Orr, Protein oxidative damage is associated with life expectancy of houseflies. Proc. Natl. Acad. Sci. 90 (1993) 7255-7259.
39.L.A. Sternberger, The unlabelled antibody peroxidase antiperoxidase (PAP) method, In: S. Cohen, R.T. McClusky (Eds.), Immunocytochemistry, second ed., John Wiley and Sons, New York, (1979), pp. 104-169.
40.L. Sousa, F.A. Botoni, R.R. Britto, M.O.C. Rocha, A.L. Teixeira-Jr, M.M. Teixeira, A.M. Reis, B.M.R. Oliveira, A.L. Ribeiro, Six-minute walk test in Chagas cardiomyopathy. Int. J. Cardiol. 125 (2008) 139-141.
41.J. Wen, M. Dhiman, E.B. Whorton, N.J. Garg, Tissue-specific oxidative imbalance and mitochondrial dysfunction during Trypanosoma cruzi infection in mice. Microbes Infect. 10 (2008) 1201-1209.
Artigo 3
Trypanosoma cruzi infection induces morphological reorganization of the
myocardium parenchyma and stroma and modifies the mechanical
properties of atrial and ventricular cardiomyocytes in rats
Rômulo D. Novaesa, Arlete R. Penitentea, Reggiani V. Gonçalvesb, André Talvanic, Maria C.G. Peluziod, Clóvis A. Nevesa, Antônio J. Natalie, and Izabel R.S.C.
Maldonadoa
a
Department of General Biology, Federal University of Viçosa, Viçosa, MG, Brazil
b
Department of Morphology, Federal University of Pelotas, Pelotas, RS, Brazil
c
Department of Biological Sciences and NUPEB, Federal University of Ouro Preto, Ouro
Preto, MG, Brazil
d
Department of Nutrition and Health, Federal University of Viçosa, MG, Brazil
e
Department of Physical Education, Federal University of Viçosa, Viçosa, MG, Brazil
Correspondence: Izabel R.S.C Maldonado, Federal University of Viçosa, Department of
Physical Education. Av. Peter Henry Rolfs, s/nº, Zip code: 35.570-000. Viçosa-MG, Brasil.
Abstract
This study investigates morphofunctional adaptations of the heart stroma and parenchyma in rats that are chronically infected with Trypanosoma cruzi. Four-month-old male Wistar rats were randomized into control (n= 14) and infected (n= 14) groups. Infected animals were inoculated with T. cruzi Y strain. After nine weeks the animals were euthanized and the right atrium (RA) and left ventricle (LV) were removed for biochemical, stereological and cardiomyocyte mechanical analyses. Infected animals presented cardiomyocyte atrophy, cytoplasmic fragmentation, myocardial fibrosis and necrosis. For these animals, the total volume, length, surface area and cross-sectional area of cardiomyocytes were significantly reduced and the total interstitial and collagen volumes were significantly increased in the RA and LV compared to the controls. The total volume and length of blood vessels were significantly increased in the LV, and the total blood vessel surface area was significantly higher in the RA of infected animals. RA and LV cardiomyocytes from infected animals exhibited a significant reduction in cell shortening (43.02% and 24.98%, respectively), prolongation of the time to the peak of contraction (17.09%) and the time to half relaxation (23.68%) compared to non-infected animals. Lipid hydroperoxides, but not mineral concentrations, were significantly increased in the RA and LV from infected animals, showing an inverse correlation with cell shortening. T. cruzi infection induces global structural remodeling of the RA and LV in rats. This remodeling coexists with cardiomyocyte contractility dysfunction, which is possibly related to the abnormal organization of the myocardial stroma and increased cellular lipid peroxidation.
Introduction
Chagas’ disease (American Trypanosomiasis) is caused by the hemoflagellate protozoan parasite Trypanosoma cruzi. This parasite infects nearly 10 million people worldwide and remains a leading cause of chronic heart failure in Central and South America (Santos et al. 2012) despite dramatic progress in transmission control (Lima et al. 2010a). Thousands of patients die every year, mainly due to dilated cardiomyopathy, congestive heart failure, dysrhythmias and thromboembolic events that occur in approximately 30% of infected subjects (Marin-Neto et al. 2007; Rassi-Jr et al. 2010). Owing to population migration, Chagas’ disease also has the potential to become a health problem in non-endemic countries (Guerri-Guttemberg et al. 2008; Lima et al. 2010a).
Although there is evidence that T. cruzi is able to spread and infect several organs, such as the gonads, kidney, liver and pancreas in humans and animals, the cardiac form of the disease is the more severe and disabling (Rassi-Jr et al. 2010; Rossi et al. 2010). Due to the intracellular parasite replication, differentiation and cell evasion that occur during the acute phase of T. cruzi infection, the parasite triggers a destructive process in the myocardium. It has been suggested that this process is associated with an imbalance in the myocardial oxidative status, in which there is an increase in lipid and protein oxidation that causes progressive deterioration of the cardiomyocyte structure and function, and eventually, leads to cell death (Wen et al. 2004; Wen and Garg, 2004; Gupta et al. 2009a,b). In parallel to myocardium destruction there is a reaction to repair the heart parenchyma and stroma, which reduces the progression of the cardiac lesions, reducing the severity of the infection (Biolo et al. 2010; Rassi-Jr et al. 2010). The heart failure observed in severe cases of the disease develops gradually during T. cruzi infection, when destructive events outweigh the reparative myocardial events (Marin-Neto et al. 2007; Rossi et al. 2010).
Chagas’ cardiomyopathy (ChC) is essential for the design of rational intervention strategies.
In addition to the morphological remodeling of the heart in ChC, pathological changes in cardiac function are also commonly seen. Electrical changes of the sinus rhythm, conduction blocks of the action potential and atrial and ventricular arrhythmias have been widely described (Marin-Neto et al. 2007; Biolo et al. 2010). Moreover, mechanical and hemodynamic abnormalities, such as reduced end-diastolic volume, different strengths of muscle contractions, and altered heart rate and cardiac output, are also involved in cardiac dysfunction and contribute to the increased risk of death in T. cruzi infection (Lima et al. 2010a,b; Rassi-Jr et al. 2010; Santos et al. 2012). However, the biochemical and cellular basis of ChC remains poorly understood.
Thus, this study used a stereological approach and cell isolation to investigate the morphofunctional adaptations of the heart stroma and parenchyma in the chronic phase of T. cruzi infection. Considering the relationship between cardiac structure and function, this
study investigates the hypothesis that structural myocardial remodeling coexists with changes in oxidative status of the myocardium and pathological adaptations of the cardiomyocytes mechanical properties.
Materials and Methods
Animals and infection
Brazilian College of Animal Experimentation and approved by the Animal Research Ethics Commission of the Federal University of Viçosa, Brazil (protocol 30/2009).
Sample size and tissue processing
The hearts from five animals per group were removed for stereological analysis. The sample size for this analysis was determined considering the probability P=1/2 to increase or decrease of the variables of interest. Thus, considering the significance level α=0.05, the minimal significant number of animals used in the statistical analysis was P=(1/2)events; so, if n=5, P=(1/2)5 or P=0.03; thus, P<0.05 (Cruz-Orive and Weibel, 1990).
The right atrium (RA) and the left ventricle (LV) were dissected and the volumes were determined using the submersion method described by Scherle (1970). The LV volume was determined, including the inter-ventricular septum. The RA and LV were placed into histological fixative for 48 hours (freshly prepared 10% w/v formaldehyde in 0.1M phosphate buffer pH 7.2). The fragments of the RA and LV were obtained through the orientador method for stereological study (Mandarim-de-Lacerda, 2003). These fragments were dehydrated in ethanol, cleared in xylol and embedded in paraffin. Blocks were cut into 4µm-thick thick histological sections stained with hematoxylin-eosin (H&E), 4',6-diamidino-2-phenylindole (DAPI) and Phalloidin, and mounted on histology slides. To avoid repeated analysis of the same histological area, sections were evaluated in semi-series, using 1 out of every 20 sections. The slides were visualized and the images captured using a light microscope (Olympus BX-60®, Tóquio, Japan) connected to a digital camera (Olympus QColor-3®, Tokyo, Japan). Sections stained with DAPI and Phalloidin were visualized using the epifluorescence mode of the same microscope.
Tissue shrinkage
was compared to the original volume of the tissue blocks before embedding. The global shrinkage of cardiac tissue was 21% and the stereological estimates were corrected using this index.
Estimation of absolute stereological parameters, cross-sectional area of cardiomyocytes and diffusion distance
All of the stereological analysis was performed according Brüel et al. (2005). The volume density occupied by cardiomyocytes (Vv[cmy], %), interstitium (Vv[int], %) and blood vessels (Vv[bvs], %) in the RA and LV were estimated by point counting according to the following formula:
(1) where ΣP[structure] is the number of points that hit the interest structure and ΣPt denotes the total test points. For these analyses, a test system of 42 points was used in an unbiased two-dimensional test area (At) of 1.38x104µm2 at tissue level.
The length density of the cardiomyocytes (Lv[cmy], mm-2) and blood vessels (Lv[bvs], mm-2) in the RA and LV, were estimated as follows:
(2) where ΣQ-[structure] denotes the total number of interest structure profiles counted in the At, and ΣP[RA; LV] is the total number of points hitting the RA and LV (the reference space) (Brüel et al. 2005).
The surface area density of the cardiomyocytes (Sv[cmy], mm-1) and blood vessels (Sv[bvs], mm-1) in the RA and LV, were estimated using the following equation:
(3) where ΣI[structure] denotes the total number of intersections between the test lines (here 21) and the surface area of the structure of interest, and l is the length of a test line.
vessels (L[bvs], km); and the total surface area of cardiomyocytes (S[cmy], m2) and blood vessels (S[bvs], m2) were estimated by multiplying the relative parameters of density by RA and LV volume.
The mean diffusion distance from capillary to tissue ( [bvs], µm2), was obtained from equation 4:
(4) The mean cross-sectional area of cardiomyocytes (ā[cmy], µm2) was calculated as follows:
(5) For all of these analyses, sixty microscopic fields (magnification x400) in sections stained with H&E were randomly sampled and a total of 8.27×105μm2 of myocardium area was analyzed for each group.
Fibrosis and inflammation
Heart fibrosis was evaluated in 4µm-thick thick histological sections stained with Sirius red dye (Sirius red F3B, Mobay Chemical Co., Union, New Jersey, USA), which marks collagen fibers for observation under a polarizing microscope (Junqueira et al. 1979). The distribution of collagen was analyzed using a segmentation function of the image analysis software Image Pro-Plus 4.5® (Media Cybernetcs, Silver Spring, MD, USA) based on the birefringence properties of the collagen fibrils under polarized light. After image segmentation, the volume density (Vv[col], %) and total volume of the myocardium occupied by collagen fibers (V[col], µm3) were determined using equation 1 and the RA and LV volumes. In this analysis, sixty microscopic fields were investigated (magnification ×200) by random sampling, and a total myocardium area of 3.34×106μm2 was analyzed for each group.
cellularity was evaluated by counting the number of nuclei at ×1000 magnification across sixty random microscopic fields in a total myocardium area of 2.04×105µm2 for each group (Gundersen et al. 1988). Cardiomyocyte nuclei were excluded from this count. All morphological analysis was performed using the image analysis software Image Pro-Plus 4.5® (Media Cybernetcs, Silver Spring, MD, USA).
Cardiomyocytes isolation and contractile function
At euthanasia, the hearts of nine animals from each group were rapidly removed and the extraneous tissue was dissected away. The hearts were mounted onto a Langendorff perfusion apparatus for the isolation of myocytes using a collagenase-protease dispersion technique as previously described (Natali et al. 2002). Briefly, the heart was perfused for 10-15 min with a solution containing 1mg/ml of collagenase type II (Worthington, USA). Ventricular and atrial cardiomyocyte cells were isolated by mechanical titration over 5 minutes at 37ºC, with single cells separated from the non-dispersed tissue by filtration. Only calcium-tolerant, quiescent, rod-shaped cardiomyocytes showing clear cross striations were studied. The isolated cardiomyocytes were used within 4 h of isolation.