Rev Saúde Pública 2004;38(2) www.fsp.usp.br/rsp
Estimate of the validity of a new method for
the isolation of rabies virus
Yeda L N ogueira
Serviço de Virologia do Instituto Adolfo Lutz. São Paulo, SP, Brasil
Correspondence to:
Yeda L Nogueira
Departamento de Epidemiologia Faculdade de Saúde Pública - USP Av. Doutor Arnaldo, 715 01246 904 São Paulo, SP, Brasil E-mail: [email protected] Keywords
Rabies virus, isolation. Rabies, diagnosis. Chiroptera. Sensitivity and specificity. Predictive value.
Based on a doctoral thesis presented to the School of Public Health, University of São Paulo, in 2001. Received on 27/1/2003. Reviewed on 28/7/2003. Approved on 13/10/2003.
Abstract
Objective
No population-based studies have been conducted to show the potential for the use of virological diagnosis of the rabies virus. The objective of the present study was to estimate accuracy parameters for the isolation of the rabies virus in McCoy cells as an alternative method and to compare this with the use of murine neuroblastoma (N2A) cells, which is considered to be a reference method.
Methods
An evaluation was performed on 120 bats collected at random in the Atlantic Forest of the State of São Paulo. The immunofluorescence reaction was utilized for the detection of the rabies virus isolated from the brain of these bats and the presence of the virus was tested in the two cell culture systems. Two data sets were constructed with the results and the analysis was performed using the computer methods for
diagnosis tests (CMDT) software by means of the two-graph receiver operating characteristic (TG-ROC) technique to determine sensitivity and specificity parameters,
as well as other indicators such as efficacy, positive predictive value, negative predictive value and likelihood ratio.
Results
N2A cells presented 90% sensitivity and specificity, while McCoy cells presented 95% sensitivity and specificity. These values were based on cut-off points optimized for each cell type.
Conclusions
The study showed that McCoy cells allowed the obtaining of accuracy estimates that were better than for N2A. The McCoy cell method is therefore an effective method for the isolation of the rabies virus.
INTRODUCTION
Murine neuroblastoma cells derived from different clones were introduced for the isolation of the rabies
virus from 1978 onwards,19,23 and also for the study of
the pathogenesis of rabies.22 Cultured cells have also
been utilized to produce kits for serology use.16
World Health Organization (WHO) experts used to recommend the inoculation of the rabies virus in young
mice (up to 21 days old), known as the biological test, in which the diagnostic examination was done after death. However, after successive studies that compared inoculation in mice with isolation of the virus in murine neuroblastoma cells, they accepted that this latter method could be utilized for diagnosing the disease, in conformity with the methodology described in the
laboratory technique manuals for rabies.3,20
vi-Rev Saúde Pública 2004;38(2) www.fsp.usp.br/rsp Estimativa de validade, análise TG-ROC
Nogueira YL
given target population with a known prevalence.
M ETH O D S
The validation study was performed on a random sample of bats captured in the Intervales State Park, State of São Paulo, Brazil, and evaluations of the pres-ence of rabies virus infection were made using the two cell culture systems.
Five collections were made over a 20-month pe-riod, in which adult bats of various species and both sexes were captured. This was therefore an epidemio-logical survey (screening) for assessing the presence of naturally circulating rabies virus.
The results from the study were compared by means of indicative measures such as sensitivity, specificity, positive predictive value, negative predictive value,
efficiency, Youden index,24 incorrect classification
and positive and negative likelihood ratio, utilizing the technique of Two Graph Receiver Operating
Char-acteristic (TG-ROC),7 by means of the Computational
Methods for Diagnostic Tests (CMDT) program.4
The isolation attempts were performed by means of inoculation of 2% solution of liquefied brain from each captured bat (analysis unit), into the two differ-ent cell culture strains: murine neuroblastoma cells
(N2A; reference method) and McCoy cells12 (method
to be validated). Two consecutive runs of each brain solution were done in each cell culture type. The sec-ond run was done on 96-well plates, with three wells per analysis unit (brain). To preserve the conditions of a blind test, each brain was numbered and coded, thereby making it impossible to recognize the bat species that was being analyzed.
The laboratory diagnostic interpretation was based on reading the fluorescent foci observed directly from the wells after the direct immunofluorescence, using an inverted IM-35 microscope IM-35 (Zeiss).
The study variable was thus linked to the labora-tory diagnosis, which ranged across a scale from zero to 4+. The reaction was considered to be positive for values of 1+, 2+, 3+ and 4+.
The bat sample size calculation11 was based on the
rabies prevalence that was predicted and already known
rus in McCoy cells12 demonstrated that these cells
easily isolate the rabies virus. In studies comparing the results obtained from titration in mice and McCoy
cells (end point calculations),13 excellent replication
of the rabies virus in McCoy cells has been demon-strated, thereby indicating the possible use of these cells in rabies virus assays.
McCoy cells present the characteristic of great sen-sitivity for rabies virus isolation. A clinically suspected
rabies case was described,14 in which the classic
bio-logical test did not detect the rabies virus. The virus was isolated from the patient’s spinal fluid and it was subsequently proven that this was in fact a case of hu-man rabies, after a long period without the occurrence of autochthonous rabies in the State of São Paulo.
This capacity of McCoy cells for isolating the ra-bies virus, even at low concentrations (low viral load), makes this method a very useful tool in the study of the circulation of the rabies virus in natural forest reservoirs.
It must, however, be remembered that despite its efficacy, the rabies virus isolation method using McCoy cells has not yet been validated for use in disease diagnosis laboratories. Nonetheless, isolation of the rabies virus via these cells greatly facilitates the diagnosis, since the results from this method are compatible with the biological test. Moreover, these cells are easy to handle and have much lower mainte-nance costs than murine neuroblastoma cells (N2A) because, as well as requiring minimal nutritive me-dium, McCoy cells also only need half as much bo-vine fetal serum for supplementing the culturing medium. Nor can the costs be compared with the maintenance costs of a colony of mice.
Effectively, what was missing was a population-based study for validating this alternative methodol-ogy. The present study was therefore devised with the objective of validating the McCoy cell methodol-ogy, utilizing N2A cell culturing as a reference method, in accordance with the validation model
pro-posed by Greiner & Gardner.8 These authors
attrib-uted a utility value to receiver operating characteris-tic (ROC) curves, since graphical analysis allows es-timates of important parameters to be made, thereby obtaining the best relationship between sensitivity and specificity and optimizing the cutoff value for a
Table 1 - Number of cells, average, confidence interval, standard deviation, maximum and minimum values.
Cells (n) Arithmetic mean Confidence interval Standard deviation M aximum value* M inimum value*
N2A (120) 11.62 8.54-14.70 17.04 76.00 1.00
McCoy (120) 15.16 11.38-18.95 20.93 76.00 1.00
!
Rev Saúde Pública 2004;38(2) www.fsp.usp.br/rsp
Estimativa de validade, análise TG-ROC Nogueira YL
from isolation using murine neuroblastoma
cells (N2A),20 which was set at 10%. The
pre-cision was stipulated to be 5% and the confi-dence interval 95%. The minimum number of bats required was estimated to be 138. Al-though 166 bats were captured, only 120 were analyzed, due to losses and the exclusion of pregnant females. Thus, it was necessary to adopt other parameters for finite populations,
in accordance with the same authors.11 It was
therefore considered that, for a sample of 120, the prevalence of the disease in a population in which the disease is not endemic would range from 0.3 to 1.5% (representing the ex-pected number with the desired characteris-tic) and so the same 10% prevalence of infec-tion expected via the N2A method was main-tained. The number of 120 bats was consid-ered to be the minimum sample size to be stud-ied with a confidence interval of 95%.
A complementary sample of 19 bats from the Zoo-nosis Control Center of the Municipality of São Paulo was also utilized. The objective was to compare the results obtained from isolation in cell cultures (McCoy and N2A) with the biological test (inocula-tion in mice), to assess the degree of concordance between the three methodologies.
The results from the diagnoses made on the 120 bats were placed in a databank supported by the Epi Info
6.4 program,5 and were subsequently exported to other
statistical programs such as Medcalc18 and CMDT.4
These programs enabled calculation of the sensitivity and specificity parameters and, from these, other
indi-cators: efficiency, Youden index,24 likelihood ratios,
incorrect classification and the positive and negative prediction values.
In addition to obtaining the optimized values, i.e. with the least losses in the sensitivity and specificity parameters, the best value for the cutoff point for the diagnostic method was also determined. The Bland
& Altman technique2 was utilized for assessing the
sampling bias, and the Passing-Bablok technique15
for checking the linearity between the two methods.
Wilcoxon17 statistics were run to evaluate the
differ-ences between the averages for the two groups (N2A and McCoy cell systems), and the Spearman
correla-tion coefficient17 was determined for checking the
correlation between the two methods.
RESU LTS AN D D ISCU SSIO N
Via the Wilcoxon test,17 the difference between the
averages gave a p-value of 0.046, with 15 positive
differences and 23 negative differences between the paired results, which represented a significant differ-ence, albeit very close to the significance limit of
0.05. The Spearman test,17 comparing the same paired
results from the two methods, detected that there was a statistically significant correlation (p=0.0001) be-tween the two methods, with r=0.614 (0.489-0.715).
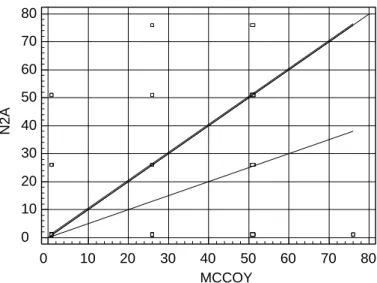
Figure 1 shows the straight-line Passing-Bablok
regression15 and demonstrates linearity between the
two methods, although significant proportional de-viation is presented (p<0.01). This analysis was per-formed by means of testing a hypothesis, and this is presented in the Appendix.
From the Bland & Altman analysis,2 the result
ob-served also showed that there was no bias in the sam-pling, even though the resultant average value from the differences between the pairs of readings from the two cell systems was -3.5, when the ideal average should be zero. Nonetheless, this value is within the tolerance limits, i.e. within the limits of the average plus two standard deviations, when considering a non-biased sample that is interpreted in the light that one method could substitute for the other.
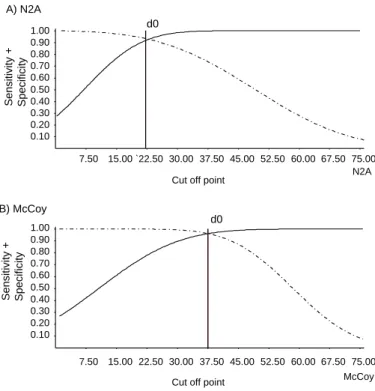
Figures 2A and 2B show the TG-ROC graphs for the two cell systems (N2A and McCoy), with the determi-nation of the optimized values for the sensitivity and specificity parameters. Another important result ob-tained from the graphs was the cutoff point, because this enabled the minimization of the effects of false positives and false negatives.
Table 2 shows the indicators obtained using the most appropriate cutoff point from the graphical analysis Figure 1 - Straight-line regression demonstrating the linearity of the two methods (N 2A and M cCoy), w ith deviation from linearity of p=0.01 (Passing-Bablok technique).
0 10 20 30 40 50 60 70 80
MCCOY 80
70
60
50
40
30
20
10
0
" Rev Saúde Pública 2004;38(2) www.fsp.usp.br/rsp Estimativa de validade, análise TG-ROC
Nogueira YL
that was performed using the TG-ROC tech-nique to optimize the sensitivity and specificity parameter estimates. In the case of N2A cells, these estimates were 90% for both sensitivity and specificity, and the cutoff point that determined these indicators was 1+, i.e. 25% of the cells in the microscope field were infected. For this cutoff point, the esti-mates of other indicators also presented optimized values: the test efficiency indica-tor was 90%, while the probability of classi-fying the observed results wrongly was 9%. The positive likelihood ratio, defined as the chance that a positive result would diagnose true disease and not a false result, was 9, which is the same as saying that the chance of a posi-tive result being diagnosed as a true disease is nine times greater than for this diagnosis to represent a false positive result. The negative likelihood ratio for the same cutoff point was 0.11, which implies that for a negative diag-nosis there is a chance of 11:100 that this re-sult is a false negative.
With regard to McCoy cells, the same in-dicators presented results that were better than those observed for N2A cells. The
esti-mates of sensitivity and specificity were 95%, de-spite a cutoff level that was also within the 1+ band. However, the proportion of cells infected corre-sponded to 38% of the visual field observed under the microscope.
The positive likelihood ratio for McCoy cells was 19, thus demonstrating that the chance that a posi-tive diagnosis in a healthy population would be true was 19 times greater than the chance that this was a false positive result, for this cutoff point of 38%. This chance was twice what was found using the N2A cell methodology. Meanwhile, the estimate of the nega-tive likelihood ratio was 0.052, which represented a chance of 5% that the result would be a false nega-tive. This was half of what was found for N2A cells. In other words, for McCoy cells, only 5:100 of the diag-noses could be false negative results.
The efficiency of the test using McCoy cells was 95%, thus demonstrating that McCoy cells presented superiority or greater facility for isolating the rabies virus in relation to N2A cells.
Nonetheless, the method of reading at microscope crosshairs may be subjective and present a few varia-tions, depending on the observer. This differs from mechanical reading of optical density or radioactiv-ity, in which the results obtained are continuous num-bers. But even so, the immunofluorescence technique
presents sensitivity and specificity of 98%,4 which
means that for a well-trained observer, errors would be rare. However, in attributing limiting values it is in-deed possible for differences to occur between observ-ers, especially in attributing values between 1+ and 2+. Thus, some false positive or false negative results could occur in this “gray zone”, which is also the
loca-Table 2 - Estimates of the sensitivity and specificity parameters from the CMDT program (TG-ROC) for N2A and McCoy cells.
Cells N 2A Confidence interval M cCoy Confidence interval
% % % %
Cutoff point 25.00 (16.00–39.90) 37.50 (27.50–47.50)
Sensitivity 90.00 (83.91–96.09) 95.00 (90.05–99.50)
Speci fi ci ty 90.00 (83.91–96.09) 95.00 (90.05–99.50)
Positive predictive value 38.88 (28.96–48.80) 38.88 (28.91–48.95)
N egative predictive value 99.02 (97.04–100.00) 99.01 (97.05–100.00)
Effi ci ency 90.00 (83.91–96.09) 95.00 (90.05–99.50)
Youden index 80.00 (71.95–88.05) 90.00 (88.80–96.20)
Incorrect classification 0.093 (-5.97–6.99) 0.067 (-5.77–5.91)
Positive likelihood ratio 9.00 (3.10–14.90) 19.00 (10.90–27.10)
N egative likelihood ratio 0.11 (-0.57–0.79) 0.052 (0.005–0.522)
Figure 2 - Tw o Graph Receivi ng O perator Characteri sti c (TG-RO C) analysis: specificity (____) and sensitivity (———) curves. (2A) – N2A cells: sensitivity = specificity =90%, d0=25.00% (estimated cutoff point for non-parametric analysis). (2B) – M cCoy cells: sensitivity = specificity =95%, d0=37.50% (cutoff point for non-parametric analysis).
A) N2A
B) McCoy
7.50 15.00 `22.50 30.0037.50 45.0052.50 60.0067.50 75.00 N2A 0.10
0.20 0.30 0.40 0.50 0.60 0.70 0.80 0.90
1.00 d0
7.50 15.0022.50 30.0037.50 45.0052.50 60.0067.50 75.00 McCoy 0.10
0.20 0.30 0.40 0.50 0.60 0.70 0.80 0.90
1.00 d0
Cut off point Cut off point
Sensitivity +
Specificity
Sensitivity +
#
Rev Saúde Pública 2004;38(2) www.fsp.usp.br/rsp
Estimativa de validade, análise TG-ROC Nogueira YL
tion where the cutoff point is established. In this situ-ation, the number of results considered to be false posi-tives or false negative could increase or decrease, de-pending on each observer. It may happen that the cut-off point is decided arbitrarily, thus affecting the defi-nition of the sensitivity and specificity values. This
point is therefore a critical factor in laboratory tests.8
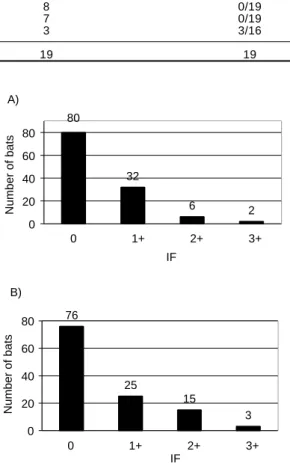
In Figures 3A and 3B, the distributions of the re-sults from reading at microscope crosshairs can be seen. It is precisely between the values attributed for 1+ and 2+ that there is the greatest difference be-tween the methods. In Figures 2A and 2B, the cutoff level divides each figure into a left-hand side senting negative values and a right-hand side repre-senting positive values. It can be seen that the cutoff values are above the 1+ value (25%) for N2A cells and at 37.5 % for McCoy cells, thereby eliminating the possible false negative readings and giving a good safety margin for the correct diagnosis. This
can also be seen via the Youden index,24 which has a
value of 90% (Table 2).
It needs to be remembered that the diagnostic tests are not perfect, but a correct diagnosis is highly prob-able. A test would only be considered perfect when the sensitivity and specificity were 100%, when the prevalence of the disease was correctly ascertained and when compared with the gold standard, remem-bering that the latter is the method that is capable of reproducing the disease or diagnosing the true
dis-ease, for example biopsy.10
In the case of rabies, the method considered to be the gold standard, other than a postmortem biopsy, could be the inoculation into mice of material col-lected from the patient (the biological test). In this case, the isolation accomplished through the test will detect the disease and not the infection, as occurs with the two cell culturing methods. Thus, in Table 3 it can be seen that the isolations performed on cell cultures show that only the 3+ results obtained from McCoy cells concord with the positive results from the biological test. This is equivalent to 75% of the infected cells observed in the visual field of the mi-croscope. For the three cases that were positive in the biological test, the N2A cells presented two values of
2+ and only one of 3+. The Spearman correlation test17
presented a strong correlation between the two meth-ods of cell culturing, with an r coefficient of 0.797 (0.536-0.918) and a p-value of 0.0007, while the co-efficients between the biological test and the two cell methods presented moderate correlation values of
r=0.647 (0.273-0.851) and p=0.006 for N2A and r=0.677 (0.536-0.918) and p=0.004 for McCoy. The
correlation value between the two cell culturing
meth-ods for the second analysis (i.e. relating to the data set of Table 3) was greater than the correlation value for the first analysis (i.e. relating to the data set of Table 1), but it must be remembered that in the sec-ond analysis, the bats were collected from a location with a rabies outbreak, i.e. a place where rabies cases had already been found in bats, thus differing from the first analysis, in which the sample was collected randomly and presupposed healthy animals.
In future work, this question of the cutoff point should be analyzed in more detail, to determine the true status of the disease and infection and to indi-cate whether the virus is circulating among the bat population.
In conclusion, the isolation method utilizing McCoy cells presented accuracy indicators that were all higher than those for N2A cells. Analysis via the TG-ROC technique was very useful for estimating the indica-tors for this preliminary validation of the two cell sys-tems as diagnostic methods. The graphical analysis of the TG-ROC performed using the CMDT computer
program4 allowed the sensitivity and specificity
pa-rameters to be visualized and from these, all the other indicators could be estimated, thereby eliminating the non-parametric sample distribution bias.
The receiver operating characteristic (ROC)25
tech-nique is considered to be a valuable method for com-paring alternative tests for a given diagnostic method. It gives the best sensitivity and specificity param-eters for results that present normal distribution, and this is why TG-ROC analysis was the most appropri-ate technique for estimating the validity parameters in the present study.
Another question that must be analyzed relates to the reference standard utilized. Neuroblastoma cells are an imperfect reference standard because,
accord-ing to established criteria,9 negative results from
iso-lation in cells does not always signify that the animal
is not infected, since the specificity is not 100%.8
Even in the test that is considered to be the gold standard in this case, the biological test, it is only possible to obtain a positive diagnosis in situations in which the viral titer presents sufficient lethality to kill 50% of the animals inoculated. Thus, the viral particle concentration needed is greater than the vi-ral concentrations found in forest reservoirs or
natu-ral samples.10 The virus circulating in reservoirs keeps
to low concentrations so that infection can take place
and be maintained in the species that shelter it.1
$ Rev Saúde Pública 2004;38(2) www.fsp.usp.br/rsp Estimativa de validade, análise TG-ROC
Nogueira YL
REFERÊN CIAS
1. Anderson R, May R. Coevolution of hosts and parasites. Parasitology 1982;85:411-426.
2. Bland JM, Altman DG. Statistical methods for assessing agreement between two methods of clinical measurement. Lancet 1986;8:307-11.
3. Bourhy H, Sureau P, Hirose JM. Comparaison des techniques de detection et d’ isolament. In: Institute Pasteur. Methods de laboratoire pour le diagnostic de la rage. Paris; 1991. p. 78.
4 Briesofsky J. Computer Methods for Diagnostic Tests (CM D T). <U RL:http://w w w 1.vetmed.fu-berlin.de/ ~mgreiner/CM D T/poster.htm> [2004 M ar 8]
5. Dean AG, Dean AJ, Comlombier D, Burton AH, Brendel KA, Smith DC et al. Epi Info version 6: a word processing, data base, and statistics program for epidemiology on microcomputers. Atlanta: Center for Diseases Control and Prevention; 1994.
be capable of infecting the cell while not being subject to interference from the immune response. On the other hand, in mice the immune response may interfere with and mask the infection, thus giving rise to asympto-matic infected animals. In such cases, for the immune response to be overcome and the animal to become sick, a greater viral load is needed. Even so, there is no set viral load at which this will take place, and the viral load required may be larger or smaller, depending on the mouse’s own capacity to respond well or not, i.e. animals with a good response require larger loads, while those with a poor response require a lower viral concen-tration to sicken, since they present low immunity. It must also be remembered that low concentrations of live virus may, when inoculated, function as vaccines and induce an immune response. Such theoretical
con-siderations21 must therefore be taken into account in the
choice and analysis of the gold standard.
The validation of diagnostic tests without a gold standard may run the risk of bias and overestimation
of the results.8 Study designs may also lead to biased
analysis: epidemiological surveys (screening) of in-fectious diseases, for example, are very difficult to validate because, if the methodology utilized is in-appropriate for the diagnosis, there may be subpopulations with latent infection within the sam-ple population. Such factors may lead to biased re-sults. Other validation techniques must then be ob-served so as to better estimate the accuracy of a new diagnostic method. These involve computed estimates utilizing the maximum likelihood function from the
point of view of Bayesian inference.6 In a future study,
A)
80
32
6 2
0 20 40 60 80
0 1+ 2+ 3+
IF
Number of bats
B)
76
25
15
3 0
20 40 60 80
0 1+ 2+ 3+ IF
Number of bats
Table 3 - Comparison of the results obtained in the direct immunofluorescence test (in N 2A and M cCoy cells) and the biological test (in mice).
Immunofluorescence N2A cells M cCoy cells Biological test (no. of deaths)
0 1 1 0/19
1+ 12 8 0/19
2+ 5 7 0/19
3+ 1 3 3/16
Total 19 19 19
an analysis of this type will be performed in order to define the true status of the disease and its preva-lence in the forest reservoir studied.
ACKN O W LED GEM EN TS
To Prof. Dra. Sabina L. D. Gotlieb for reading and making suggestions for this text.
%
Rev Saúde Pública 2004;38(2) www.fsp.usp.br/rsp
Estimativa de validade, análise TG-ROC Nogueira YL
6. Enoe C, Georgiadis MP, Johnson WO. Estimation of sensitivity and specificity of dianostic tests and disease prevalence when the true diseade state is unknown. Prevent Veterinary Med 2000;45:61-81.
7. Greiner M . Two-graph receiver operating characteristics (TG-ROC): update version supports optimisation of cut-off vallues that minimise overall misclassification costs. J Immunol Methods 1996;191:93-4.
8 Greiner M, Gardner IA. Epidemiologic issues in the validation diagnostic tests. Prevent Veterinary Med 2000;45:3-22.
9. Greiner M, Pfeiffer D, Smith RD. Principles and practical application of receiver-operating characteristic analysis for diagnostic tests. Prevent Veterinary Med 2000;45:23-41.
10. Krammer HC. Evaluating medical tests- objective and quantitative guidelines. N ew bury Park: Sage Publications; 1992.
11. Lwanga S, Lemeshow S. Sample size determination in health studies. Genève: WHO; 1991.
12. Nogueira YL. Rabies virus in McCoy cell line. Part I: Cytopathic effect and replication. Rev Inst Adolfo Lutz 1992;52:9-16.
13. Nogueira YL, Amaral CA. Rabies virus in McCoy cell line. Part II: Titration. Rev Inst Adolfo Lutz 1992;52:17-21.
14. Nogueira YL. Morphometric analysis of McCoy cells inoculated with cerebrospinal fluid from patient with rabies. Mem Inst Oswaldo Cruz 1998;93:509-14.
15. Passing W, Bablok H. A new biometrical procedure for testing the equality of measuraments from two different analytical methods. Aplication of linear regression procedures methods for comparison studies on clinical chemistry (Part I). J Clin Chem Biochem 1987;21:709-20.
16. Perrin E, Rolin PE, Sureau P. A rapid rabies enzyme immuno-diagnosis (RREID): a useful and simple technique for the routine diagnosis of rabies. J Biol Stanrdization 1986;14:217-22.
17. Sachs L. The comparation of independent data. In: Applied Statistics A Handbook of Techniques. 2nd ed. New York: Verlag Spring; 1984. p. 299-303.
18. Schoonjans F. MedCalc statistics for biomedical research. Belgium; 1998.
19. Smith A, Tignor G, Emmons R, Woodie J. Isolation of field rabies strains in CER and Murine Neuroblastom cell culture. Intervirol 1978;9:359-61.
20. Smith JS, King A. Monoclonal antibodies for identification of rabies and non-rabies lyssavirus: In: Meslin FX, Kaplan MM, Koprowski H, editors. Laboratory in rabies. 4th ed. Geneva: W orld Health Organization, 1996. p. 133-44.
21. Somoza E, Mossman D. Comparing and optimizing diagnostic tests: information-theoretical approach. Med Decis Making 1992;12:179-88.
22. Tsiang H. An in vivo study of rabies pathogenesis. Bull Inst Pasteur 1985;83:41-5.
23. Webster W. A tissue culture infection test in routine rabies diagnosis. Can J Vet Res 1987;51:367-9.
24. Youden D. Index for rating diagnostic tests. Cancer 1950;3:32-5.
& Rev Saúde Pública 2004;38(2) www.fsp.usp.br/rsp Estimativa de validade, análise TG-ROC
Nogueira YL
APPEN D IX
Passing-Bablok regression
The interpretation of the results depends on analy-sis of the Passing-Bablok regression equation, as fol-lows, in which:
Variable X = N2A;
Variable Y = McCoy;
Sample =120.
Regression equation:
Y = 0.0000 + 1.0000 X
Where:
Intercept A = 0.0000 (95% confidence interval = -1.0000 to 0.0000)
Slope B = 1.0000 (95% confidence interval = 1.0000 to 2.0000)
Linearity test:
Standard deviation of the linearity: (P<0.01)
This expression is understood in the following
manner. The confidence interval of the intercept A can be used as a hypothesis test, in which:
• H0: the two methods are equal
• HA: the two methods are different
According to the Passing-Bablok technique (1983), the straight-line regression result is evaluated in the form of a hypothesis test, in which:
• A = 0; the hypothesis is accepted if the 0 is within
the confidence interval
For the value of the straight-line slope (B), the con-fidence interval can again be used as a hypothesis test, in which:
• H0: the two methods present the same linearity
• HA: the two methods present different
linearities.
To accept H0, the value of B needs to be 1 and this value must lie within the confidence interval. If the value of B differs from 1, H0 is then rejected and HA is accepted. This latter result indicates that there is linearity but it is proportionally different, since if p<0.01, this value defines the deviation of the linearity.