41
EVALUATING THE DROUGHT STRESS TOLERANCE EFFICIENCY OF WHEAT (TRITICUM AESTIVUM L.) CULTIVARS
M.A. Sammar Raza1, M.F. Saleem2, I.H. Khan3, M. Jamil1, M. Ijaz1, M.A. Khan1, Researchers
1
University College of Agriculture & Environmental Sciences The Islamia University of Bahawalpur, Pakistan
2
Department of Agronomy, University of Agriculture, Faisalabad, Pakistan
3
Department of Agronomy, College of Agriculture, University of Agriculture, Faisalabad, Pakistan
E-mail: mueen_1981@yahoo.com, Phone: +92629255531
Received December 19, 2012
ABSTRACT
The study was conducted at the Nuclear Institute for Agriculture and Biology (NIAB), Faisalabad, Pakistan to evaluate the drought stress tolerance efficiency of wheat cultivars. Eight wheat (Triticum aestivum L.) genotypes namely (Pasban-90, Inqalab-91, Auqab-2000, AS-2002, Sahar-2006, Shafaq-2006, Lasani-2008, and FSD-2008) were used for screening in laboratory. Three techniques were used for the screening. These techniques are (I) seed germination at -0.6 MPa external water potential (PEG-6000), (2) seedling growth after 14 days at -0.6 MPa (PEG-6000), and (3) plant water relations of seven-week-old pot-grown plants. Significantly highest germination stress tolerance index, root length stress tolerance index and the water content was recorded in Lasani-2008 and lowest was rec-orded in Auqab-2000. Dry matter percentage was recrec-orded significantly highest in pasban-90 while the lowest dry matter percentage was observed in auqab-2000. FSD-2008 gained maximum plant height and was recorded minimum in Inqilab-91. Relative saturation deficit was significantly highest in Auqab-2000 while the significantly lowest relative saturation deficit was recorded in case of Lasa-ni-2008. It was concluded from the results that Lasani-2008 performed better under drought and Au-qab-2000 was recorded most drought sensitive variety.
KEY WORDS
Drought stress; Wheat; Relative water content; Stress tolerance index.
Water, the most important component of life, is rapidly becoming a critically short com-modity for humans and their crops. Shortage of water limits plant growth and crop productivity in arid regions more than any other single environ-mental factor (Boyer, 1982). Wheat (Triticum aestivum L.) is a staple food of about one third of the world’s population. It is one of the most im-portant cereals which provide more calories in the form of starch and proteins; besides vitamins I and diet than any other food crop (Govt. of Pa-kistan, 2004). Water stress reduces crop yield regardless of the growth stage at which it occurs in wheat. Arid and semi arid environment besides other factors may induce water stress during crop growth and development, resulting a reduction in crop yield (Ashraf et al., 1995). In spite water stress is recognized as an important factor that
affects wheat growth and yield (Ashraf and Naq-vi, 1995; Ashraf, 1998), differences among culti-vars were found in response to soil moisture re-strictions (Rascio et al., 1992; Iqbal et al., 1999).
Turgor maintenance plays an important role in drought tolerance of plants which may be due to its involvement in stomatal regulation and hence photosynthesis (Ludlow et al., 1985). Wa-ter is essential at every stage of plant growth from seed germination to plant maturation. Water stress reduces crop yield regardless of the growth stage at which it occurs the adverse effect of wa-ter stress on crop yield may be more pronounced at some particular growth stage (El-Far and Al-lan, 1995) depending upon the nature of crop species and even genotypes within the species.
42 tolerance can best be accomplished by selecting for grain yield under field conditions (Richards, 1978), but such procedures require full season field data. It is not always an efficient approach, especially in mesic locations. An alternative may be to screen material under laboratory or green-house conditions using seedlings as test material. Evidence has been presented that alfalfa (Medi-cago sativa L.) accessions that emerge at -0.65 MPa and soybean at -0.60 MPa external osmotic pressure show better field emergence and surviv-al under drought than those accessions that do not emerge under laboratory conditions (Johnson and Rumbaugh, 1981). Several physiological charac-teristics have been reported as being reliable in-dicators for the selection of germplasm possess-ing drought tolerance. These characteristics in-clude seed germination and seedling growth in nutrient solutions with low osmotic potential (Ashraf et at, 1992; Blum, 1980; Richards, 1978), the degree of electrolyte leakage (cell membrane stability, CMS) from drought-damaged leaf cells and the water relations of plants (Dedio, 1975; Ashraf et al., 1992).
Screening of different crop plants to abiotic stresses is used to find out most resistant variety (Zafar-ul-Hye et al., 2007). While screening the wheat cultivars for most drought sensitive and most drought tolerant genotype it was considered that the success of these approaches under green house and lab conditions depends on their same behavior under field condition also.
MATERIALS AND METHODS
The experiment was conducted to screen the available wheat germplasm (Inqalab 91, Lasani 2008, FSD 2008, Sahar 2006, Shafaq 2006, AS 2002, Auqab 2000) for drought tolerance. The seeds of all cultivars were obtained from the Wheat Research Institute, (Ayub Agricultural Research Institute), Faisalabad, Pakistan.
The screening experiment (to determine the most drought resistant and most drought sensitive wheat germplasm) was conducted in a growth chamber, Stress Physiology Lab; Nuclear Insti-tute for Agriculture and Biology (NIAB), Faisalabad, Pakistan. The water stress treatments (0, -0.6 Mpa) were created by Polyethylene glycol (PEG-6000). PEG-6000 (0 and 120 g) was dis-solved in 1 L of half strength Hoagland's nutrient solution separately to create water stress treat-ments of control and -0.6 Mpa, respectively. The seeds were surface sterilized with 10% sodium hypochlorite solution for five minutes and
washed three times with distilled water. Ten seeds were sown in each Petri dish containing filter papers.
The 5 ml of water (control) and 5ml solution of PEG were added separately in these Petri plates. The experiment was laid out in a com-pletely randomized design with three replicates for each experimental unit. Five ml of appropri-ate treatment solution was applied daily in each Petri dish after washing out the previous solution. Number of seeds germinated was counted daily and data were recorded for 14 days. A seed was considered germinated when both plumule and radicle had emerged to 5 mm. Total germination was expressed as percent of that in the control treatment for each line and then data were ana-lyzed statistically. Rate of germination was de-termined on the basis of days to 50% germination calculated from the untransformed data. Shoot length and root length, fresh and dry weights/seedling were recorded after 14 days of the start of the experiment.
PI: nd2 (1.00) + nd4 (0.75) + nd6 (0.50) + nd8 (0.25)
Promptness index is the percentage of seed which germinate at 2nd, 4th, 6th and 8th day of ob-servation as indicated by nd2, nd4, nd6 and nd8.
Percentage of germination stress tolerance index is determined as below:
G.S.I. (%) = Promptness index of stressed seeds x 100 Promptness index of control seeds
PHSI (%) = Plant height of stressed plants x 100 Plant height of control plant
After 14 days seedlings were harvested and their shoot and root length (named as shoot length stress tolerance index and root length stress toler-ance index) were recorded.
RLSI (%) = Root length of stressed plants x 100 Root length of control plants
SLSI (%) = Shoot length of stressed plants x 100 Shoot length of control plants
After drying the plant in oven at 700C for 24 hours, the dry matter stress tolerance index was recorded as follows:
DMSI (%) = Dry matter of stressed plant x 100 Dry matter of control plant
43 temperature they were kept for one night in test tube containing 10ml of distilled water. The water was removed from the leaves surfaces and leaves were weighed again to obtain turgid weight (satu-rated weight). Their dry weight was determined after placing leaves in oven at 700C for 24 hours. Relative saturation deficit was determined as fol-lows:
RSD (%) = Saturated weight – Fresh weight x 100 Saturated weight
RESULTS
Eight wheat genotypes namely (Pasban-90, Inqalab-91, Auqab-2000, AS-2002, Sahar-2006, Shafaq-2006, Lasani-2008, FSD-2008) were cho-sen for this study to compare the performance of their growth under normal and stress condition in laboratory during 2008.
The data analyzed (Figure 1) indicated the significant variation among genotypes. Signifi-cantly highest germination stress tolerance index was recorded in Lasani-2008 (97%), followed by AS-2002 (94%), which was at par with FSD-2008 (93%) and Pasban-90 (93%). The lowest germina-tion percentage was recorded in Auqab-2000.
Figure 1 – Germination stress tolerance index (%) of wheat cultivars after 14 days of growth at 0 and
-0.06 MPa external water potential
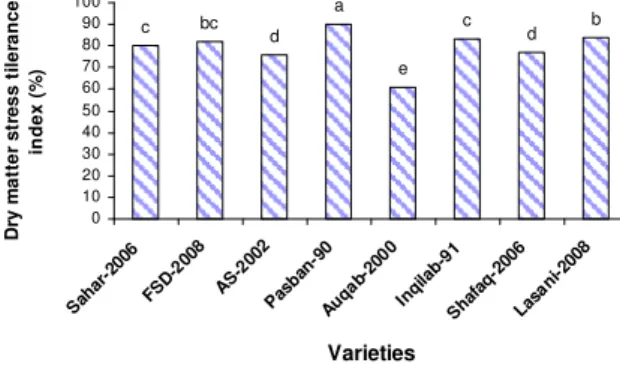
Dry matter stress tolerance index of different wheat cultivars (Figure 2) differed significantly. The significantly highest dry matter percentage was recorded in pasban-90 (90 %) while the sig-nificantly lowest dry matter percentage was ob-served in auqab-2000 (61 %).
Plant height stress tolerance index showed a different pattern for different wheat cultivars. FSD-2008 gained maximum plant height followed by Sahar-2006, Lasani-2008, Pasban-90, AS-2002, Auqab-2000, Shafaq-2006 and Inqilab-91 and all these differ significantly from each other (Figure
3). Plant height was reduced significantly by water deficit.
Figure 2 – Dry matter stress tolerance index (%) of wheat cultivars after 14 days of growth at 0 and
-0.06 MPa external water potential
Figure 3 – Plant height stress tolerance index (%) of wheat cultivars after 14 days of growth at 0 and
-0.06 MPa external water potential
While comparing the growth performance of wheat cultivars under drought it was observed that maximum root length stress tolerance index (99%) was attained by Lasani-2008 followed by Inqilab-91, AS-2002, Pasban-90, Sahar-2006, FSD-2008, Shafaq-2006 and Auqab-2000 and all these varie-ties differed significantly from each other. Root length was statistically restrained by drought stress (Figure 4).
Figure 4 – Root length stress tolerance index (%) of wheat cultivars after 14 days of growth at 0 and
-0.06 MPa external water potential a cd e f bc b bc d 0 20 40 60 80 100 120 Sah ar-2 006 FSD -200 8 AS -200 2 Pas ba n-90 Auq ab-2 000 Inqi la b-91 Sha fa q-2006 Lasa ni-2 008 Varieties G e rm in a ti o n s tr e s s t o le ra n c e in d e x ( % ) b d c e a d bc c 0 10 20 30 40 50 60 70 80 90 100 Sah ar-2 006 FSD -200 8 A S-2002 Pas ba n-90 Auqa b-20 00 Inqi la b-91 Sha fa q-2006 Lasa ni-2 008 Varieties D ry m a tt e r s tr e s s t il e ra n c e i n d e x ( % ) c g h f d e a b 0 10 20 30 40 50 60 70 80 90 100 Saha r-20 06 FSD -200 8 AS -200 2 Pasb an-9 0 Auq ab-2 000 Inqi la b-91 Sha fa q-2006 Lasa ni-2 008 Varieties P la n t h e ig h t s tr e s s t o le ra n c e in d e x ( % ) PHSI a g b h d c f e 0 20 40 60 80 100 120 Sah ar-2 006 FS D-2008
44 The relative saturation deficit was significant-ly highest in Auqab-2000 (37%), followed by Pas-ban-90 (28%) while the significantly lowest rela-tive saturation deficit was recorded in case of La-sani-2008 (Figure 5). The differences between FSD-2008 and Sehar-2006 were non-significant; shafaq-2006 and AS-2002 also showed non-significant differences with respect to relative sa-turation deficit (Figure 5).
Figure 5 – Relative saturation deficit (%) of wheat cultivars after 07 days of growth at 0 and -0.06 MPa
external water potential
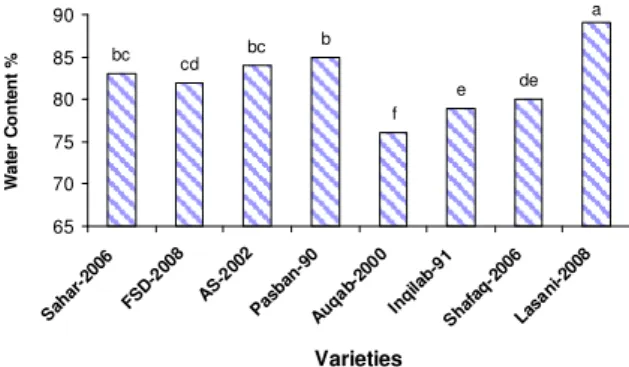
Figure 6 – Water contents (%) of wheat cultivars after 07 days of growth at 0 and -0.06 MPa external water
potential
The water content was significantly maxi-mum in Lasani-2008 (89%) followed by Pasban-90 which was at par with AS-2002 and Sehar-2006.The significantly lowest water content was recorded in case of Auqab-2000 (Figure 6).
DISCUSSION
Guttieri et al. (2001) reported two different water deficit regimes to screen out sixteen wheat varieties to find out the impact of moisture deficit on wheat growth and yield. Blum et a1. (1980) and Ashraf et al. (1992) investigated that solutions containing polyethylene glycol (PEG) for screen-ing of the wheat seedlscreen-ings can be used for resis-tance to drought. Present studies show genotypic
variation in germination, plant height, plant dry matter, seedling growth, relative saturation deficit and water contents grown under 0 and -0.06 Mpa. However, not all these parameters proved to be equally effective for screening wheat varieties for their tolerance to stress. It was claimed by Fernan-dez (1992) that selection based on STI (stress to-lerance index) would help to evaluate the higher stress tolerance genotypes with good yield poten-tial. Bouslama and Schapaugh (1984) reported same findings in soybean. Ashraf et al. (1992) concluded that under moisture deficit, germination is not the standard for predicting plant’s drought tolerance. However there are other reports (Ri-chards, 1978) indicating germination as a useful criterion in screening for water stress tolerance. Several factors disproved seed quality such as the age of the seed, abiotic factors during plant life, growth and development, harvest and post harvest conditions etc. The response of genotypes may be different to different factors, which could be re-flected in their respective seed performances. Thus, for identifying healthy and vigorous seed lots capable of establishing appropriate popula-tions under deficit soil moisture condipopula-tions or un-der abiotic stress (Ibrahim et al., 2007), the germi-nation test of seed may be useful, but these genetic differences may not be related to subsequent growth of seedling and seed yield.
The productivity of genetically different va-rieties and their consistency is determined by seedling growth plus the correlation of other pa-rameters like dry matter accumulation, plant height and root length. Brukner and Frohberg (1987) reported DSI (dry matter stress tolerance index) as a parameter for measuring genotypic yield potential under drought stress conditions. However, Clarke et al. (1992) reported that DSI did not differentiate yield potential among geno-types. DSI actually a best tool for measuring the yield stability of genotypes based on reducing the yield loss of genotypes under stressed conditions compared to non stressed conditions (Clarke et al., 1982).
Water is widely recognized as important fac-tor for the maintenance of internal water balance required for plant growth, development and/or survival. There is variable number of primary and secondary factors which affect the plants under drought stress (Boyer, 1996). A most common damaging effect of low moisture level or low wa-ter potential is the decline in fresh biomass and dry matter production in wheat (Peschke et al., 1997; Ashraf et al., 1998) and rice (Manabendra and Ba-ruah, 1998). This decrease was because of reduced f
d c a
b d e e
0 5 10 15 20 25 30 35 40
Sah ar-2
006
FS D-2008
AS -200
2
Pas ba
n-90
Auq ab-2
000
Inqi la
b-91
Shaf aq-2
006
Lasa ni-2
008
Varieties
R
e
la
ti
v
e
s
a
tu
ra
ti
o
n
d
e
fi
c
it
(
%
)
a
de e f b bc cd bc
65 70 75 80 85 90
Sah ar-2
006
FSD -200
8
A S-2002
Pas ba
n-90
Auqa b-20
00
Inqi la
b-91
Sha fa
q-2006
Lasa ni-2
008
Varieties
W
a
te
r
C
o
n
te
n
t
45 photosynthates production under water deficit conditions (Tezara et al., 1999; Anjum et al., 2003; Wahid and Rasul, 2005). Similar findings were resulted by Ashraf and Yasmin (1995) in grasses and by Abrechit and Carberry (1993) in maize. Many workers (Levitt, 1972; Dedio, 1975; Ashraf et at., 1994) have reported that drought tolerant varieties have a smaller water deficit (relative satu-ration deficit) per unit decrease in water potential of leaf than drought sensitive plants. Siddique et al. (2004) concluded a reduction in RWC of the leaf and leaf water potential, which had significant effect on photosynthesis under deficit moisture conditions. These results are similar with the find-ings of (Zhu, 2002; Wahid and Close, 2007). Rela-tive water contents (RWC) significantly reduced by creating water stress. Erickson et al. (1991) reported that RWC of leaf indicate the internal water balance of plant tissue and changes in tissue water content change the tissue dry weight conti-nually. The investigations of Dedio (1975), Clarke and McCaig (1982), Ashraf et al. (l994) in screen-ing the excised leaf internal water capabilities,
RSD (relative saturation deficit) or relative water contents of wheat varieties under drought stress conditions indicated that wheat varieties with low-er RSD or highlow-er RWC are more drought-resistant. The similar results were also obtained by Carter and Patterson (1985) in soybean. Present study on wheat varieties confirmed the above find-ings.
CONCLUSION
Lasani-2008 was selected most drought resis-tant variety and Auqab-2000 was selected most drought sensitive variety depending upon stress tolerance indices, relative saturation deficit and water contents.
ACKNOWLEDGEMENT
Lot of thanks to Higher Education Commis-sion, Pakistan for compensating research ex-penses.
REFERENCES
Abrechit, D.G. and P.S. Carberry. 1993. The influence of water deficit prior to tassel initiation in maize growth, development and yield. Field Crop Research 31: 55-69. Anjum, F., M. Yaseen, E. Rasul, A. Wahid and
S. Anjum. 2003. Water stress in barley. I. Effect on chemical composition and chlo-rophyll contents. Pakistan Journal of Agriccultural Sciences 40: 45-9.
Ashraf, M. and N. Yasmin. 1995. Responses of four arid zone grass species from varying habitat to drought stress. Biology of Plant 37: 567-575.
Ashraf, M. Y. and S.S.M. Naqvi. 1995. Studies on water uptake, germination and seedling growth of wheat genotypes under PEG-6000 induce water stress. Pakistan Jour-nal of Scientific and Industrial Research 38: 103-133.
Ashraf, M.Y. 1998. Yield and yield compo-nents response of wheat (Tritcium aesti-vum L.) genotypes grown under different soil water deficit conditions. Acta Agro-nomica Hungarica 46: 45-51.
Ashraf, M.Y., A.R. Azmi, A.H. Khan and S.S.M. Naqvi. 1994. Water relations in different wheat (Triticum aestivum L.) genotypes under soil water deficits. Acta Physiologiae Plantarum 16: 231-240.
Ashraf. M.Y., A.H. Khan and A.R. Azmi. 1992. Cell membrane stability and its re-lation with some physiological processes in wheat. Acta Agronomica Hungarica 41: 183-191.
Blum. A., B. Sinmena and O. Ziv. 1980. An evaluation of seed and seedling drought tolerance screening tests in wheat. Euphy-tica 29: 727-736.
Bouslama, M. and W.T. Schapaugh Jr. 1984. Stress tolerance in soybeans. I. Evaluation of three Screening techniques for heat and drought tolerance. Crop Science 24: 933-937.
Boyer, J.S. 1982. Plant productivity and envi-ronment. Science 218: 443-448.
Boyer, J.S. 1996. Advances in drought toler-ances in plants. Advtoler-ances in Agronomy 56: 187-218.
Bruckner, P.L. and R.C. Frohberg. 1987. Stress tolerance and adaptation in spring wheat. Crop Science 27: 31-36.
Carter. J.S.Jr. and R.P. Patterson. 1985. Use of relative water content as a selection tool for drought tolerance in soybean. In: Agronomy Abstracts p.7. ASA. Madison. WI.
46 quantification of drought tolerance in wheat. Crop Science 32: 723–728.
Clarke. J.M. and T.N. McCaig. 1982. Evalua-tion of techniques for screening for drought resistance in wheat. Crop Science 22: 503-506.
Dedio. 1975. Water relations in wheat leaves as screening test for drought resistance. Canadian Journal of Plant Sciences 55: 369-378.
El-Far, I.A. and A.Y. Allan. 1995. Responses of some wheat cultivars to sowing me-thods and drought at different stages of growth. Assuit Journal of Agricultural Sciences 26: 267–277.
Erickson, I.J., D.L. Ketring and J.F. Stone. 1991. Response of internal tissue water balance of peanut to soil water. Journal of Agronomy 72: 73-80.
Fernandez, G.C.J. 1992. Effective selection criteria for assessing plant stress toler-ance. In: Proceedings of on the Sympo-sium Taiwan, August 13-18, 25: 257-270. Government of Pakistan. 2004. “Economic
Survey of Pakistan”, Finance Division, Economic Wing, Islamabad, Pakistan. Guttieri, M.J., J.C. Stark, K.M. O'Brien and E.
Souza. 2001. Relative sensitivity of spring wheat grain yield and quality arameters to moisture deficit. Crop Science 41: 327-335.
Ibrahim, M., J. Akhtar, M. Younis, M. A. Riaz, M. Anwarul-Haq and M. Tahir. 2007. Se-lection of cotton (Gossypium hirsutum L.) genotypes against NaCl stress. Soil and Environment 26(1): 59-63.
Iqbal, M., K. Ahmad, M. Sadiq and M.Y. Ashraf. 1999. Yield and yield components of durum wheat as influenced by water stress at various growth stages. Pakistan Journal of Biological Sciences 2: 11–14. Johnson, D.A. and M.D. Rambaugh. 1981.
Nodulation and acetylene reduction by certain rangeland legume species under field condition. Journal of Range Man-agement 34: 178-181.
Levitt. J. 1972. Response of plants to stresses. Academic Press. New York and London. p.697.
Ludlow, M.M., M.J. Fisher and J.R. Wilson. 1985. Stomatal adjustment to water defi-cits in three tropical grasses and a tropical
legume in controlled conditions and in the field. Journal of Plant Physiology 12: 131-149.
Manabendra, D.K. and K. Baruah. 1998. Stu-dies on physiological traits of rice (Oryza sativa L.) cultivars under moisture stress situations. Industrial Journal Ecology 25: 192-196.
Peschke, G., C. Seidler and Yogal. 1997. Ef-fect of drought during the growing season on Agricultural (Triticum aestivum L.) and forest plant canopy (Piceae abies L.). In: Proc. 14tInt. Cong. Biomet., 2(2): Sol-venia.
Rascio, A., C. Platani., N. DiFonza and G. Wittemer. 1992. Bound water in durum wheat under drought stress. Plant Physiol-ogy 98: 908–912.
Richards, R.A. 1978. Variation between and within species of rapeseed (Brassica cam-pestris and B.napus) in response to drought stress. III. Physiological and phy-sicochemical characters. Australian Jour-nal of Agricultural Research 29: 491-501. Siddique, M.R.B., A. Hamid and M.S. Islam.
2004. Drought stress effects on water rela-tions of wheat. Botanical Bulletin of Aca-demia Sinica 41:35-39.
Tezara, W., V.J. Mitchell, S.D. Driscoll and D.W. Lawlor. 1999. Water stress inhibits plant photosynthesis by decreasing coupl-ing factor and ATP. Nature 401: 914-917. Wahid, A. and E. Rasul. 2005. Photosynthesis
in leaf, stem, flower and fruit In: Pessa-rakli M. (Ed). Hand book of Photosynthe-sis, 2nd Ed., CRC Press, Florida, pp: 479-497.
Wahid, A. and T.J. Close. 2007. Expression of dehydrins under heat stress and their rela-tionship with water relations of sugarcane leaves. Biologia Plantarum 51: 104-109. Zafar-ul-Hye, M., Z.A. Zahir, S.M. Shahzad,
U. Irshad and M. Arshad. 2007. Isolation and screening of rhizobia for improving growth and nodulation of lentil (Lens cu-linaris Medic) seedlings under axenic conditions. Soil and Environment 26(1): 81-91, 2007.