www.biogeosciences.net/9/3287/2012/ doi:10.5194/bg-9-3287-2012
© Author(s) 2012. CC Attribution 3.0 License.
Biogeosciences
Isotopic identification of nitrogen hotspots across natural
terrestrial ecosystems
E. Bai1, B. Z. Houlton2, and Y. P. Wang3
1State Key Laboratory of Forest and Soil Ecology, Institute of Applied Ecology, Chinese Academy of Sciences, Shenyang 110164, China
2Department of Land, Air and Water Resources, University of California, Davis, California, USA 3CSIRO Marine and Atmospheric Research and Centre for Australian Weather and Climate Research, Aspendale VIC 3195, Victoria, Australia
Correspondence to:E. Bai ([email protected])
Received: 8 November 2011 – Published in Biogeosciences Discuss.: 15 December 2011 Revised: 29 June 2012 – Accepted: 12 July 2012 – Published: 23 August 2012
Abstract. Nitrogen (N) influences local biological pro-cesses, ecosystem productivity, the composition of the atmospheric-climate system, and the human endeavour as a whole. Here we use natural variations in N isotopes, coupled with two models, to trace global pathways of N loss from the land to the water and atmosphere. We show that denitrification accounts for approximately 35 % of to-tal N losses from the natural soil, with NO, N2O, and N2 fluxes equal to 15.7±4.7 Tg N yr−1, 10.2±3.0 Tg N yr−1, and 21.0±6.1 Tg N yr−1, respectively. Our analysis points to tropical regions as the major “hotspot” of nitrogen export from the terrestrial biosphere, accounting for 71 % of global N losses from the natural land surface. The poorly studied Congo Basin is further identified as one of the major nat-ural sources of atmospheric N2O. Extra-tropical areas, by contrast, lose a greater fraction of N via leaching pathways (∼77 % of total N losses) than do tropical biomes, likely con-tributing to N limitations of CO2uptake at higher latitudes. Our results provide an independent constraint on global mod-els of the N cycle among different regions of the unfertilized biosphere.
1 Introduction
Nitrogen (N) is essential to all life and affects many differ-ent aspects of the Earth system as a whole. At the molecu-lar scale, for instance, N is a significant component of nu-cleic acids, protein and other biomolecules that regulate a
suite of cell functions. At larger scales, N influences the cli-mate system via its direct impact on clicli-mate forcing and indi-rectly via its role in constraining CO2uptake and storage on land and in the sea (Fig. 1). Consequently, biogeochemists, climatologists, and ecologists are fundamentally interested in understanding how N cycles among Earth’s biomes and across a spectrum space-time scales – especially in terms of how much N enters and leaves the biosphere along dissolved vs. gaseous paths.
However, two principal factors have greatly challenged this objective. First, N2 – likely the dominant gaseous N product of soil bacteria – is difficult to measure accurately because of the large background concentration of N2in air (Scholefield et al., 1997; Swerts et al., 1995). This chal-lenge has sparked controversies over the “missing N” in the global N budget (Galloway et al., 2004). Second, emissions of NO, N2O or N2can vary significantly in space and time; hence, scaling up field measurements, using either empirical or computational models, imparts large, unexplained errors in estimates of gaseous N emissions (Matson et al., 1989; Galloway et al., 2004; Scheer et al., 2009; Butterbach-Bahl et al., 2002; McClain et al., 2003; Groffman et al., 2009). Consequently, modelling has become an essential tool for es-timation of N gas emissions at regional to global scales.
Fig. 1
Aquatic ecosystem Atmosphere
Tropospheric ozone effects
(smog)
Stratospheric ozone effects (ozone holes)
Greenhouse effects
N2 NOx N2O
Particulate matter (NHx, NOy)
Terrestrial ecosystems
Reactive N
Carbon cycle
Nitrification/ Denitrification
Leaching
Eutrophication
Reactive
N Carbon cycle
Deposition Fixation
NHx, NOy N2 N2O
Nitrification/ Denitrification Deposition Fixation
N limitation
Fig. 1.Diagram of N cycling and its influences on global change.
(Li et al., 1992), CASA (Carnegie-Ames-Stanford) (Potter et al., 1996), EPIC (erosion-productivity impact calculator) (Williams et al., 1984), and INCA (integrated nitrogen in catchment) (Whitehead et al., 1998). These latter models build on various rate-controlling properties of denitrification such as climatic, soil, nutrient, and land use characteristics. They are generated to varying degrees from empirical mea-surements that are extrapolated from lab and field studies to ecosystems, regions and the globe. However, due to the com-plexities in N transformations, these models are generally highly parameterized and poorly constrained by observations that integrate large scales of space and time. In addition, it is difficult to obtain good estimates of many of the spatially heterogeneous variables used to constrain denitrification and some input data are not available at the global scale (Groff-man et al., 2009).
Natural variations in N isotope abundance have provided insights into large-scale N cycling on land and in the sea (Amundson and Baisden, 2000; Houlton et al., 2006; Hand-ley et al., 1999; Brenner et al., 2001; Amundson et al., 2003; Houlton and Bai, 2009; Bai and Houlton, 2009; Altabet et al., 1995; Sigman et al., 2003; Devol et al., 2006; Morford et al., 2011). The stable isotopes of N,15N and14N vary naturally in their abundance among biogenic materials owing to iso-tope fractionations, particularly kinetic ones, which are com-monly associated with organisms’ enzymatic preferences for
isotopically light N (14N) (Kendall, 1998). Within the terres-trial biosphere, coherent patterns in the N isotope composi-tion of soils and ecosystems are observed across gradients in temperature, precipitation, and latitude (Handley et al., 1999; Amundson et al., 2003; Craine et al., 2009). Such15N/14N patterns in total soil N pools reflect the dominant pathways by which N enters and leaves ecosystems (Amundson et al., 2003; Houlton et al., 2006; Bai and Houlton, 2009; Houl-ton and Bai, 2009). HoulHoul-ton and Bai (2009) have previously developed an isotopic approach to partition the N losses be-tween gaseous and leaching vectors for the natural land bio-sphere. However, their approach did not consider regional-scale variations in N loss fractions, fluxes or forms; rather it envisaged the natural terrestrial environment as a single vec-tor.
pathways and the forms of gaseous N produced via denitrifi-cation (Fig. 2). The isotope model differs substantially from traditional techniques in that it does not explicitly consider controls such as climate, carbon, or N cycling rates; rather, total ecosystem15N/14N ratios in each grid-cell integrate all such controls on N loss pathways (e.g. Hadley et al. 1999; Amundson et al., 2003; Houlton et al., 2006; Houlton and Bai 2009). Thus, we generate empirically centered constraints on the flux, form and uncertainty in N losses, against which tra-ditional process-based models (for example, Bai and Houlton 2009) and satellite data can be independently examined (see Fig. 2).
2 Materials and methods
Our approach involves three phases (Fig. 2). First, we use previously published estimates of N fixation (Wang and Houlton, 2009) and N deposition (Lelieveld and Dentener, 2000) to force the total mass of N outputs at the global scale. Second, we use estimates of the N isotope composi-tion of soil to constrain the proporcomposi-tion of N lost to denitrifi-cation vs. leaching paths across different terrestrial ecosys-tems. Third, we use a simple model to further partition den-itrification gases into N gas fates, including NO, N2O and N2. In the case of NO, we compare the modelled results to satellite-based estimates of NO2 emissions over the conti-nent of Africa. Finally, we analyze the sensitivities of our estimated N gaseous fluxes to key model parameters and the uncertainty of global denitrification using Monte Carlo sim-ulation.
The spatial resolution is 0.5◦×0.5◦ for both the isotope fractionation model and gas partitioning model. All input data were regridded to 0.5◦×0.5◦for the simulations in this study. Using the steady-state assumption, we first estimate the total N loss at 0.5◦×0.5◦spatial resolution globally from the N inputs of deposition and fixations, then partition the N loss between leaching and total gaseous loss using the iso-tope fractionation model. We further estimate the fractions of different N gaseous losses (NO2, NO, N2O and N2)using a N gas partitioning model that uses mean monthly volumet-ric soil water content at the top 1m from 1948 to 2006 (see data sets below).
2.1 Nitrogen isotope model
N isotope ratios are presented in delta notation:
δ= [(Rsample−RSTD)/RSTD] ×103 (1)
whereRsampleis the15N/14N ratio of the sample andRSTDis the15N/14N ratio of the atmospheric dinitrogen.
Our N isotope model is based on the conceptual model of controls on whole-ecosystem15N/14N (Houlton et al., 2006). Although plant uptake can discriminate against15N when N is abundant (Evans, 2001), the expression of this isotope ef-fect is not observed in many natural sites where N is scarce
(Houlton et al., 2007). More likely are isotope effects owing to mycorrhizal symbionts, which can deliver low 15N/14N compounds to hosts, potentially causing leaves to have a lowerδ15N than the soils on which plants rely (Hobbie and Hobbie, 2006; Craine et al., 2009). Nevertheless, regardless of any such isotope effect, plant and associated root sym-bionts return N to the soil with the same weightedδ15N as that of N uptake as these systems approach the steady state. Therefore, under steady-state conditions, internal N cycling processes (plant uptake and microbial uptake) do not influ-ence bulk soil15N/14N ratios because they are recycling N as opposed to affecting overall N balances (Bai and Houl-ton, 2009; Brenner et al., 2001; Houlton et al., 2006). This lack of internal N cycle control on15N/14N has been proven mathematically (Brenner et al., 2001; Amundson et al., 2003; Houlton et al., 2006; Bai and Houlton, 2009) and is supported by empirical observations across a broad range of climatic and ecosystems conditions (Bai and Houlton, 2009; Houlton et al., 2006; Houlton and Bai, 2009). Although further in-quiry into potential plant and microbial recycling effects on ecosystem15N/14N would be useful in general (see discus-sion), we here apply the steady-state assumption as a first approximation, consistent with other global biogeochemical modelling efforts (Potter et al., 1996; Bouwman et al., 2005a; Mayorga et al., 2010; Howarth et al., 1996). Thus, we fo-cus on N inputs that occur via deposition and fixation and losses from soil along gaseous (ammonia-volatilization, ni-trification, denitrification) (fgas all) and leaching pathways (fleaching). Hence, we derive the following set of equations:
δ15Nsoil=δ15NI+εgas all×fgas all+εL×fleaching (2)
fgas all+fleaching=1 (3)
whereδ15Nsoilis the isotopic composition of bulk soil;δ15NI is that of atmospheric inputs; and εL and εgas all are the enrichment factors for leaching and gaseous losses, respec-tively [ε(‰) = (14k/15k – 1)·1000], wherekis a rate con-stant.
Gaseous loss pathways include nitrification/denitrification processes and ammonia volatilization. In our model, denitri-fication includes both denitridenitri-fication and nitrifier denitrifica-tion, since these bacterial groups fractionate N isotopes sim-ilarly (Sutka et al., 2006). From this point forward, “N gas” refers to collective denitrification; we account for the mag-nitude and isotopic impact of ammonia volatilization using results from previous models. We further partitionedfgasall tofgasandfNH3:
εgas all×fgas all=εG×fgas+εNH3×fNH3; (4)
fgas+fNH3=fgas all. (5)
From (2), (3), (4), and (5) one gets
fgas=
δ15Nsoil−δ15NI−(εNH3−εL)×fNH3−εL
εG−εL
Symbiotic N fixation
Asymbiotic N fixation
N Deposition
Soil N isotope model
N Input
Gaseous N losses
Hydrologic N losses
N gas submodel
NO N2O N2
NH3
volatilization
N Output
Fig. 2.Model structure.
The N inputs to natural ecosystems via fixation and depo-sition have relatively low15N/14N ratios that do not appear to vary substantially from system to system. N2fixation, for example, does not appear to fractionate N2 in air; itsδ15N is close to 0 ‰ (Boddey et al., 2000; Yoneyama et al., 1986; Shearer and Kohl, 1986). In addition, the isotopic compo-sition of deposited N is typically in the range of –3 ‰ to 3 ‰ (Buzek et al., 1998; Handley et al., 1999; Freyer et al., 1996; Houlton et al., 2006), with bulk nitrate deposition across various latitudes, altitudes, climates and biomes aver-agingδ15N of –1.5 ‰ (Houlton and Bai, 2009). While am-monium and dissolved organic N compounds can also be de-posited, their15N/14N ratios either overlap with or are some-what15N-depleted relative to that of nitrate in bulk precipita-tion (Cornell et al., 1995; Heaton et al., 1997; Houlton et al., 2006). Combining both fixation and deposition inputs,δ15NI is thus in the range of –1.5 ‰ to 0‰, in accord with previ-ous syntheses (i.e. –2 ‰ to 1‰; Handley et al., 1999). We do not consider rock N inputs, though this may be an important term for future N isotopic modelling efforts (Morford et al., 2011).
Although N leaching pathways could remove low δ15N compounds from soil (εL)in principle, empirical data
sug-gest that the discrimination is small. Shi(1992) found the fractionation factor of losses by dissolved NH+4-N was 0 ‰ to 0.5‰. Feuerstein et al. (1997) reported thatδ15N of DON was 1–2 ‰ lower than coexisting particulate organic
matter in surface water of the Great Lakes. Densmore et al. (2000) noted the difference betweenδ15N of soil total N andδ15N of leachable N was within 1 ‰ at Irwine and Bicy-cle basins in California. Houlton et al. (2006) found that the difference between theδ15N stream total dissolved N and soil total N was no more than 1–2 ‰ across a suite of Hawaiian forests. Finally, Houlton and Bai (2009) found that theδ15N of nitrate in small drainage streams was very close to that of soil particulate matter from Arctic to tropical biomes, with an integratedεLequal to 0.85‰. This latter analysis pointed to
uniformly small isotope effect expression of nitrification at the scale of entire ecosystems. Thus, we use a15N discrimi-nation of 1 ‰ forεLin our model parameterization scheme,
and 0–5 ‰ in our model uncertainty analysis (see below). Gaseous N losses substantially discriminate against15N along three major paths – denitrification, nitrification, and ammonia volatilization. Isotope fractionation during am-monia volatilization is high (εNH3, 29 ‰ based on Hog-berg (1997)) and has been shown to elevate the δ15N of heavily grazed terrestrial ecosystems; however, ammonia volatilization from soils under natural vegetation accounts for a small fraction of N losses, less than 5 % of total gaseous losses (Bouwman et al., 1997). Consequently, this process plays a minor role in elevatingδ15Nsoilglobally. By contrast, bacterial pathways of gaseous N removal lead to significant 15N enrichments – and with a flux that is large enough to substantially elevate theδ15N of soil above atmospheric N inputs. Indeed, the average isotope effect of denitrification on nitrate is substantial in both pure culture (∼20‰) (Well-man et al., 1968) and in natural soil communities (∼16‰) (Houlton and Bai, 2009). Consistent with empirical studies, we assume that nitrifier and denitrifier gases impart simi-lar fractionations of N isotopes (Yoshida, 1988; Jinuntuya-Nortman et al., 2008), and we use a combined enrichment factor (εG)to represent the isotope effect of both processes
on terrestrial15N/14N. We use anεG of 16 ‰ in our model
parameterization, allowing it to vary between 16–20 ‰ in our model uncertainty analysis (see below). We did not account for further (i.e. values below 16‰) isotopic underexpression of denitrification, as this seems to be an important factor at very high rainfall levels (e.g. MAP>4 m), regimes that con-stitute a very small (<1 %) area of global land environment (Bai and Houlton, 2009).
approximates shifts in δ15N across temperate vs. tropical biomes to within∼1 or 2 ‰ of empirical observations (Houl-ton and Bai, 2009). Thus, we use this model to integrate soil
δ15N across ecosystems, realizing that it may slightly un-derestimate the actual magnitude of terrestrial15N enrich-ment, pointing to the conservative nature of our isotopic ap-proach overall. It should be noticed that above equations rep-resent long-term equilibrium values rather than short-term (<decade) responses and our model is the integration of all isotopic-fractionating emissions over the course of ecosys-tem development (a few decades to centuries).
2.2 N deposition and N fixation
When the isotope model is coupled with N input models,fgas can be converted to fluxes at steady state:
Ngas=(Nfixation+Ndeposition)×fgas. (7) Global symbiotic N2fixation (1×1◦) is generated from the CASACNP model (Wang et al., 2007; Houlton et al., 2008; Wang and Houlton, 2009; Wang et al., 2010). Asymbiotic N2fixation is based on the biome average reported in Cleve-land et al. (1999) and the global biome classification in CASACNP (Wang et al., 2007; Wang et al., 2010). Global N deposition (5◦×3.75◦) is generated from a three di-mensional chemistry-transport model run in the early 1990s (Lelieveld and Dentener, 2000). The total global N input to natural ecosystems is equal to 129 Tg N yr−1 in our model analysis. Global ammonia volatilization fluxes for natural soils are based on the biome averages as reported in Bouw-man et al. (1997).
2.3 N gas production submodel
We use an index of water-filled pore space (WFPS, %) to rep-resent the “holes” in the conceptual N flux pipe (Davidson, 1991), simulating the effects of O2availability on gaseous N emissions. Nitrification and nitrifier-denitrification are the main N gas producing processes when WFPS is low and denitrification increases in importance when WFPS is more than 60 % (Bateman and Baggs, 2005). When WFPS exceeds 80 %, N2 becomes the major gaseous N form (Davidson, 1991). Based on empirical findings (Bateman and Baggs, 2005) and previous modelling of the relationship between WFPS of soil and relative fluxes of N gases (Davidson, 1991; Potter et al., 1996), we use an index of WFPS to develop our “gas partitioning curve” (Fig. 3).
After Potter et al. (1996), the index of WFPS is unitless and is estimated by
WFPS=(E+FC)/PS E>0 (8a)
WFPS=W/PS E=0 (8b)
where FC is soil field capacity (m m−1); PS is soil pore space capacity (m m−1); W is monthly mean soil water content
(m m−1); and E is excess moisture input (i.e. monthly runoff) (m m−1). Where WFPS exceeds 100 %, 100 % is used in the modelling.
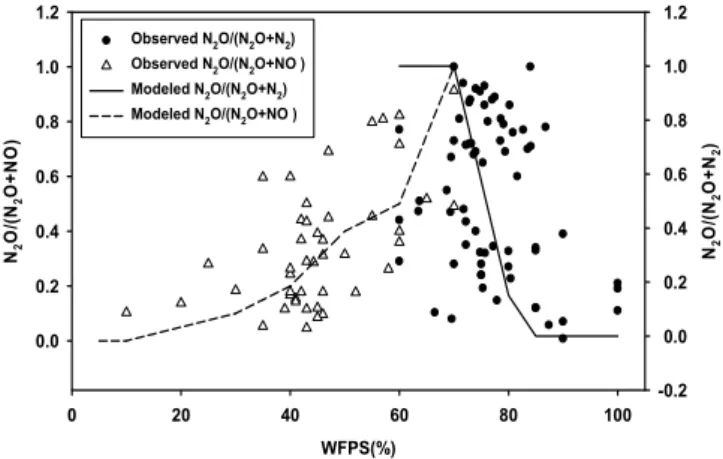
We compiled observations of N2O/(NO + N2O) and N2O/(N2O + N2) as a function of water-filled pore space (WFPS) from various lab and field studies (Supplement Ta-ble 1) in order to validate our N gas submodel (Fig. 4). Agreement between modelled and observed ratios is mea-sured using root-mean-squared error (RMSE):
RMSE= v u u t 1
N
N
X
i=1
(Mi−Oi)2 (9)
whereMIis modelled N2O/(NO + N2O) or N2O/(N2O + N2) ratio, OI is the corresponding observed ratio, and N is the total number of observations. RMSE is equal to 0.20 for N2O/(NO+N2O) ratios (n=46) and 0.42 for N2O/(N2O+N2)ratios (n=69). When WFPS is low, NO is the major form of gaseous N loss; at higher WFPS, more N2O is produced; when WFPS >70 %, due to increasing anaerobic conditions, N2 production increases rapidly and becomes the dominate form of gaseous N (Fig. 4). We used the coefficient of variation (CV) of the global total denitrifi-cation flux to calculate the modelled range (mean±CV) of each gas form (see above).
2.4 Seasonal variations of NO in Africa
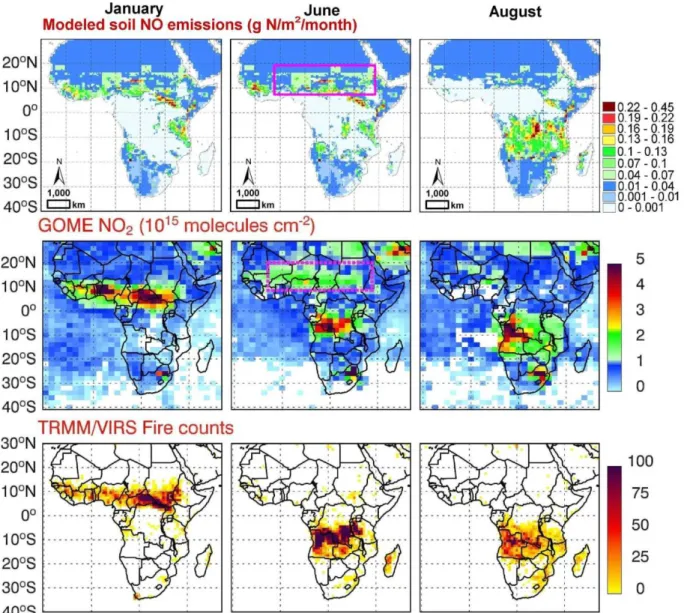
Seasonal variations of NO in Africa were estimated using our model and GOMES satellite observations (Jaegle et al., 2004). Mean annual total N gaseous fluxes were first ap-portioned equally to each month, and then partitioned to NO, N2O and N2fluxes based on monthly mean WFPS (see above). Modelled NO in January, June, and August (Fig. 5a) reflects the recent 50-yr-mean (1948-2008) monthly varia-tions in WFPS.
2.5 Data sets
After Amundson et al. (2003), we estimate soilδ15N by ap-plying multiple regression models to climate data:
δ15Nsoil=0.2048×MAT−0.0012×MAP+4.32. (10)
The model is based on empirical relationships observed across various climosequences, spanning different biomes and climatic conditions. Mean annual temperature (MAT) and precipitation (MAP) data (0.5◦×0.5◦) are from Will-mott and Matsuura (2000). The global unfertilized surface (0.1◦×0.1◦) is based on the biome classification scheme of VUB and VITO, derived from a full year cycle (1998–1999) of 10-daily composites of SPOT-VEGETATION (www. geosuccess.net/Geosuccess). Areas classified as croplands, urban and build-up, and cropland and natural vegetation mo-saic, are considered as cultivated and urban land.
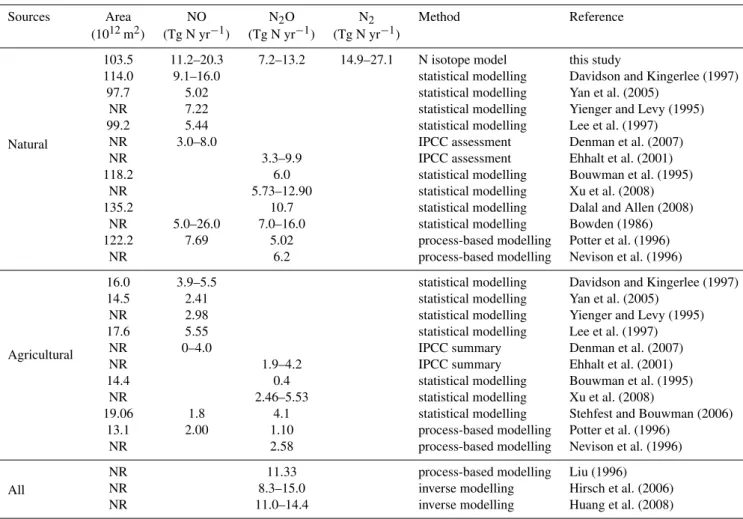
Table 1.Comparison of global estimations of N gas productions by N isotope model with previously published empirical and modelling studies (NO fluxes are soil-surface emissions without canopy effects).
Sources Area NO N2O N2 Method Reference
(1012m2) (Tg N yr−1) (Tg N yr−1) (Tg N yr−1)
Natural
103.5 11.2–20.3 7.2–13.2 14.9–27.1 N isotope model this study
114.0 9.1–16.0 statistical modelling Davidson and Kingerlee (1997)
97.7 5.02 statistical modelling Yan et al. (2005)
NR 7.22 statistical modelling Yienger and Levy (1995)
99.2 5.44 statistical modelling Lee et al. (1997)
NR 3.0–8.0 IPCC assessment Denman et al. (2007)
NR 3.3–9.9 IPCC assessment Ehhalt et al. (2001)
118.2 6.0 statistical modelling Bouwman et al. (1995)
NR 5.73–12.90 statistical modelling Xu et al. (2008)
135.2 10.7 statistical modelling Dalal and Allen (2008)
NR 5.0–26.0 7.0–16.0 statistical modelling Bowden (1986)
122.2 7.69 5.02 process-based modelling Potter et al. (1996)
NR 6.2 process-based modelling Nevison et al. (1996)
Agricultural
16.0 3.9–5.5 statistical modelling Davidson and Kingerlee (1997)
14.5 2.41 statistical modelling Yan et al. (2005)
NR 2.98 statistical modelling Yienger and Levy (1995)
17.6 5.55 statistical modelling Lee et al. (1997)
NR 0–4.0 IPCC summary Denman et al. (2007)
NR 1.9–4.2 IPCC summary Ehhalt et al. (2001)
14.4 0.4 statistical modelling Bouwman et al. (1995)
NR 2.46–5.53 statistical modelling Xu et al. (2008)
19.06 1.8 4.1 statistical modelling Stehfest and Bouwman (2006)
13.1 2.00 1.10 process-based modelling Potter et al. (1996)
NR 2.58 process-based modelling Nevison et al. (1996)
All
NR 11.33 process-based modelling Liu (1996)
NR 8.3–15.0 inverse modelling Hirsch et al. (2006)
NR 11.0–14.4 inverse modelling Huang et al. (2008)
NR: Not reported
year 1948 to the present, based on a one-layer “tipping-bucket” model (Mintz and Serafini, 1981; Huang et al., 1996) that uses the spatially explicit estimates of soil properties based on IGBP soil texture attributes. Global soil field ca-pacity (FC) and soil texture data are from Webb et al. (2000) (1◦×1◦). Soil pore space capacity (PS) is computed from IGBP soil texture (see Eq. 7 in Saxton et al. (1986)).
2.6 Sensitivity and uncertainty analyses
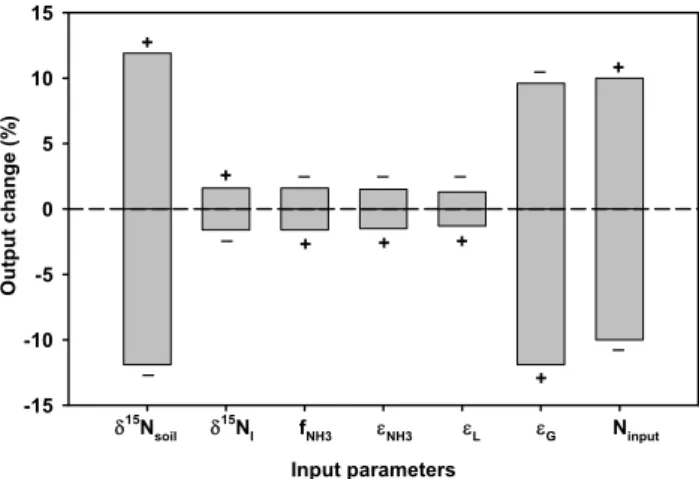
Sensitivity analyses are conducted by evaluating the response in global denitrification fluxes resulting from changes in model input parameters at a level of ±10 %. Results of this analysis indicate a sensitivity range from 1.3 to 11.9 % (Fig. 6). Global denitrification is most sensitive to soilδ15N (δ15Nsoil)and the effective isotope effect of denitrification (εG): a +10 % increase in either δ15Nsoil or εG results in
+11.9 % or –11.9 % variation in denitrification, respectively. A 10 % increase in the N input flux (Ninput)corresponds to
a 10 % increase in N outputs as implied by our steady- state
WFPS (%)
0 10 20 30 40 50 60 70 80 90 100
Fraction of N gas emission
0.0 0.2 0.4 0.6 0.8 1.0 1.2
NO
N2O
N2
974
Fig. 3.Model of N gas production as a function of WFPS (water-filled pore space, %). The solid line represents NO; short dashed
WFPS(%)
0 20 40 60 80 100
N2 O/ (N 2 O+ NO ) 0.0 0.2 0.4 0.6 0.8 1.0 1.2 N2 O/ (N 2 O+ N2 ) -0.2 0.0 0.2 0.4 0.6 0.8 1.0 1.2 Observed N2O/(N2O+N2)
Observed N2O/(N2O+NO ) Modeled N2O/(N2O+N2) Modeled N2O/(N2O+NO )
976 977
Fig. 4.Comparison of the ratios of N2O-N/(N2O-N + NO-N) and
N2O-N/(N2O-N + N2-N) from field measurements (points) with
ra-tios predicted by the gas partitioning model (lines). Additional in-formation on the field measurements is presented in Supplement Table 1.
assumption. Therefore, additional constraints onδ15Nsoiland
εGwould most improve the model’s accuracy.
We used Monte Carlo methodology to estimate uncertain-ties in global denitrification. Assuming that the errors in
δ15Nsoil, δ15NI, fNH3, and Ninput are normally distributed with a coefficient of variation of 50 %, and the errors of N isotope enrichment factors are uniformly distributed within the range of 25–35 ‰ for εNH3, 16–20 ‰ for εG, and 0–
5 ‰ forεL, we randomly sampled 10 000 sets of these seven
parameters from the prescribed probability distributions to estimate the mean and uncertainty of denitrification for each grid cell at 0.5◦×0.5◦resolution.
The mean global denitrification rate (µT)was calculated
as the sum of the means of all grid cells. For the uncer-tainty, we considered spatial correlations of errors among adjacent grid cells. We first performed variogram analysis (Isaaks and Srivastava, 1989), which indicated that gaseous emissions were correlated within a range distance of 84 cells (ca. 4662 km). Based on this correlogram, we then estimated a correlation coefficient between two grid cells (cell (i, j) and cell (k, l)) (ρij,kl):
ρij,kl=1−
γ (h)
VAR (11)
whereγ(h) is the semi-variogram of the two grid cells with a distance ofh, and VAR is the total variance of all grid cells. We used an exponential model to describe the variation of
γ(h) withh. That is
γ (h)=Co+Cs×(1−e−(3h/a)) (12)
whereCois the nugget (= 0.10 for our data),Csis the partial sill (= 0.36 for our data), anda is the range (= 42 decimal degree for our data) of the variogram model.
The standard deviation of the mean global denitrification rate (i.e. σT)was calculated as
σT2=
N X i=1 M X j=1 N X k=1 M X l=1
σij×σkl×ρij,kl (13)
wherei,k,j, andl refer to row and column numbers of the global grid cells;N andMrefer to total latitudinal and lon-gitudinal cells, respectively.
The uncertainty in the global denitrification rate is ex-pressed as the coefficient of variation (i.e.σT/µT), and the
range is expressed at the 68 % confidence interval (i.e. [µT−
σT,µT+σT]).
3 Results
3.1 N loss pathways
Our model indicates that 35 % of all N inputs to the natu-ral unfertilized land biosphere is lost to denitrification each year. This agrees with results from Houlton and Bai (2009), in which the N isotope composition of the entire natural land biosphere suggested that about 1/3 of N deposition and fix-ation are lost back to the atmosphere via soil denitrificfix-ation pathways. It is also reasonably consistent with the estimate of Seitzinger et al. (2006) of 44 % , which is based on numerical simulation models. Thus, our spatially explicit analysis using N stable isotope constraints on the global N budget points to a substantial role for denitrification gases in removing N from unfertilized land, helping to close the overall global N budget.
Perhaps more important, across the terrestrial biosphere,
fgas varies substantially. Specifically, our analysis suggests that gaseous N losses vary from 0 % to 69 % of total natu-ral N inputs across temperate vs. tropical latitudes (Fig. 7a). The highest gas loss fractions are associated with desert sites, where precipitation≪potential evapotranspiration and hy-drologic leaching is minimal. Although the absolute fluxes in these areas may be low due to low N inputs, gaseous N efflux is estimated to be high relative to leaching, consis-tent with previous analyses (Galbally et al., 2008; Hartley and Schlesinger, 2000). In contrast,fgasdecreases at higher latitudes, where limited quantities of nitrate, low NPP, and low temperatures (T) constrain denitrification for most of the year. In these environments, leaching (fleaching)is the dom-inate vector of N loss. Globally, we estimate that 65 % of total N losses occur via leaching, consistent with previous estimates (i.e. 72 %) for unfertilized terrestrial ecosystems (Bouwman et al., 2005b).
979
Fig. 5.Comparison of modelled soil NO emissions (g N m−2month−1)(a)with space-based observations of NO2column concentrations
(1015molecules cm−2)as reported in Jaegle et al. (2004)(b)and fire counts(c)as observed by the visible and infrared scanner on board the
TRMM satellite (Jaegle et al., 2004) over Africa for January, June and August, 2000. The pink rectangle shows the area with unexpectedly
high level of NO2(b)during June, which was not caused by fire or industrial emissions based on the fire count map(c); rather, soil microbial
NOxpulses following the onset of rainfall over vast areas of dry soil, a notion confirmed by our model simulations(a).
Asia, where the combination of warm temperatures, moist soil conditions, and high N availability favours high rates of soil microbial activity (Fig. 7b). This agrees with previous work pointing to high potential for denitrification in moist tropical sites (Potter et al., 1996; Galloway et al., 2004). Monte Carlo analysis reveals a coefficient of variation (CV) of 29 % on our estimates for global natural denitrification fluxes.
In terms of dissolved pathways of N loss, we estimate that 85.7±24.8 Tg of dissolved N compounds leach through the plant rooting zone in unfertilized areas annually. Southern United States, northern South America, central Africa, and southern Asia display the largest leaching fluxes due to a
Input parameters
Output change
(%
)
-15 -10 -5 0 5 10 15
δ15
Nsoil δ
15
NI fNH3 εNH3 εL εG Ninput
+
_ _ _
_
_ _
_ +
+ + +
+ +
Fig. 6.Sensitivity of denitrification to different input parameters. “+” and “-” represent a 10 % increase and 10 % decrease in the input parameter, respectively.
of the coastal ecosystems and contributes to coastal hypoxia and anoxia.
3.2 Gaseous N forms
Our model integrates multiple data sets and several submod-els, which is common for global-scale biogeochemical cy-cles due to large spatial and temporal integration (Charria et al., 2008; Schaldac and Pries, 2008; Thornton et al., 2009). Uncertainty in our model includes both model assumptions and model input parameters. In particular, we assume ecosys-tem isotope balance, whereby internal N cycling processes – plant uptake, microbial uptake – do not influence bulk soil 15N/14N ratios (Amundson et al., 2003; Houlton et al., 2006; Bai and Houlton, 2009). This assumption seems to be valid at the scale of decades to centuries for most natural sites (Amundson et al., 2003); modern rates of N accumulation would have at most changed soil N pools<0.1 % over the past 100 years, implying negligible N accumulation effects on our isotopic calculations (Houlton and Bai, 2009). The steady-state assumption may be less valid in sites where rel-atively frequent and hot fires can lead to transient imbalances in N – especially on short time scales (Aranibar et al., 2003) (see below on importance of fire in N losses). Moreover, we use an empirically derived model to estimate soilδ15N across global ecosystems and this imparts errors in our assessment ofδ15N, especially at sub-grid scales. This is an important area for future work – more data on theδ15N of soil across ecosystems. Nevertheless, we note that the approach we used to estimate soilδ15N is able to capture shifts across temper-ate to tropical biomes, typically within about 1 ‰ of actual measurements (Houlton and Bai, 2009).
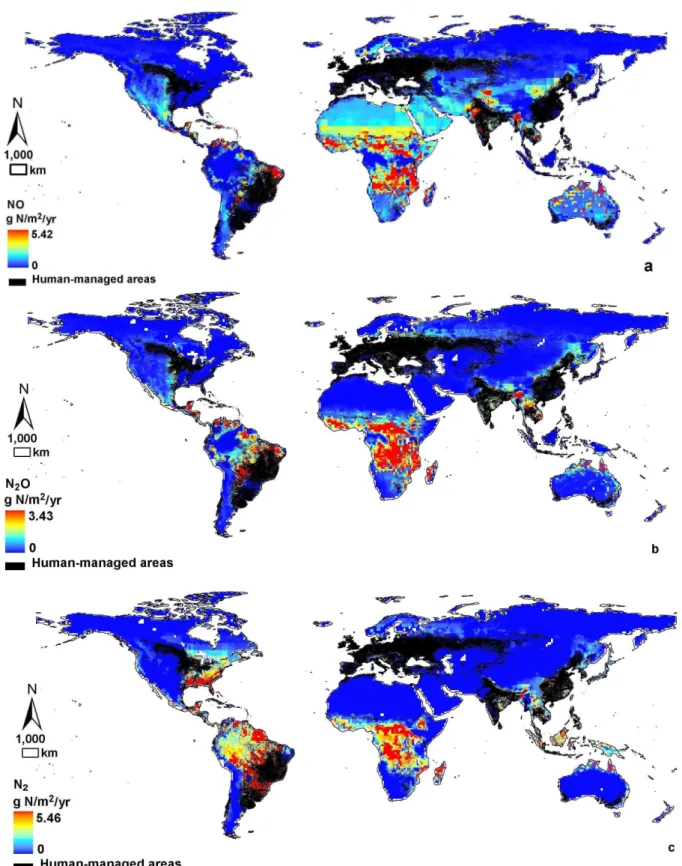
We estimate that, on average, 0.152±0.044 g N m−2yr−1 are lost to microbial NO production in the natural terrestrial soil (Table 1, Fig. 8a). Globally, the geographic area that is free from agriculture and major land cover
transforma-tion is equal to 103.5 1012m2 (based on VUB and VITO). Applying this area to our NO production rates, we calcu-late that 11.2–20.3 Tg N yr−1 are emitted as NO from un-fertilized land globally. This estimate is significantly higher than natural NO emissions (3–8 Tg N yr−1)as summarized in the Inter-governmental Panel on Climate Change’s (IPCC) fourth assessment report (AR4) (Denman et al., 2007). Com-bining our estimate of natural NO emissions with that of cropland and managed grassland (Stehfest and Bouwman, 2006) (i.e. 1.8 Tg N yr−1), we calculate a total NO flux of 13.0–22.1 Tg N yr−1 for the entire terrestrial biosphere (i.e. fertilized plus unfertilized). This falls between those of most process (Potter et al., 1996) (9.7 Tg N yr−1) and empirically based models (Davidson and Kingerlee, 1997) (21.1 Tg N yr−1) (Table 1), but is higher than some esti-mates reported in the literature (5–8 Tg N yr−1)(Yan et al., 2005;Yienger and Levy, 1995; Lee et al., 1997) (Table 1).
Regionally, highest NO emissions are simulated for mesic to dry tropical environments (Fig. 8a). Among the conti-nents, Africa emerges as the largest source for NO in the natural terrestrial biosphere (0.213–0.657 g N m−2yr−1, Ta-ble 2). Our model simulates high NO emissions in tropical savanna/woodland environments (0.267–0.711 g N m−2yr−1 Table 2), while tundra falls at the low end of the world-wide NO spectrum (0–0.007 g N m−2yr−1 Table 2). Nitric oxide fluxes vary from 0.023–0.055 g N m−2yr−1 for tem-perate forest sites, in agreement with empirical data (Supple-ment Table 2). In global grasslands, we estimate microbial NO emissions between 0.101–0.179 g N m−2yr−1, or near the upper bound of previously published data (Supplement Table 2).
984
986
Table 2.Modelled results of regional N gas fluxes from soil denitrification.
Region Area (1012m2) Modelled N gas flux (g N m
−2yr−1)
NO N2O N2
Closed tropical forest 9.0 0.099–0.229 0.180–0.418 0.602–1.396
Tropical rainforests 9.2 0.095–0.217 0.176–0.400 0.610–1.390
Tropical savanna/woodland 17.6 0.267–0.711 0.150–0.398 0.210–0.560
Brazilian Amazon forest 5.5 0.067–0.285 0.129–0.553 0.406–1.734
Grassland/steppe 22.3 0.101–0.179 0.037–0.065 0.028–0.050
Temperate/boreal forest 21.1 0.023–0.055 0.029–0.069 0.104–0.244
Deserts and semi-deserts 16.2 0.120–0.266 0.003–0.007 0.001–0.003
Chihuahuan Desert 0.005 0.020–0.323 0.003–0.049 0.000
Tundra 10.7 0.000–0.007 0.000–0.007 0.000–0.010
Africa (18◦N–30◦S) 16.0 0.213–0.657 0.165–0.507 0.239–0.737
European forest 3.0 0.026–0.118 0.042–0.184 0.038–0.162
United States 5.33 0.023–0.119 0.008–0.044 0.106–0.544
For N2O, we estimate that 7.2–13.2 Tg N yr−1of this po-tent greenhouse gas are emitted from natural soil microbes worldwide (Table 1, Fig. 8b). Bouwman et al. (1995) esti-mated 6.8 Tg N yr−1 global pre-agricultural N
2O emissions based on a simple empirical model, while the IPCC adopted value of 3.3–9.9 Tg N yr−1 N2O emissions from soils un-der natural vegetations in their 2001 report (Ehhalt et al., 2001). When our results are combined with the N2O ef-flux associated with fertilized cropland and managed grass-land (4.1 Tg N yr−1)(Stehfest and Bouwman, 2006), we es-timate a natural soil sourced global N2O flux between 11.3– 17.3 Tg N yr−1. Diverse global estimates of N2O are avail-able via process-based, statistical, or inverse models; they (Huang et al., 2008; Nevison et al., 1996; Ehhalt et al., 2001; Bouwman et al., 1995; Xu et al., 2008; Dalal and Allen, 2008; Bowden, 1986; Potter et al., 1996; Liu, 1996; Hirsch et al., 2006) generally vary from 10.6 Tg N yr−1 to 15 Tg N yr−1 (Table 1). Our isotope-based model indepen-dently confirms this range of estimates of global N2O fluxes from natural soils.
Across the terrestrial biosphere, our model identifies moist tropical areas, such as the east Amazon Basin, cen-tral Africa, and northern Auscen-tralia, as natural hotspots of bacterial N2O production (Fig. 8b). Specifically, we esti-mate that natural tropical rainforest and savanna biomes account for 77 % of global natural N2O emissions. Trop-ical rainforests have the highest potential for N2O pro-duction (0.176–0.400 g N m−2yr−1Table 2), whereas, sim-ilar to NO, tundra has the lowest (0–0.007 g N m−2yr−1 Table 2). Previous models have reported a mean range of 0.12–0.29 g N m−2yr−1 for N2O emissions from trop-ical forests (Matson and Vitousek, 1990; Bowden, 1986; Dalal and Allen, 2008; Potter et al., 1996) and a mean range of 0.022–0.068 g N m−2yr−1 N
2O emissions from temperate forests (Dalal and Allen, 2008; Stehfest and Bouwman, 2006). Our results fall within this range –
ex-cept for tropical savanna where we estimate higher N2O fluxes (0.150–0.398 g N m−2yr−1) than empirically (Dalal and Allen, 2008) and process-based (Potter et al., 1996) models. Our model may overestimate this flux, because fire-caused N losses are not considered. For example, Olivier et al. (1998) estimated that 4.8 Tg N yr−1 are removed by sa-vanna fires, or approximately 62 % of total fire-induced N gas emissions in the terrestrial biosphere. Globally, fire removes a modest amount of N (7.7 Tg N yr−1),∼5.8 % of total N in-puts (Olivier et al., 1998).
Finally, to our knowledge, we here provide the first-ever simulations of the global spatial pattern of natural soil N2 emissions, widely believed to be the dominant biogenic form of gaseous N on Earth. We estimate that 14.9–27.1 Tg N yr−1 are denitrified to atmospheric N2in the unfertilized soil. Ac-cording to our model, soil N2originates mainly in southeast North America, north South America, central Africa, and Southeast Asia (Fig. 8c); anaerobic environments caused by high precipitation and poor soil drainage in these areas favour N2production (Galloway et al., 2004). In contrast, dry and low N throughput environments have uniformly low N2 pro-duction potentials (Fig. 8c).
N2O-N/(N2O + N2)-N ratios are generally low and extremely variable. For example, Wolf and Brumme (2003) reported N2O-N/(N2O + N2)-N ratios ranging between 0.19 to 0.85 in beech forest with different mineral soils; Merrill and Zak (1992) found much higher values (0.63–0.98) in upland for-est in Michigan and a N2O-N/(N2O + N2)-N ratio of 0.25 under swampy forest conditions. Dannenmann et al. (2008) observed a N2O-N/(N2O + N2)-N ratio of 0.23 when wa-ter holding capacity (WHC) was 48–55 %, while the ratio dropped to 0.03 when WHC was 62–84 %.
4 Discussion
Our results point to tropical ecosystems as the global N cy-cling hotspot within the natural land surface. This agrees with field-based evidence (Vitousek, 1984;Hedin et al., 2009) and implies a potential coupling between natural paths of fixation (Houlton et al., 2008) and denitrification within this biome, similar to those couplings observed for the global open ocean (Deutsch et al., 2007). Future studies on N2fixation and den-itrification (and their couplings) in tropical forests are criti-cal for understanding the integrated Earth-climate system – and the magnitude and direction of carbon (C) exchanges be-tween tropical biomes and the atmosphere.
Accurate partitioning of N losses along denitrification vs. leaching vectors is fundamental to understanding C and N couplings in the terrestrial biosphere. The response of N-limited ecosystem to increasing [CO2] depends partly on N loss responses to increasing [CO2] in the future. Losses of DON compounds are substrate-independent (Hedin et al., 2003) and therefore less likely to change with increasing [CO2] (Rastetter et al., 2005) than are N losses via nitrate leaching and denitrification that depends on available N sub-strates; denitrification in particular might be expected to de-crease in response to progressive N-limitation. Our study re-veals that leaching is a greater fraction of N losses (∼77 %) at high latitudes, in contrast to the tropics where denitrifica-tion (leaching = 58 %) contributes more to the N economy of natural ecosystems. These results agree with empirical stud-ies pointing to substantial DON losses from both boreal and unpolluted temperate forests and high denitrification rates in tropical sites (Seitzinger et al., 2006; Neff et al., 2003). We postulate that loss-driven N limitation will persist longer at high latitudes than other sectors of the terrestrial biosphere.
Global biogeochemical models have been used to study the change of nutrient limitation under future climate and higher [CO2] conditions (Sokolov et al., 2008; Thornton et al., 2009; Zaehle et al., 2010a), but the spatial pattern of N limitation and its response to increased warming and [CO2] is uncertain. For example, N limitation of tropical NPP is ex-pected in one model (Thornton et al., 2009), whereas another model suggests that temperate and boreal forests will exhibit more profound symptoms of progressive N limitation than tropical forests in the future (Zaehle et al., 2010b). Global
models of C and N cycles are poorly constrained (Wang et al., 2010); uncertainties in their predictions are expected to be high, but yet to be quantified. The spatially explicit estimates of N losses from this study can provide an important con-straint for benchmarking the performance of global biogeo-chemical models under present conditions. Additional work on the N isotope composition of natural ecosystems, cou-pled with examination for transient effects where appropri-ate, would not only advance our approach further, but would also be useful for ground-truthing global models.
Our isotope-based approach considers interactions be-tween soil microbial processes, climate and soil conditions over large spatial scales thereby providing a novel and in-dependent constraint against which empirically and process-based models and inverse chemical transport analyses can be evaluated. Our isotope-based approach points to high NO emissions in Africa and high N2 emissions in Southeast USA, areas where very few measurements have been made. Incorporating spatial and temporal complexities (so-called “hotspots and hot moments”) into the N cycle is consid-ered the biggest challenge in denitrification research (Groff-man et al., 2009). Previous studies have used models that were calibrated locally and extrapolated globally, introduc-ing unquantifiable uncertainties into estimates of denitrifica-tion. Episodic emissions of NO and N2O in the arid and semi-arid region are known to account for a significant fraction of total N loss (Hartley and Schlesinger, 2000), for example, and these losses are poorly simulated by most global models, whereas our model integrates all isotopic-fractionating emis-sions including episodic pulses of NO and N2O over a long period (>decade). The similarities between our modelled re-sults and satellite observations of NO2and newly identified hot spots of N emissions point to the power of our N isotope model at large scales.
Our modelled maps provide a reference for future studies. For example, our map (Fig. 8b) points to the Congo Basin in Africa as one of the dominant natural sources of N2O – a potent greenhouse gas (Fig. 1) and ozone-depleting agent (Ravishankara et al., 2009) – while there are almost no pub-lished data on N2O fluxes from this region. Most published data on N2O fluxes in the tropics are from South and Central American forests, with a few data from Southeast Asia and Northwest Australia. Thus, continued advancement on such issues as climate change and stratospheric ozone would seem to benefit from empirical investigations of the old-world trop-ics.
Our model can be improved with additional information, observations and experiments. In particular, knowledge on isotope fractionations via gaseous N losses is clearly war-ranted, since they can vary across different ecosystems and conditions; our sensitivity analyses (Fig. 6) indicate that our N loss fractions are most sensitive to variation inδ15N (δ15Nsoil)and the isotope effect of denitrification (εden). This points to the importance of a deeper understanding of isotope effect expression and additional measurements of soilδ15N. In addition, more information on the influence of soil proper-ties such as soil texture, soil water availability on N gas parti-tioning would increase the robustness of our model. Further, uncertainties in N2fixation models are difficult to assess and are probably high, although they are the best available mod-els at present; additional constraints on N inputs and climate and soil databases could help to reduce uncertainties in the model.
Finally, our estimates of N loss fractions have implications for a rapidly changing N cycle. Nitrogen deposition is on the rise and will continue to rise in the future, spreading rapidly into tropical ecosystems globally (Galloway et al., 2008). Our results suggest that N inputs into tropical environments and arid sites will disproportionately mobilize to atmospheric gases when compared to extra-tropical moist environments, particularly boreal and temperate forests. Rising levels of N deposition to tropical ecosystems could release more N2O from soils to the atmosphere (see also Matson et al. (1999)), warming the climate in a way that is fundamentally different than what has already been observed for N deposition effects at the higher latitudes.
Supplementary material related to this article is available online at: http://www.biogeosciences.net/9/ 3287/2012/bg-9-3287-2012-supplement.pdf.
Acknowledgements. Funded by the Andrew W. Mellon Foundation,
financial support from Key Program of the Chinese Academy of Sciences Project KZCX2-YW-BR-20 and NSFC Grant 31100326 to EB, and Department of Climate Change, Australia to YPW.
Edited by: R. Conant
References
Altabet, M. A., Francois, R., Murray, D. W., and Prell, W. L.: Climate-related variations in denitrification in the Arabian Sea
from sediment15N/14N ratios, Nature, 373, 506–509, 1995.
Amundson, R. and Baisden, W. T.: Stable isotope tracers and mod-els in soil organic matter studies, in: Methods in Ecosystem Sci-ence, edited by: Sala, O., Mooney, H., Howarth, B., and Jackson, R. B., Springer Verlag, New York, NY, 117–137, 2000.
Amundson, R., Austin, A. T., Schuur, E. A. G., Yoo, K., Matzek, V., Kendall, C., Uebersax, A., Brenner, D., and Bais-den, W. T.: Global patterns of the isotopic composition of soil and plant nitrogen, Global Biogeochem. Cy., 17, 1031, doi:1010.1029/2002GB001903, 2003.
Aranibar, J. N., Macko, S. A., Anderson, I. C., Potgieter, A. L. F., Sowry, R., and Shugart, H. H.: Nutrient cycling responses to fire frequency in the Kruger National Park (South Africa) as indicated by stable isotope analysis, Isotopes in Environmental Health Studies, 39, 141–158, 2003.
Bai, E. and Houlton, B. Z.: Coupled isotopic and process-based modeling of gaseous nitrogen losses from tropical rain forests, Global Biogeochem. Cy., 23, doi:10.1029/2008GB003361, 2009.
Bakwin, P. S., Wofsy, S. C., Fan, S.-M., Keller, M., Trumbore, S. E., and Da Costa, J. M.: Emission of nitric oxide (NO) from tropi-cal forest soils and exchange of NO between the forest canopy and atmospheric boundary layers, J. Geophys. Res., 95, 16755– 16764, 1990.
Bateman, E. J., and Baggs, E. M.: Contributions of nitrification and
denitrification to N2O emissions from soils at different
water-filled pore space, Biol. Fertil. Soils, 41, 379–388, 2005. Boddey, R. M., Peoples, M. B., Palmer, B., and Dart, P. J.: Use of the
15N natural abundance technique to quantify biological nitrogen
fixation by woody perennials, Nutr. Cycl. Agroecosyst., 57, 235– 270, 2000.
Bouwman, A. F., Van der Hoek, K. W., and Olivier, J. G. J.: Un-certainties in the global source distribution of nitrous oxide, J. Geophys. Res., 100, 2785–2800, 1995.
Bouwman, A. F., Lee, D. S., Asman, W. A. H., Dentener, F. J., Van Der Hoek, K. W., and Olivier, J. G. J.: A global high-resolution emission inventory for ammonia, Global Biogeochem. Cy., 11, 561–587, 1997.
Bouwman, A. F., Deecht, G. V., and Hoek, K. W. V. d.: Global and regional surface nitrogen balances in intensive agricultural pro-duction eystems for the period 1970–2030, Pedosphere, 15, 19, 2005a.
Bouwman, A. F., Van Drecht, G., Knoop, J. M., Beusen, A. H. W., and Meinardi, C. R.: Exploring changes in river nitro-gen export to the world’s oceans, Global Biogeochem. Cy., 19, doi:10.1029/2004GB002314, 2005b.
Bowden, W.: Gaseous nitrogen emissions from undisturbed terres-trial ecosystems: an assessment of their impacts on local and global nitrogen budgets, Biogeochemistry, 2, 249–279, 1986. Boyer, E. W., Alexander, R. B., Parton, W. J., Li, C.,
Butterbach-Bahl, K., Donner, S. D., Skaggs, R. W., and Del Grosso, S. J.: Modeling denitrification in terrestrial and aquatic ecosystems at regional scales, Ecol. Appl., 16, 2123–2142, 2006.
Brenner, D. L., Amundson, R., Baisden, W. T., Kendall, C., and
Harden, J.: Soil N and15N variation with time in a California
annual grassland ecosystem, Geochim. Cosmochim. Acta, 65, 4171–4186, 2001.
Butterbach-Bahl, K., Willibald, G., and Papen, H.: Soil core method
for direct simultaneous determination of N2and N2O emissions
from forest soils, Plant. Soil., 240, 105–116, 2002.
Charria, G., Dadou, I., Llido, J., Dr´evillon, M., and Garc¸on, V.: Importance of dissolved organic nitrogen in the north Atlantic Ocean in sustaining primary production: a 3-D modelling ap-proach, Biogeosciences, 5, 1437–1455, doi:10.5194/bg-5-1437-2008, 2008.
Cleveland, C. C., Townsend, A. R., Schimel, D. S., Fisher, H., Howarth, R. W., Hedin, L. O., Perakis, S. S., Latty, E. F., Von Fischer, J. C., Elseroad, A., and Wasson, M. F.: Global patterns
of terrestrial biological nitrogen (N2)fixation in natural
ecosys-tems, Global Biogeochem. Cy., 13, 623–645, 1999.
Cornell, S., Rendell, A., and Jickells, T.: Atmospheric inputs of dissolved organic nitrogen to the oceans, Nature, 376, 243–246, 1995.
Craine, J. M., Elmore, A. J., Aidar, M. P. M., Bustamante, M., Daw-son, T. E., Hobbie, E. A., Kahmen, A., Mack, M. C., McLauch-lan, K. K., Michelsen, A., Nardoto, G. B., Pardo, L. H., Penuelas, J., Reich, P. B., Schuur, E. A. G., Stock, W. D., Templer, P. H., Virginia, R. A., Welker, J. M., and Wright, I. J.: Global patterns of foliar nitrogen isotopes and their relationships with climate, mycorrhizal fungi, foliar nutrient concentrations, and nitrogen availability, New Phytol., 183, 980–992, 2009.
Dalal, R. C. and Allen, D. E.: Turner Review No. 18. Greenhouse gas fluxes from natural ecosystems, Aust. J. Bot., 56, 369–407, doi:10.1071/BT07128, 2008.
Dannenmann, M., Butterbach-Bahl, K., Gasche, R., Willibald, G.,
and Papen, H.: Dinitrogen emissions and the N2:N2O emission
ratio of a Rendzic Leptosol as influenced by pH and forest thin-ning, Soil Biol. Biochem., 40, 2317–2323, 2008.
Davidson, E. A.: Fluxes of nitrous oxide and nitric oxide from ter-restrial ecosystems, in: Microbial production and consumption of greenhouse gases: methane, nitrogen oxides, and halomethanes, edited by: Rogers, J. E., and Whitman, W. B., American Society for Microbiology, Washington, D.C., USA, 219–235, 1991. Davidson, E. A. and Kingerlee, W.: A global inventory of nitric
ox-ide emissions from soils, Nutr. Cycl. Agroecosyst., 48, 37–50, 1997.
Denman, K. L., Brasseur, G., Chidthaisong, A., Ciais, P., Cox, P. M., Dickinson, R. E., Hauglustaine, D., Heinze, C., Holland, E., Jacob, D., Lohmann, U., Ramachandran, S., Dias, P. L. d. S., Wofsy, S. C., and Zhang, X.: Couplings Between Changes in the Climate System and Biogeochemistry, in: Climate Change 2007: The Physical Science Basis. Contribution of Working Group I to the Fourth Assessment Report of the Intergovernmental Panel on Climate Change, edited by: Solomon, S., Qin, D., Manning, M., Chen, Z., Marquis, M., Averyt, K. B., M.Tignor, and Miller, H. L., Cambridge University Press, Cambridge, UK, 500–587, 2007.
Densmore, J. N., and B¨ohlke, J. K.: Use of nitrogen isotopes to determine sources of nitrate contamination in two desert basins in California, in: Interdisciplinary perspectives on drinking wa-ter risk assessment and management, edited by: Reichard, E. G., Hauchman, F. S., and Sancha, A. M., International Association of Hydrologic Sciences Publication Santiago, Chile, 63–73, 2000. Deutsch, C., Sarmiento, J. L., Sigman, D. M., Gruber, N., and
Dunne, J. P.: Spatial coupling of nitrogen inputs and losses in the ocean, Nature, 445, 163–167, 2007.
Devol, A. H., Uhlenhopp, A. G., Naqvi, S. W. A., Brandes, J. A., Jayakumar, D. A., Naik, H., Gaurin, S., Codispoti, L. A., and Yoshinari, T.: Denitrification rates and excess nitrogen gas
con-centrations in the Arabian Sea oxygen deficient zone, Deep Sea Res. Pt. I, 53, 1533–1547, 2006.
Dumont, E., Harrison, J. A., Kroeze, C., Bakker, E. J., and Seitzinger, S. P.: Global distribution and sources of dissolved inorganic nitrogen export to the coastal zone: Results from a spatially explicit, global model, Global Biogeochem. Cy., 19, doi:10.1029/2005gb002488, 2005.
Ehhalt, D., Prather, M., Dentener, F., Derwent, R., Dlugokencky, E., Holland, E., Isaksen, I., Katima, J., Kirchhoff, V., Matson, P., Midgley, P., Wang, M., Berntsen, T., Bey, I., Brasseur, G., Buja, L., Collins, W. J., Daniel, J., DeMore, W. B., Derek, N., Dickerson, R., Etheridge, D., Feichter, J., Fraser, P., Friedl, R., J. Fuglestvedt, M. G., L. Grenfell, A. Gr¨ubler, N. Harris,, D. Hauglustaine, L. H., C. Jackman, D. Jacob, L. Jaegl´e, A. Jain, M. Kanakidou, S. Karlsdottir,, M. Ko, M. K., M. Lawrence, J.A. Logan, M. Manning, D. Mauzerall, J. McConnell, L. Mickley,, S. Montzka, J. F. M., J. Olivier, K. Pickering, G. Pitari, G.J. Roelofs, H. Rogers, B. Rognerud, S. Smith,, S. Solomon, J. S., P. Steele, D. Stevenson, J. Sundet, A. Thompson, M. van Weele,, and R. von Kuhlmann, Y. W., D. Weisenstein, T. Wigley, O. Wild, D. Wuebbles, R. Yantosca: Atmospheric chemistry and greenhouse gases, in: IPCC Report 2001, edited by: Houghton, J. T., Ding, Y., Griggs, D. J., Noguer, M., Linden, P. J. v. d., Dai, X., Maskell, K., and Johnson, C. A., Cambridge University Press, Cambridge, UK, 241–280, 2001.
Evans, R. D.: Physiological mechanisms influencing plant nitrogen isotope composition, Trends Plant Sci., 6, 121–126, 2001. Fan, Y. and van den Dool, H.: Climate prediction center global
monthly soil moisture data set at 0.5◦ resolution for 1948
to present, J. Geophys. Res., 109, doi:10.1029/2003JD004345, 2004.
Feuerstein, T. P., Ostrom, P. H., and Ostrom, N. E.: Isotopic biogeo-chemistry of dissolved organic nitrogen: A new technique and application, Org. Geochem., 27, 363–370, 1997.
Freyer, H. D., Kobel, K., Delmas, R. J., Kley, D., and Legrand,
M. R.: First results of 15N/14N ratios in nitrate from alpine
and polar ice cores, Tellus B, 48, 93–105, doi:10.1034/j.1600-0889.1996.00009.x, 1996.
Galbally, I. E., Kirstine, W. V., Meyer, C. P., and Wang, Y. P.: Soil-atmosphere trace gas exchange in semiarid and arid zones, J. En-viron. Qual., 37, 599–607, doi:10.2134/jeq2006.0445, 2008. Galloway, J. N., Dentener, F. J., Capone, D. G., Boyer, E. W.,
Howarth, R. W., Seitzinger, S. P., Asner, G. P., Cleveland, C. C., Green, P. A., Holland, E. A., Karl, D. M., Michaels, A. F., Porter, J. H., Townsend, A. R., and V¨oosmarty, C. J.: Nitrogen cycles: past, present, and future, Biogeochemistry, 70, 153–226, 2004. Groffman, P., Butterbach-Bahl, K., Fulweiler, R., Gold, A., Morse,
J., Stander, E., Tague, C., Tonitto, C., and Vidon, P.: Challenges to incorporating spatially and temporally explicit phenomena (hotspots and hot moments) in denitrification models, Biogeo-chemistry, 93, 49–77, 2009.
Handley, L. L., Austin, A. T., Robinson, D., Scrimgeour, C. M., Raven, J. A., Heaton, T. H. E., Schmidt, S., and Stewart, G. R.:
The15N natural abundance (δ15N) of ecosystem samples reflects
measures of water availability, Aust. J. Plant Physiol., 26, 185– 199, 1999.
Heaton, T. H. E., Spiro, B., Madeline, S., and Robertson, C.: Po-tential canopy influences on the isotopic composition of nitrogen and sulphur in atmospheric deposition, Oecologia, 109, 600–607, 1997.
Hedin, L. O., Vitousek, P. M., and Matson, P. A.: Nutrient losses over four million years of tropical forest development, Ecology, 84, 2231–2255, 2003.
Hedin, L. O., Brookshire, E. N. J., Menge, D. N. L., and Bar-ron, A.: The nitrogen paradox in tropical forest ecosystems, Annual Review of Ecology, Evolution, and Systematics, 40, doi:10.1146/annurev.ecolsys.37.091305.110246, 2009.
Hirsch, A. I., Michalak, A. M., Bruhwiler, L. M., Peters, W., Dlugo-kencky, E. J., and Tans, P. P.: Inverse modeling estimates of the global nitrous oxide surface flux from 1998–2001, Global Bio-geochem. Cy., 20, doi:10.1029/2004GB002443,2006.
Hobbie, J. E. and Hobbie, E. A.:15N in symbiotic fungi and plants
estimates nitrogen and carbon flux rates in Arctic tundra, Ecol-ogy, 87, 816–822, 2006.
Hogberg, P.: Tansley Review No. 95.15N natural abundance in
soil-plant Systems, New Phytol., 137, 179–203, 1997.
Houlton, B. Z., Sigman, D. M., and Hedin, L. O.: Isotopic evidence for large gaseous nitrogen losses from tropical rainforests, Pro-ceedings of the National Academy of Sciences, 103, 8745–8750, doi:10.1073/pnas.0510185103, 2006.
Houlton, B. Z., Sigman, D. M., Schuur, E. A., and Hedin, L. O.: A climate-driven switch in plant nitrogen acquisition within tropi-cal forest communities, Proc. Natl. Acad. Sci. USA., 104, 8902– 8906, 2007.
Houlton, B. Z., Wang, Y.-P., Vitousek, P. M., and Field, C. B.: A unifying framework for dinitrogen fixation in the terrestrial bio-sphere, Nature, 454, 327–330, 2008.
Houlton, B. Z. and Bai, E.: Imprint of denitrifying bacteria on the global terrestrial biosphere, Proceedings of the National Academy of Sciences, 106, 21713–21716, 2009.
Howarth, R., Billen, G., Swaney, D., Townsend, A., Jaworski, N., Lajtha, K., Downing, J., Elmgren, R., Caraco, N., Jordan, T., Berendse, F., Freney, J., Kudeyarov, V., Murdoch, P., and Zhao-Liang, Z.: Regional nitrogen budgets and riverine N & P fluxes for the drainages to the North Atlantic Ocean: Natural and human influences, Biogeochemistry, 35, 75–139, 1996.
Huang, J., Dool, H. v. d., and Georgakakos, L. P.: Analysis of model-calculated soil moisture over the United States (1931-93) and application to long-range temperature forecasts, J. Climate, 9, 1350–1362, 1996.
Huang, J., Golombek, A., Prinn, R., Weiss, R., Fraser, P., Sim-monds, P., Dlugokencky, E. J., Hall, B., Elkins, J., Steele, P., Langenfelds, R., Krummel, P., Dutton, G., and Porter, L.: Estimation of regional emissions of nitrous oxide from 1997 to 2005 using multinetwork measurements, a chemical trans-port model, and an inverse method, J. Geophys. Res., 113, doi:10.1029/2007JD009381, 2008.
Isaaks, E. H., and Srivastava, R. M.: An introduction to applied geo-statistics, Oxford University Press, New York, New York, USA, 1989.
Jaegle, L., Martin, R. V., Chance, K., Steinberger, L., Kurosu, T. P.,
Jacob, D. J., Modi, A. I., Yobou ˜A, V., Sigha-Nkamdjou, L., and
Galy-Lacaux, C.: Houltonn-induced nitric oxide emissions from soils, J. Geophys. Res., 109, doi:10.1029/2004JD004787, 2004.
Jinuntuya-Nortman, M., Sutka, R. L., Ostrom, P. H., Gandhi, H., and Ostrom, N. E.: Isotopologue fractionation during microbial
reduction of N2O within soil mesocosms as a function of
water-filled pore space, Soil Biol. Biochem., 40, 2273–2280, 2008. Kendall, C.: Tracing nitrogen sources and cycling in catchments, in:
Isotope Tracers in Catchment Hydrology, edited by: Kendall, C. and McDonnell, J., Elsevier Sci., New York, 1998.
Lee, D. S., K¨ohler, I., Grobler, E., Rohrer, F., Sausen, R., Gallardo-Klenner, L., Olivier, J. G. J., Dentener, F. J., and Bouwman, A.
F.: Estimations of global NOxemissions and their uncertainties,
Atmos. Environ., 31, 1735–1749, 1997.
Lelieveld, J. and Dentener, F. J.: What controls tropospheric ozone?, J. Geophys. Res., 105, 3531–3551, 2000.
Li, C., Frolking, S., and Frolking, T. A.: A model of nitrous oxide evolution from soil driven by rainfall events. I: Model structure and sensitivity, J. Geophys. Res., 97, 9759–9776, 1992.
Liu, Y.: Modelling the emission of nitrous oxide (N2O) and methane
(CH4) from the terrestrial biosphere to the atmosphere, PhD,
MIT joint Program on the Science and Policy of Global Change, Massachusetts Institute of Technology, Cambridge, 219 pp., 1996.
Martinelli, L. A., Piccolo, M. C., Townsend, A. R., Vitousek, P. M., Cuevas, E., McDowell, W., Robertson, G. P., Santos, O. C., and Treseder, K.: Nitrogen stable isotopic composition of leaves and soil: tropical versus temperate forests, Biogeochemistry, 46, 45– 65, 1999.
Matson, P. A., Vitousek, P. M., and Schimel, D. S.: Regional ex-trapolation of trace gas flux based on soils and ecosystems, in: Exchange of Trace Gases between Terrestrial Ecosystems and the Atmosphere, edited by: Andreae, M. D., and Schimel, D. S., Springer-Verlag, New York, NY, 97–108, 1989.
Matson, P. A. and Vitousek, P. M.: Ecosystem approach to a global nitrous oxide budget, BioScience, 40, 667–672, 1990.
Matson, P. A., McDowell, W. H., Townsend, A. R., and Vitousek, P. M.: The globalization of N deposition: ecosystem consequences in tropical environments, Biogeochemistry, 46, 67–83, 1999. Mayorga, E., Seitzinger, S. P., Harrison, J. A., Dumont, E., Beusen,
A. H. W., Bouwman, A. F., Fekete, B. M., Kroeze, C., and Van Drecht, G.: Global nutrient export from watersheds 2 (NEWS 2): Model development and implementation, Environmental Mod-elling & Software, 25, 837–853, 2010.
McClain, M. E., Boyer, E. W., Dent, C. L., Gergel, S. E., Grimm, N. B., Groffman, P. M., Hart, S. C., Harvey, J. W., Johnston, C. A., Mayorga, E., McDowell, W. H., and Pinay, G.: Biogeochem-ical hot spots and hot moments at the interface of terrestrial and aquatic ecosystems, Ecosystems, 6, 301–312, 2003.
Merrill, A. G. and Zak, D. R.: Factors controlling denitrification rates in upland and swamp forests, Can. J. For. Res., 22, 1597– 1604, 1992.
Mintz, Y. and Serafini, Y.: Global fields of soil moisture and land-surface evapotranspiration, NASA Goddard Space Flight Center Tech. Memo 83907, 178-180, 1981.
Morford, S. L., Houlton, B. Z., and Dahlgren, R. A.: Increased for-est ecosystem carbon and nitrogen storage from nitrogen rich bedrock, Nature, 477, 78–81, 2011.
Nevison, C. D., Esser, G., and Holland, E. A.: A global model of
changing N2O emissions from natural and perturbed soils, Clim.
Change, 32, 327–378, 1996.
Olivier, J. G. J., Bouwman, A. F., Van der Hoek, K. W., and Berdowski, J. J. M.: Global air emission inventories for
anthro-pogenic sources of NOx, NH3and N2O in 1990, Environ. Pollut.,
102, 135–148, 1998.
Parton, W. J., Hartman, M., Ojima, D., and Schimel, D.: DAYCENT and its land surface submodel: description and testing, Global and Planetary Change, 19, 35–48, 1998.
Potter, C. S., Matson, P. A., Vitousek, P. M., and Davidson, E. A.: Process modeling of controls on nitrogen trace gas emissions from soils worldwide, J. Geophys. Res., 101, 1361–1377, 1996. Rastetter, E. B., Perakis, S. S., Shaver, G. R., and Agren, G. I.:
Terrestrial C sequestration at elevated CO2 and temperature:
the role of dissolved organic N loss, Ecol. Appl., 15, 71–86, doi:10.1890/03-5303, 2005.
Ravishankara, A. R., Daniel, J. S., and Portmann, R. W.:
Nitrous oxide (N2O): the dominant ozone-depleting
sub-stance emitted in the 21st century, Science, 326, 123–125, doi:10.1126/science.1176985, 2009.
Saxton, K. E., Rawls, W. J., Romberger, J. S., and Papendick, R. I.: Estimating generalized soil-water characteristics from texture, Soil Sci. Soc. Am. J., 50, 1031–1036, 1986.
Schaldac, R. and Pries, J. A.: Integrated Models of the Land System: A Review of Modelling Approaches on the Regional to Global Scale, Living Reviews in Landscape Research, 2, 1–34, 2008. Scheer, C., Wassmann, R., Butterbach-Bahl, K., Lamers, J., and
Martius, C.: The relationship between N2O, NO, and N2fluxes
from fertilized and irrigated dryland soils of the Aral Sea Basin, Uzbekistan, Plant. Soil., 314, 273–283, 2009.
Schlesinger, W. H.: On the fate of anthropogenic nitrogen, Pro-ceedings of the National Academy of Sciences, 106, 203–208, doi:10.1073/pnas.0810193105, 2009.
Scholefield, D., Hawkins, J. M. B., and Jackson, S. M.: Develop-ment of a helium atmosphere soil incubation technique for direct measurement of nitrous oxide and dinitrogen fluxes during deni-trification, Soil Biol. Biochem., 29, 1345–1352, 1997.
Seitzinger, S., Harrison, J. A., B¨ohlke, J. K., Bouwman, A. F., Lowrance, R., Peterson, B., Tobias, C., and Drecht, G. V.: Deni-trification across landscapes and waterscapes: a synthesis, Ecol. Appl., 16, 2064–2090, 2006.
Shearer, G. and Kohl, D.: N2-Fixation in field settings: estimations
based on natural15N abundance, Funct. Plant Biol., 13, 699–756,
doi:10.1071/PP9860699, 1986.
Shi, S. L., Xing, G. X., Zhou, K. Y., Cao, Y. C., and Yang, W. X.: Natural nitrogen-15 abundance of ammonium nitrogen and fixed ammonium in soils, Pedosphere, 2, 265–272, 1992.
Sigman, D. M., Robinson, R., Knapp, A. N., van Geen, A., McCorkle, D. C., Brandes, J. A., and Thunell, R. C.: Dis-tinguishing between water column and sedimentary denitrifi-cation in the Santa Barbara Basin using the stable isotopes of nitrate, Geochemistry, Geophysics, Geosystems 4, 1040, doi:1010.1029/2002GC000384, 2003.
Sokolov, A. P., Kicklighter, D. W., Melillo, J. M., Felzer, B. S., Schlosser, C. A., and Cronin, T. W.: Consequences of consid-ering carbon-nitrogen interactions on the feedbacks between cli-mate and the terrestrial carbon cycle, J. Clicli-mate, 21, 3776–3796, doi:10.1175/2008jcli2038.1, 2008.
Stehfest, E. and Bouwman, L.: N2O and NO emission from
agricul-tural fields and soils under naagricul-tural vegetation: summarizing avail-able measurement data and modeling of global annual emissions, Nutr. Cycl. Agroecosyst., 74, 207–228, 2006.
Sutka, R. L., Ostrom, N. E., Ostrom, P. H., Breznak, J. A., Gandhi, H., Pitt, A. J., and Li, F.: Distinguishing nitrous oxide produc-tion from nitrificaproduc-tion and denitrificaproduc-tion on the basis of iso-topomer abundances, Appl. Environ. Microbiol., 72, 638–644, doi:10.1128/aem.72.1.638-644.2006, 2006.
Swerts, M., Uytterhoeven, G., Merckx, R., and Vlassak, K.: Semi-continuous measurement of soil atmosphere gases with gas-glow soil core method, Soil Sci. Soc. Am. J., 59, 1336–1342, 1995. Thornton, P. E., Doney, S. C., Lindsay, K., Moore, J. K.,
Ma-howald, N., Randerson, J. T., Fung, I., Lamarque, J.-F., Fed-dema, J. J., and Lee, Y.-H.: Carbon-nitrogen interactions regu-late climate-carbon cycle feedbacks: results from an atmosphere-ocean general circulation model, Biogeosciences, 6, 2099–2120, doi:10.5194/bg-6-2099-2009, 2009.
Vitousek, P. M.: Litterfall, Nutrient Cycling, and Nutrient
Limitation in Tropical Forests, Ecology, 65, 285–298,
doi:10.2307/1939481, 1984.
Wang, Y.-P. and Houlton, B. Z.: Nitrogen constraints on terrestrial carbon uptake: Implications for the global carbon-climate feed-back, Geophys. Res. Lett., 36, doi:10.1029/2009gl041009, 2009. Wang, Y. P., Houlton, B. Z., and Field, C. B.: A model of biogeo-chemical cycles of carbon, nitrogen, and phosphorus including symbiotic nitrogen fixation and phosphatase production, Global Biogeochem. Cy., 21, doi:10.1029/2006GB002797, 2007. Wang, Y. P., Law, R. M., and Pak, B.: A global model of carbon,
nitrogen and phosphorus cycles for the terrestrial biosphere, Bio-geosciences, 7, 2261–2282, doi:10.5194/bg-7-2261-2010, 2010. Wellman, R. P., Cook, F. D., and Krouse, H. R.: Nitrogen-15: mi-crobiological alteration of abundance, Science, 161, 269–270, doi:10.1126/science.161.3838.269, 1968.
Whitehead, P. G., Wilson, E. J., and Butterfield, D.: A semi-distributed ntegrated itrogen model for multiple source assess-ment in tchassess-ments (INCA): Part I – model structure and process equations, Sci. Total Environ., 210–211, 547–558, 1998. Williams, J. R., Jones, C. A., and Dyke, P. T.: A modeling approach
to determining the relationship between erosion and soil produc-tivity, Transactions of the ASAE 17, 129–144, 1984.
Willmott, C. J. and Matsuura, K.: Terrestrial Air Temperature and Precipitation: Monthly and Annual Climatologies, Version 3.01, 2000.
Wolf, I. and Brumme, R.: Dinitrogen and nitrous oxide formation in beech forest floor and mineral soils, Soil Sci. Soc. Am. J., 67, 1862–1868, 2003.
Xu, X., Tian, H., and Hui, D.: Convergence in the relationship of
CO2and N2O exchanges between soil and atmosphere within
terrestrial ecosystems, Glob. Change Biol., 14, 1651–1660, 2008. Yan, X., Ohara, T., and Akimoto, H.: Statistical modeling of
global soil NOx emissions, Global Biogeochem. Cy., 19,
doi:10.1029/2004GB002276, 2005.
Yienger, J. J. and Levy, H., II: Empirical model of global
soil-biogenic NOxemissions, J. Geophys. Res. Atmos., 100, 114470–
11464, 1995.
Yoneyama, T., Fujita, K., Yoshida, T., Matsumoto, T., Kambayashi,
I., and Yazaki, J.: Variation in natural abundance of15N among
the legume-rhizobia symbiotic system, Plant. Cell. Physiol., 27, 791–799, 1986.
Yoshida, N.:15N-depleted N2O as a product of nitrification, Nature,
335, 528–529, 1988.
Zaehle, S., Friedlingstein, P., and Friend, A. D.: Terrestrial nitrogen feedbacks may accelerate future climate change, Geophys. Res. Lett., 37, L01401, 2010a.