Combined Effects
of Thrombosis Pathway Gene Variants
Predict Cardiovascular Events
Kirsi Auro1*, Mervi Alanne1, Kati Kristiansson1, Kaisa Silander1, Kari Kuulasmaa2, Veikko Salomaa2, Leena Peltonen1,3,4, Markus Perola1,3
1Department of Molecular Medicine, National Public Health Institute, Helsinki, Finland,2Department of Health Promotion and Chronic Disease Prevention, National Public Health Institute, Helsinki, Finland,3Department of Medical Genetics, University of Helsinki, Helsinki, Finland,4The Broad Institute of MIT and Harvard, Boston, Massachusetts, United States of America
The genetic background of complex diseases is proposed to consist of several low-penetrance risk loci. Addressing this complexity likely requires both large sample size and simultaneous analysis of different predisposing variants. We investigated the role of four thrombosis genes: coagulation factor V(F5),intercellular adhesion molecule 1(ICAM1),
protein C(PROC),and thrombomodulin(THBD)in cardiovascular diseases. Single allelic gene variants and their pair-wise combinations were analyzed in two independently sampled population cohorts from Finland. From among 14,140 FINRISK participants (FINRISK-92,n¼5,999 and FINRISK-97,n¼8,141), we selected for genotyping a sample of 2,222, including 528 incident cardiovascular disease (CVD) cases and random subcohorts totaling 786. To cover all known common haplotypes (.10%), 54 single nucleotide polymorphisms (SNPs) were genotyped. Classification-tree analysis identified 11 SNPs that were further analyzed in Cox’s proportional hazard model as single variants and pair-wise combinations. Multiple testing was controlled by use of two independent cohorts and with false-discovery rate. Several CVD risk variants were identified: In women, the combination ofF5 rs75422813THBD rs1042580,together with three singleF5 SNPs, was associated with CVD events. Among men, PROC rs1041296,when combined with eitherICAM1
rs5030341orF5 rs2269648,was associated with total mortality. As a single variant,PROC rs1401296,together with the
F5 Leiden mutation, was associated with ischemic stroke events. Our strategy to combine the classification-tree analysis with more traditional genetic models was successful in identifying SNPs—acting either in combination or as single variants—predisposing to CVD, and produced consistent results in two independent cohorts. These results suggest that variants in these four thrombosis genes contribute to arterial cardiovascular events at population level.
Citation: Auro K, Alanne M, Kristiansson K, Silander K, Kuulasmaa K, et al. (2007) Combined effects of thrombosis pathway gene variants predict cardiovascular events. PLoS Genet 3(7): e120. doi:10.1371/journal.pgen.0030120
Introduction
The genetic basis of complex diseases like coronary heart disease and ischemic stroke probably consists of several predisposing risk factors that can interact with environ-mental factors to produce the disease phenotype. To address such polygenic structure is a challenge likely requiring simultaneous analysis of several risk factors, including genetic variants, in large study samples rich in phenotypes. Gene– gene and gene–environment interaction studies have recently attempted to answer this challenge by analyzing the interact-ing relations of putative risk loci [1–5]. The majority of these studies, however, use two to three genetic markers, thus failing to address the physiological entities or the underlying complex genetic profiles.
In a physiological clotting cascade, binding of thrombin to its receptor, thrombomodulin (THBD), activates protein C (PROC). Activated protein C cleaves coagulation factor V (F5) [6], leading to fibrinolysis. Genetic variation in the cascade genes predisposes to increased clotting, the best known example being activated protein C resistance caused by the factor V Leiden mutation [7]. Several case reports describe PROC deficiency in patients with arterial thrombosis [8,9]. Activated protein C may also play a neuroprotective role in ischemic stroke [10,11]. THBD and intercellular adhesion
molecule 1 (ICAM1) are markers for endothelial activation and damage [12]. Low concentrations of soluble THBD, especially when present along with elevated soluble ICAM1, predispose to cardiovascular disease (CVD) events [13,14]. WhetherTHBD gene variants act as independent CVD risk factors remains unclear [15].
Studies on these four genes have mainly concentrated on a few, often rare, functional polymorphisms within the
indi-Editor:David B. Allison, University of Alabama at Birmingham, United States of America
ReceivedJanuary 18, 2007;AcceptedJune 7, 2007;PublishedJuly 27, 2007 A previous version of this article appeared as an Early Online Release on June 7, 2007 (doi:10.1371/journal.pgen.0030120.eor).
Copyright:Ó2007 Auro et al. This is an open-access article distributed under the terms of the Creative Commons Attribution License, which permits unrestricted use, distribution, and reproduction in any medium, provided the original author and source are credited.
vidual genes [16–19]. We hypothesize that analyzing allelic variants of several genes encoding components of the same physiological cascade will prove to be a more powerful approach to shedding light on CVD risk mechanisms than are studies on single candidates. Analyses comprising several genes belonging to the same pathway may reveal cumulative allelic effects. When acting together, these gene variants may affect the disease risk more profoundly than do the single predisposing variants. We covered common variants of F5, ICAM1, PROC, and THBD genes and assessed their role in CVD in two prospective and independently sampled pop-ulation cohorts of Finns. To address the single gene variants and their interplay in cardiovascular traits, we chose a two-step strategy. We first aimed to identify the variants contributing most to the CVD risk in our study sample using classification-trees. Second, based on these analyses, we studied a subset of the most important SNPs by classical genetic analyses, first as independent markers and then as pair-wise combinations as deviation from the multiplicative model of genetic interaction. Our study identified several variants predisposing to CVD as single or cooperating markers.
Materials and Methods
Study Samples
We utilized two large, independently sampled, and pro-spectively followed population cohorts from Finland, FIN-RISK-92 (n¼5,999, follow-up 1992–2001) and FINRISK-97 (n
¼8,141, follow-up 1997–2003). Subjects for genotyping were selected according to a case-cohort design from among 14,140 FINRISK participants. As cases in this study, we consider those with an incident coronary event (coronary heart disease [CHD], n¼401) or ischemic stroke (n¼149) during follow-up and did not have acute coronary events or strokes before the baseline examination, and everyone deceased from any reason during follow-up (n ¼ 610). In addition, individuals having experienced cardiovascular events at baseline were genotyped, but baseline CVD was
not utilized as an endpoint in this study. International Classification of Diseases (ICD)9 and10 codes for fatal coronary events were 410–414 and 798, and I20–I25, I46, R96, R98, R99, and for nonfatal coronary events 410–411 (ICD-9) and I20.0 and I21–I22 (ICD-10). For fatal and nonfatal ischemic strokes, ICD-9 codes 433 (excluding 4330X, 4331X, and 4339X of the Finnish modification of ICD-9), 434 (excluding 4349X), and ICD-10 code I63 were used. The ICD-10 revision has been used in Finland since January 1996. We will denote the combination of coronary event and ischemic stroke endpoints by CVD. Because 21 individuals had both an incident coronary event and an incident ischemic stroke, the total number of individuals having incident CVD events was 528. Of the 610 deceased, 138 also had an incident CVD event. Random subcohorts, selected with age-dependent probabilities, were drawn from the original cohorts to represent the general study populations (FINRISK-92 n ¼ 400, FINRISK-97 n ¼ 386). Thus, the subcohorts also included individuals having CVD events at baseline (n¼88) or during follow-up (n¼72). This selection yielded a study sample of 2,222 individuals for genotyping (Table 1). Information on the traditional CVD risk factors (serum cholesterol, triglyceride (TG), and C-reactive protein (CRP) levels, blood pressure, anthropomorphic measures, smoking, medication, disease, and family history) as well as whole blood samples for DNA were collected at baseline. The study cohorts have been described in detail previously [15,20] and at http://www.ktl.fi/publications/morgam/cohorts/index. html. The Ethics Committee of the National Public Health Institute of Finland approved the study.
Genotyping Strategy
To cover all known common (frequency.10%) variants in the four thrombosis genes, 54 single nucleotide polymor-phisms (SNPs) were selected: 24 SNPs inF5, nine inICAM1, seven inPROC, and 14 inTHBD[15]. This selection was based on haplotype information in the SeattleSNPs variation discovery resource [21]. The F5 Leiden mutation (rs6025) was included based on the literature. Haplotype structures in the four genes were analyzed with Haploview3.2 [22]. For any two SNPs in tight linkage disequilibrium (LD,r2 .0.8) with each other, only one was included in further analyses. Because SNP selection was based on haplotype information, haplotype analyses were excluded. Baseline CVD cases were utilized in LD calculations, but had to be excluded from Cox’s proportional hazard model due to the unknown time of the event measured (before the study began). Thus, the baseline cases were excluded from all statistical analyses to achieve a similar study sample used in all the analyses. Rs3216183 was genotyped with TaqMan (Roche Molecular Systems, http://www.roche.com/) and the remaining 53 SNPs with Sequenom MassARRAY (Sequenom, http://www. sequenom.com/) with 10 ng of DNA and hME chemistry. Primer information and assay conditions are available from the authors upon request. DNA was extracted by standard protocols [23] from whole blood stored at208C.ICAM1SNP r5030380 was excluded due to technical difficulties. The samples with low DNA yield (n¼ 100) were whole-genome amplified before genotyping [24]. Before genotyping the FINRISK samples, the Mendelian inheritance of each SNP was checked in a Finnish sample of 60 mother, father, and child trios. Mendel check revealed no errors. The FINRISK
Author Summary
genotypic sample included 2% open and 5% blinded duplicates. Genotyping was performed as part of the MORGAM and GenomEUtwin Projects (http://www. genomeutwin.org/) [25]. The genotyping error rate was ,1/ 400 in blind duplicate comparisons. The genotyping success rate was 93% or higher for each SNP. Together, these quality-control -procedures suggested very high genotyping quality.
Statistical Analyses
Statistical analyses were performed in three stages: (1) with AnswerTree3.0 (SPSS, http://www.spss.com/) to discover pos-sible co-appearance of allelic variants as risk definers and to select the most significant SNPs for further analyses, and (2) with SAS v8.2 for Windows (SAS, http://www.sas.com/) to estimate allele frequencies, to discover SNPs influencing the traditional CVD risk factors, and to estimate hazard ratios (HR) of the SNP alleles with Cox’s proportional hazards model [26]. (3) Finally, to estimate whether the SNPs chosen at stage 1 were the informative ones required a separate sensitivity analysis. All SNPs were analyzed in Cox’s propor-tional hazards, coding the SNPs as 1–0 assuming dominant inheritance.
AnswerTree is a classification-tree algorithm that attempts to find a variable and a cutpoint for the variable to split a dataset to best predict disease outcome. This split is called the root node. The algorithm is then applied to the resulting subgroups of the dataset accordingly, and the process is continued to form a tree. In our application of the algorithm, SNPs were coded as 0 (minor allele carriers) to 1 (major allele homozygotes) assuming dominant inheritance and analyzed together with the traditional risk factors, using incident CVD events as the endpoint. Of the possible algorithms we used exhaustive chi-squared automatic interaction detector (CHAID), which allows more than two sister nodes in a split if necessary and thus was thought to model the biological risk caused by the phenotypic risk factors, for example cholesterol values, better than a strictly bifurcated split, and moreover, it allows control of a number of steps in the tree: To keep the tree structure simple and to discover combinations of predisposing factors affecting relatively large groups of individuals, we set the minimum root node size at 20 and the minimum end node size at 10. Maximum branch level in the trees was limited to five. The significance of all splits was calculated asv2
To search for all well-supported splits and to reduce the extent to which the root node in the overall analysis may obscure other important splits we decided, instead of growing a single tree, to grow a forest of trees: a collection of classification trees achieved by bootstrap techniques using random subsamples and other criteria. In order to grow the forest, we took ten random subsamples of 60% of the men and ten random subsamples of 60% of the women of the combination of the FINRISK-92 and97 cohorts. First, one tree was grown for each subsample to determine the significant splits. These 20 trees included altogether 50 significant splits for men and 45 for women (Tables 1 and 2). Using these significant splits from the 20 trees as root nodes we grew a forest of 50 trees for men and 45 trees for women still utilizing the subsample data. The SNPs present in
.10% of the sex-specific trees were selected for further analysis. Because the data used in the classification-tree analysis originated from a single dataset, combining the two cohorts, no cross validation among the samples was performed.
At stage 2, we first used the combined data set of FINRISK-92 and97 cohorts to gain maximum power, but also both cohorts separately to assess the consistency of the findings. The allele distributions of the selected SNPs between the cases and the subcohort (excluding cases and baseline CVD) were compared with Pearson’sv2. The relation of each SNP to
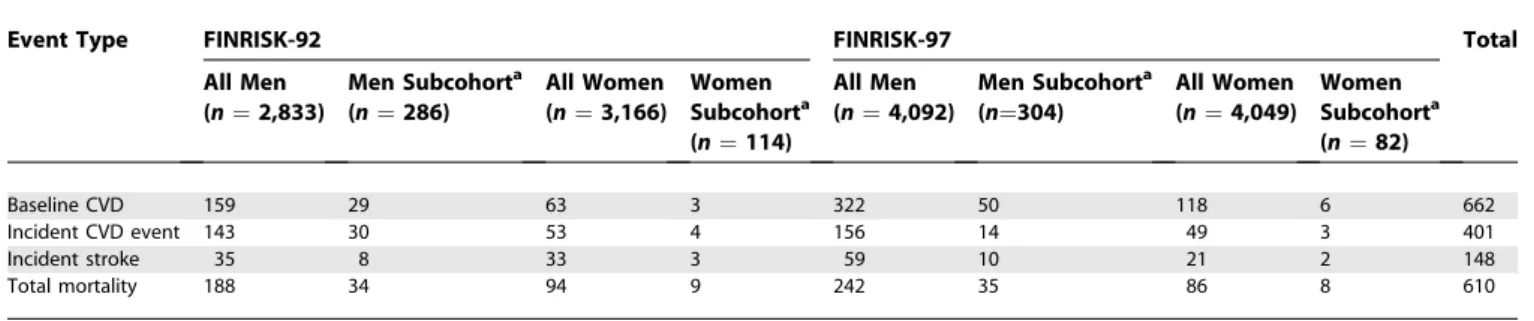
the common CVD risk factors (TG, total cholesterol [TC], HDL cholesterol [HDL], TC/HDL ratio, systolic and diastolic blood pressure, CRP, body mass index [BMI], and waist-to-hip ratio [WHR]) was analyzed separately for each risk factor with an age-, sex-, and cohort-adjusted general linear model. To achieve normality, HDL and CRP were log transformed. Hazard ratios for all selected SNPs and their pair-wise combinations (with interaction terms, as deviation from the multiplicative model of interaction) were calculated with Cox’s proportional hazards model, with age at baseline, (sex), TC/HDL ratio, BMI, smoking, diabetes, hypertension, and CRP as covariates. Time from baseline served as the time parameter. The analysis was stratified by eastern and western Finland and additionally by cohort when combining the two datasets. Total mortality, incident coronary, incident ische-mic stroke, and incident CVD (coronary and stroke events combined) events served as endpoints. We first performed sex-specific analyses and then combined men and women, under additive, dominant, and recessive inheritance models. Table 1.Characteristics of the Study Cohorts: Number of Cardiovascular Events
Event Type FINRISK-92 FINRISK-97 Total
All Men (n¼2,833)
Men Subcohorta (n¼286)
All Women (n¼3,166)
Women Subcohorta (n¼114)
All Men (n¼4,092)
Men Subcohorta (n¼304)
All Women (n¼4,049)
Women Subcohorta (n¼82)
Baseline CVD 159 29 63 3 322 50 118 6 662
Incident CVD event 143 30 53 4 156 14 49 3 401
Incident stroke 35 8 33 3 59 10 21 2 148
Total mortality 188 34 94 9 242 35 86 8 610
a
A subcohort is a random sample of the full cohorts selected for genotyping
n,number.
TheF5Leiden mutation was analyzed only with the dominant model, due to low minor allele frequency. Multiple testing was addressed by performing all analyses in the two separate cohorts, as well as with false-discovery rate (FDR). FDR was calculated within sex- and endpoint-specific groups. SNP combinations were analyzed with interaction terms as deviation from the multiplicative model (i.e., interaction HR different from the product of the independent SNP HRs) in Cox’s model adjusted for the same risk factors as with the single SNPs. With interaction terms, the recessive model of inheritance was selected for a SNP if it showed significant association in the single SNP analyses, otherwise the dominant model was used to gain power. Results showing a consistent association or similar trend in the two separate study cohorts or their combination or both, and having FDR
,0.1 for their combination were considered as significant.
Results
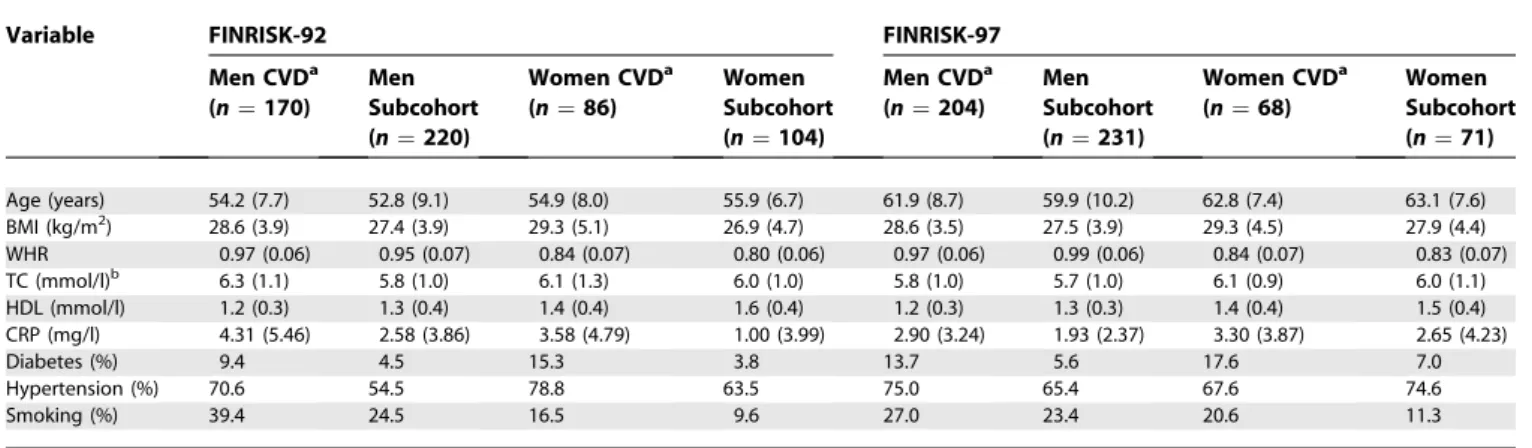
In both cohorts and in both sexes incident CVD cases had higher total cholesterol and BMI and lower HDL cholesterol at baseline than did subcohort members free of CVD at the end of follow-up. The CVD cases also had a higher frequency of diabetes and hypertension and more often smoked than did the healthy subcohort members (Table 3). The baseline characteristics of the cases and the subcohorts have been described in detail [15,20].
Based on analyses with Haploview3.2, the LD pattern of our study sample of Finns, a population isolate known to retain higher levels of LD [27], differed from that provided by Seattle SNPs, and we excluded from the analyses four F5 SNPs (rs3766103, rs2227245, rs6670678,andrs6029,Figure S1), one ICAM1SNP(rs5030352),onePROCSNP(rs2069921),and one THBDSNP(rs1042579),all showing strong LD (r20.8) with another SNP. In addition, SNPs monomorphic in 370 Finnish individuals were excluded (rs5030388, rs9332566, rs9332625, rs9332587, rs1046712, rs1800576, rs1800577, rs1800578, rs1800579, rs3176122,andrs3176121). The genotype
frequen-cies of the remaining 36 SNPs (Table S2) followed Hardy– Weinberg equilibrium in the subcohorts (p.0.05).
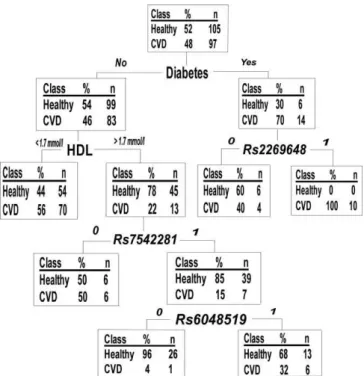
We aimed to reduce the number of variants used in further analyses and to discover possible co-effects of single gene variants by classification-tree analyses. The 36 SNPs, together with the baseline phenotypic variables (smoking, TC, TG, HDL, BMI, WHR, systolic and diastolic blood pressure, diabetes status, and CRP), were analyzed with AnswerTree3.0 with incident CVD as an endpoint. We grew a forest of classification-trees using each of the significant splits of Table 2 and Table S1 as root nodes. From this 95-tree forest (50 trees for men and 45 for women), we selected all SNPs present in .10% of the trees for further analyses. This selection yielded 12 SNPs: sixF5SNPs and two SNPs each fromTHBD, PROC, and ICAM1. Of the F5 SNPs, rs970741was excluded due to relatively strong LD (r2¼0.42) withrs2420369(Figure S1), further reducing the SNP selection to 11 (Table 4). The rationale for this exclusion was to avoid an LD-based bias when analyzing SNP combinations. Figure 1 gives an example of a single tree grown with a random female sample. The figure also demonstrates a general pattern observed: the best splits seen with all subsamples were traditional phenotypic risk factors such as cholesterol or BMI, and the SNPs played a role in the lower branches of the trees, i.e., in subgroups of individuals specified by the phenotypic factors (Figure 1, Table 2, Table S1).
Next, we analyzed genotype–phenotype relationships of the 11 selected SNPs under additive, dominant, and recessive models of inheritance. The male minor allele carriers of ICAM1 rs5030341had significantly smaller waist-to-hip ratio (p¼0.0077 for combined cohorts, data not shown) than did the non-carriers of this allele, and the CVD cases homozygotic for F5 rs7542281 had significantly lower BMI (p ¼ 0.0018 for combined cohorts, unpublished data). These observations were consistent in both cohorts.
Separate Cox’s proportional hazard models were fitted for all selected 11 SNPs and their pair-wise combinations. Incident coronary, incident ischemic stroke, incident cardi-ovascular events, and total mortality served as endpoints. We Table 2.Significant Splits (Sample-Specificp-Value,v2) Seen in Classification-Trees Grown in AnswerTree3.0 with Ten Random Female Datasets, Each Containing 60% of the Original Data
Variable Tree Number
1 2 3 4 5 6 7 8 9 10
Diabetes 0.00051 0.016 0.00015 0.0077 0.035 0.0019 0.0056 0.0043 0.0042 0.032
BMI — — 0.014 — — 0.021 — — 0.0013 —
WHR 0.0091 — — — — 0.048 — — — —
HDL 0.0023 0.0025 0.00055 0.0058 0.000068 — 0.035 0.00090 0.000081 0.0029
TC/HDL — 0.020 0.0041 0.014 0.014 — — 0.0037 0.00039 0.037
TG 0.0098 0.0022 — 0.0011 — — 0.021 0.013 — —
Non-HDL — — — — — — — 0.025 — —
Smoking — — 0.0095 — 0.024 — 0.016 — — —
Hypertension — — — — — — — — 0.0032 —
Rs2269648 0.012 — — — — — — — — —
Rs7542281 — 0.040 — — — — — — — —
Rs9332575 — — 0.010 — — — — — — —
Rs1042580 — — — — — — 0.031 — — —
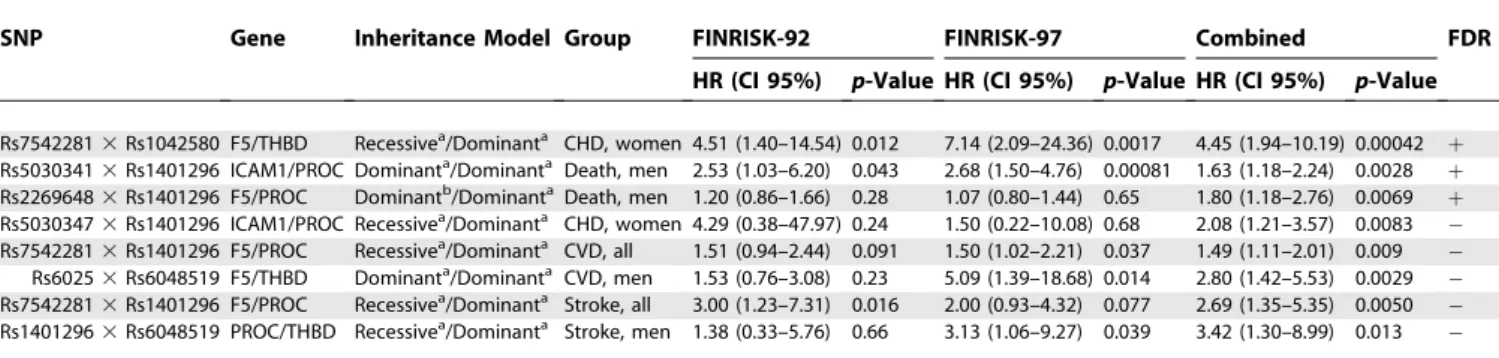
considered only SNPs showing consistent association in the separate cohorts or their combination or both, and exceeding the FDR,10% limit for the combined cohorts as significant. With pair-wise SNP combinations, a notable deviation from the multiplicative interaction model was additionally re-quired. The Cox’s model revealed several significant CVD risk variants (Tables 3, 5, and 6). Among women, F5 SNPs rs7542281was associated with incident CVD. When combined with THBD rs1042580, substantial deviation from multi-plicative model of interaction was seen. In addition, F5 rs2420369was associated with incident CVD events. In men, PROC rs1401296 was associated with total mortality when combined with ICAM1 rs5030341 or with F5 rs2269648. ICAM1 rs5030347 was associated with total mortality as a single variant.
In analysis of coronary events and ischemic strokes
separately, F5 SNP rs7542281 showed an association with both coronary and ischemic stroke events as a single variant in women, and F5 rs2269648 was associated with incident ischemic stroke. In men,PROC rs1401296, together with F5 Leiden mutation, was associated with incident ischemic stroke. The wide confidence intervals seen when analyzing stroke events in females reflect the small number of female stroke cases. Several other SNPs showed a suggestive association with the endpoints, but failed the FDR ,0.1 criterion (Tables 5 and 6). Figure 2 shows a schematic overview of the contribution of the gene variants analyzed here to CVD.
The importance of the SNPs excluded from further analyses was assessed by analysis of all the 36 SNPs with Cox’s proportional hazards model, assuming dominant inheritance, using combined cohorts in all the data and then
Table 4.Minor Allele Frequencies of the SNPs Analyzed in Stage 2 of the Study
SNP Gene Position
(Amino Acid Change)
FINRISK-92 FINRISK-97
Men CVDa (n¼170)
Men Subcohort (n¼220)
Women CVDa (n¼86)
Women Subcohort (n¼104)
Men CVDa (n¼204)
Men Subcohort (n¼332)
Women CVDa (n¼68)
Women Subcohort (n¼71)
Rs2269648 F5 Promoter 0.24 0.28 0.23 0.30 0.27 0.25 0.24 0.29
Rs2420369 F5 Intron 0.37 0.38 0.31 0.42 0.41 0.36 0.36 0.42
Rs7542281 F5 Intron 0.37 0.34 0.36 0.26 0.32 0.35 0.43 0.33
Rs9332591 F5 Intron 0.12 0.13 0.11 0.13 0.10 0.12 0.13 0.17
Rs6025b F5 Exon (Q/R) 0.03 0.03 0.03 0.01 0.03 0.01 0.03 0.03
Rs5030341 ICAM1 Intron 0.33 0.33 0.37 0.38 0.30 0.34 0.34 0.37
Rs5030347 ICAM1 Intron 0.23 0.21 0.23 0.16 0.23 0.18 0.24 0.17
Rs5937 PROC Exon (D/D) 0.27 0.30 0.31 0.26 0.26 0.29 0.25 0.28
Rs1401296 PROC 39 0.34 0.31 0.31 0.34 0.37 0.35 0.38 0.39
Rs1042580 THBD 39 0.30 0.30 0.32 0.29 0.37 0.36 0.33 0.31
Rs6048519 THBD Promoter 0.43 0.43 0.44 0.46 0.43 0.48 0.45 0.37
Cardiovascular cases removed from the subcohorts.
a
CVD: incident coronary event or ischemic stroke during follow-up.
b
F5 Leiden mutation.
doi:10.1371/journal.pgen.0030120.t004
Table 3.Characteristics (Mean [Standard Deviation] or %) of the Study Cohorts
Variable FINRISK-92 FINRISK-97
Men CVDa (n¼170)
Men Subcohort (n¼220)
Women CVDa (n¼86)
Women Subcohort (n¼104)
Men CVDa (n¼204)
Men Subcohort (n¼231)
Women CVDa (n¼68)
Women Subcohort (n¼71)
Age (years) 54.2 (7.7) 52.8 (9.1) 54.9 (8.0) 55.9 (6.7) 61.9 (8.7) 59.9 (10.2) 62.8 (7.4) 63.1 (7.6)
BMI (kg/m2) 28.6 (3.9) 27.4 (3.9) 29.3 (5.1) 26.9 (4.7) 28.6 (3.5) 27.5 (3.9) 29.3 (4.5) 27.9 (4.4)
WHR 0.97 (0.06) 0.95 (0.07) 0.84 (0.07) 0.80 (0.06) 0.97 (0.06) 0.99 (0.06) 0.84 (0.07) 0.83 (0.07)
TC (mmol/l)b 6.3 (1.1) 5.8 (1.0) 6.1 (1.3) 6.0 (1.0) 5.8 (1.0) 5.7 (1.0) 6.1 (0.9) 6.0 (1.1)
HDL (mmol/l) 1.2 (0.3) 1.3 (0.4) 1.4 (0.4) 1.6 (0.4) 1.2 (0.3) 1.3 (0.3) 1.4 (0.4) 1.5 (0.4)
CRP (mg/l) 4.31 (5.46) 2.58 (3.86) 3.58 (4.79) 1.00 (3.99) 2.90 (3.24) 1.93 (2.37) 3.30 (3.87) 2.65 (4.23)
Diabetes (%) 9.4 4.5 15.3 3.8 13.7 5.6 17.6 7.0
Hypertension (%) 70.6 54.5 78.8 63.5 75.0 65.4 67.6 74.6
Smoking (%) 39.4 24.5 16.5 9.6 27.0 23.4 20.6 11.3
Outliersþ/four standard deviations excluded. CVD cases removed from the subcohorts.
a
CVD: incident coronary event or ischemic stroke during the follow-up.
b
with separate sexes. These results strongly suggest that the two-stage approach was able to recognize all informative SNPs: the significant results (p, 0.05) seen in Cox’s model were concentrated in those SNPs selected for stage 2. With all the other SNPs showing statistical significance for the combined cohorts, the results from the separate study cohorts showed either a discrepancy in the hazard ratio or only one of the cohorts gave a signal (Tables S4–S16).
Discussion
Our present study provides a fresh way to utilize different methods to analyze the impact of multiple genes on a phenotype. This two-step analysis strategy used classification-trees to select a subset of SNPs from a larger set of genome-wide haplotype tagging SNPs for further genetic analyses of allelic covariance and hazard ratios. The importance of the SNPs excluded from the further analyses was assessed with a separate sensitivity analysis. Even though all genetic variants, or combinations of them, were required to show consistent effects in both the independent cohorts to be considered significant, only functional studies and replications in other populations will validate the importance of these findings for CVD. This may prove a valuable approach in whole-genome association analyses, where the amount of genetic data is overwhelming.
Classification-trees structure data by searching first for the variable best explaining the determined endpoint and splitting the dataset into subgroups according to this variable. The search continues in the specified subgroups, which again split into smaller groups accordingly. Classification-trees are thus useful in organizing noisy datasets comprising multiple variables, and can be used to identify specific pathways determining an outcome or specific subgroups having similarities leading to this outcome. Gruenewald et al. [28] utilized classification-trees to identify risk markers for mortality in an elderly population, and determined several mortality-predictive pathways consisting of different combi-nations of markers, in both men and women. Their study highlights the multiplicity of solutions leading to the same outcome and illustrates how classification-trees can prove useful in structuring multiple variables in an organized manner. In our data, the classification-tree analysis itself failed to detect consistent gene–gene or gene–environment interaction patterns, but was useful in reducing the number of SNPs analyzed with other models. In our dataset, the forest of trees demonstrated that the influence of any tested SNP on Figure 1. Example of a Classification-Tree in a Random Female
Subsample Consisting of 60% of the Original Data
SNPs are analyzed as 0 (minor allele carriers) to 1 (major allele homozygotes), modeling dominant inheritance.
doi:10.1371/journal.pgen.0030120.g001
Table 5.Association of Single SNPs with the Endpoints in Time-to-Event Analysis
SNP Gene Inheritance Model Group FINRISK-92 FINRISK-97 Combined FDRc
HR (CI 95%) p-Value HR (CI 95%) p-Value HR (CI 95%) p-Value
Rs7542281 F5 Additivea CHD, women 2.82 (0.94–8.49) 0.065 3.21 (1.30–7.93) 0.011 2.63 (1.38–5.00) 0.0033 þ Rs7542281 F5 Additivea CVD, women 3.98 (1.65–9.56) 0.0021 2.63 (1.11–6.23) 0.028 2.65 (1.50–4.39) 0.00061
þ
Rs2420369 F5 Additiveb CVD, women 1.55 (0.58–4.13) 0.38 1.09 (0.48–2.51) 0.84 1.81 (1.21–2.72) 0.0040 þ Rs7542281 F5 Additivea Stroke, women 8.59 (1.45–50.84) 0.018 2.25 (0.24–21.29) 0.48 13.51 (2.82–64.77) 0.0011 þ Rs2269648 F5 Additiveb Stroke, women 2.16 (0.31–15.15) 0.439 1.94 (0.16–24.12) 0.61 11.51 (2.25–58.83) 0.0034 þ
Rs6025 F5 Dominanta Stroke, men Very rared Very rared 4.47 (1.63–12.29) 0.0037 þ
Rs1401296 PROC Recessivea Stroke, men 2.44 (9.93–6.43) 0.072 2.07 (0.99–4.34) 0.054 2.84 (1.32–6.12) 0.0077 þ Rs5030347 ICAM1 Recessivea Death, men 1.76 (0.77–3.99) 0.18 2.55 (1.61–4.07) 0.000084 2.28 (1.55–3.36) 0.000029 þ Rs1401296 PROC Dominanta CVD, women 1.63 (0.86–3.08) 0.14 1.44 (0.81–2.57) 0.21 1.57 (1.03–2.04) 0.036
Rs1401296 PROC Recessivea CVD, men 1.50 (0.92–2.44) 0.11 1.31 (0.86–2.00) 0.20 1.43 (1.03–2.00) 0.035 Rs6025 F5 Dominanta Stroke, all 1.83 (0.64–5.26) 0.26 1.80 (0.61–5.31) 0.29 2.98 (1.20–7.41) 0.0191
Rs5030347 ICAM1 Recessivea CHD, men 1.51 (0.65–4.23) 0.11 1.10 (0.49–2.12) 0.28 1.88 (1.07–3.31) 0.028
Covariates: age at baseline, (sex, cohort), smoking, hypertension, TC/HDL, BMI, diabetes, and CRP. The allele designated as the risk allele was coded 1 and the other allele 0.
a
Minor allele is the risk allele.
b
Major allele is the risk allele.
c
FDR: rejecting the null hypothesis for those with‘‘þ’’assures that the false-discovery rate,10% in the combined analysis.
d
Could not be analyzed in separate cohorts (number of cases,10). CI, confidence interval.
cardiovascular events was evident only after first splitting a tree by one or more traditional risk factors, such as cholesterol level, BMI, or diabetes. This fits well the current understanding of the nature of the complex diseases: setting aside some rare, strictly familial cases of CVD, the vast majority of cardiovascular diseases are likely to be charac-terized by several low-predisposing genes and their possible interactions. In these cases, the traditional phenotypic risk factors play a stronger role, and genetic factors are more likely to lurk in the background. Classification-trees could therefore prove powerful also in determining subsets,
‘‘branches,’’of individuals among whom the genetic variants are especially evident risk factors. For example, theF5Leiden
mutation has been suggested to be associated with CVD among young women with an unhealthy lifestyle [29].
Our study identified several thrombosis-related risk var-iants—both single SNPs and their pair-wise combinations— for coronary events, ischemic strokes, and total mortality, showing consistent association in two independently selected Finnish population cohorts. Thrombosis is a central step in the pathogenesis of myocardial infarction and ischemic stroke. The ruptured wall of a coronary plaque is covered with thrombosis leading either to local obstruction of circulation or emboli traveling in more peripheral arterial branches. Thus, variants in thrombosis genes are also biologically relevant risk factors for coronary and stroke events. Our observations on various allelic combinations from several genes associating with CVD events highlight the importance of wide-perspective studies concentrating on numerous genes and their allelic variants to explore the genetic background of any complex trait. One should proceed cautiously when drawing biological conclusions from statistical interaction models: the underlying biological processes are likely to be highly complex, and evidence of combined effects in a statistical sense fails to do justice to this complexity. Our results indicate, however, that SNP combi-nations may reveal risk variants that could remain unnoticed when one is concentrating purely on single SNPs; SNP combinations could therefore be one step forward in the study of complex traits. Here, the CVD-associated variants of the candidate genes, excluding the Leiden mutation, repre-sent either intronic or intragenic SNPs, likely linked to other, functional variants contributing to the true disease predis-position.
Studies on theF5 Leiden mutation in arterial thrombosis have been controversial [30], but a recent meta-analysis suggests that theF5Leiden mutation contributes significantly to coronary events [31]. The F5 Leiden mutation also associated with ischemic stroke in children [32]. In our study, men carrying the risk (minor) allele of F5Leiden were at a 4.47-fold increased risk for ischemic stroke, and a suggestive finding emerged when women were included in the analysis. The Leiden mutation also contributed to CVD risk in men jointly with a THBD SNP rs6048519. Addressing potential Figure 2.Schematic Overview of the Interplay of Traditional
Cardiovas-cular Risk Factors and Genetic Variants Contributing to Disease Risk in Our Study Sample
doi:10.1371/journal.pgen.0030120.g002
Table 6.Association of Pair-Wise SNP Combinations with the Endpoints in Time-to-Event Analysis
SNP Gene Inheritance Model Group FINRISK-92 FINRISK-97 Combined FDR c
HR (CI 95%) p-Value HR (CI 95%) p-Value HR (CI 95%) p-Value
Rs75422813Rs1042580 F5/THBD Recessivea/Dominanta CHD, women 4.51 (1.40–14.54) 0.012 7.14 (2.09–24.36) 0.0017 4.45 (1.94–10.19) 0.00042 þ Rs50303413Rs1401296 ICAM1/PROC Dominanta/Dominanta Death, men 2.53 (1.03–6.20) 0.043 2.68 (1.50–4.76) 0.00081 1.63 (1.18–2.24) 0.0028
þ
Rs22696483Rs1401296 F5/PROC Dominantb/DominantaDeath, men 1.20 (0.86–1.66) 0.28 1.07 (0.80–1.44) 0.65 1.80 (1.18–2.76) 0.0069 þ Rs50303473Rs1401296 ICAM1/PROC Recessivea/Dominanta CHD, women 4.29 (0.38–47.97) 0.24 1.50 (0.22–10.08) 0.68 2.08 (1.21–3.57) 0.0083 Rs75422813Rs1401296 F5/PROC Recessivea/Dominanta CVD, all 1.51 (0.94–2.44) 0.091 1.50 (1.02–2.21) 0.037 1.49 (1.11–2.01) 0.009 Rs60253Rs6048519 F5/THBD Dominanta/Dominanta CVD, men 1.53 (0.76–3.08) 0.23 5.09 (1.39–18.68) 0.014 2.80 (1.42–5.53) 0.0029 Rs75422813Rs1401296 F5/PROC Recessivea/Dominanta Stroke, all 3.00 (1.23–7.31) 0.016 2.00 (0.93–4.32) 0.077 2.69 (1.35–5.35) 0.0050 Rs14012963Rs6048519 PROC/THBD Recessivea/Dominanta Stroke, men 1.38 (0.33–5.76) 0.66 3.13 (1.06–9.27) 0.039 3.42 (1.30–8.99) 0.013
Covariates: age at baseline, (sex, cohort), smoking, hypertension, rchol, BMI, diabetes, and CRP. The allele stated as the risk allele was coded as 1 and the other allele as 0. Estimates of the SNPs contributing to the combinations are listed in Table S3.
a
Minor allele is the risk allele.
b
Major allele is the risk allele.
c
FDR: rejecting the null-hypothesis for those with‘‘þ’’assures that the false-discovery rate,10% in the combined analysis. CI, confidence interval.
interactions for rare allelic variants, or to analyze the real impact of the Leiden mutation, requires very large datasets [31]. Our earlier results implied that in our study cohorts THBDvariants alone seemed to play no role in CVD [15], but our new data from this study suggest that THBD may contribute to CVD in combination with other risk factors. Podgoreanu and colleagues reported an association ofICAM1 SNP rs5498 with postoperative myocardial infarction [19]. This SNP was in our population in strong LD (r2¼0.82) with SNPrs3093030,but with no association with CVD. The wide confidence intervals in the analyses of female stroke cases reflect the need for larger study cohorts. In the present study, the number of female stroke participants was especially limited.
This is, to our knowledge, the first study to cover all known common allelic variants in F5, ICAM1, PROC, and THBD genes, analyzing them as a physiological‘‘pathway’’entity and assessing their relationship with the traditional CVD risk factors. Multiple testing is an emerging issue in all complex genetics studies comprising several markers. We adjusted the findings of the final analysis step for multiple testing using the FDR, although this does not adjust for the fact that the earlier selection of SNPs by use of classification-trees was done on the same dataset. We chose to use 10% as a limit in the FDR analyses, stating that with this limit, 90% of the findings are expected to be true positives, whereas 10% could still be false positives. In addtition, the sensitivity analysis suggested that the classification-tree approach was able to select the informative SNPs, excluding the less informative ones. The major strength of this study is to further minimize the possibility of false-positive findings by requiring consis-tency in the findings in two separate cohorts of the same population. However, these results still need replication in other independent studies and populations. The major limitation of this study is its cohort size; studies comprising several hundred cases in each category are needed to profoundly address gene–gene interactions, especially once these types of analyses are reaching genome-wide datasets of thousands of genes. Another limitation of the study sample is the lack of plasma concentrations of the hemostatic factors.
In conclusion, combining data from several genes encoding components of the same biological pathway and analyzing the impact of genes together with other relevant risk factors may prove useful in regard to studying diseases with polygenic structures. Currently, sensible ways are called for to analyze the overwhelming information load produced by studies containing various genes and many variants. Our approach provides one example for selecting the informative variants from the background. Our results from the thrombosis cascade of four genes shed light on the interplay of these gene variants’ roles in arterial thrombosis.
Supporting Information
Figure S1.Linkage Disequilibrium Pattern (r2) and Haplotype Blocks of the Coagulation Factor V SNPs Genotyped
Found at doi:10.1371/journal.pgen.0030120.sg001 (71 KB JPG).
Table S1. Significant Splits (Sample-Specific p-Value, v2) Seen in
Classification-Trees Grown in AnswerTree3.0 with Ten Random Male Datasets, Each Containing 60% of the Original Data
SNPs were analyzed as 0 (minor allele carriers) to 1 (major allele homozygotes).
Found at doi:10.1371/journal.pgen.0030120.st001 (11 KB DOC).
Table S2.Minor Allele Frequencies of All SNPs Analyzed Found at doi:10.1371/journal.pgen.0030120.st002 (141 KB DOC).
Table S3.Estimates for the SNPs Contributing to the Pair-Wise SNP Combinations Presented in Table S6
Found at doi:10.1371/journal.pgen.0030120.st003 (12 KB DOC).
Table S4.Association of the SNPs Studied with Incident Coronary Events in Time-to-Event Analysis in Both Sexes
Covariates: age at baseline, (sex, cohort), smoking, hypertension, TC/ HDL, BMI, diabetes, and CRP). FINRISK-92 and FINRISK-97 cohorts combined for the analysis. Analysis performed according to dominant inheritance model; hazard ratios.1 show major allele as the risk allele.
Found at doi:10.1371/journal.pgen.0030120.st004 (12 KB DOC).
Table S5.Association of the SNPs Studied with Incident Coronary Events in Time-to-Event Analysis in Men
Covariates: age at baseline, (sex, cohort), smoking, hypertension, TC/ HDL, BMI, diabetes, and CRP. FINRISK-92 and FINRISK-97 cohorts combined for the analysis. Analysis performed according to dominant inheritance model; hazard ratios.1 show major allele as the risk allele.
Found at doi:10.1371/journal.pgen.0030120.st005 (12 KB DOC).
Table S6.Association of the SNPs Studied with Incident Coronary Events in Time-to-Event Analysis in Women
Covariates: age at baseline, (sex, cohort), smoking, hypertension, TC/ HDL, BMI, diabetes, and CRP. FINRISK-92 and FINRISK-97 cohorts combined for the analysis. Analysis performed according to dominant inheritance model; hazard ratios.1 show major allele as the risk allele.
Found at doi:10.1371/journal.pgen.0030120.st006 (12 KB DOC).
Table S7.Association of the SNPs Studied with Incident Ischemic Stroke Events in Time-to-Event Analysis in Both Sexes
Covariates: age at baseline, (sex, cohort), smoking, hypertension, TC/ HDL, BMI, diabetes, and CRP. FINRISK-92 and FINRISK-97 cohorts combined for the analysis, which comprises both sexes. Analysis performed according to dominant inheritance model; hazard ratios
.1 show major allele as the risk allele.
Found at doi:10.1371/journal.pgen.0030120.st007 (12 KB DOC).
Table S8.Association of the SNPs Studied with Incident Ischemic Stroke Events in Time-to-Event Analysis in Men
Covariates: age at baseline, (sex, cohort), smoking, hypertension, TC/ HDL, BMI, diabetes, and CRP. FINRISK-92 and FINRISK-97 cohorts combined for the analysis. Analysis performed according to dominant inheritance model; hazard ratios.1 show major allele as the risk allele.
Found at doi:10.1371/journal.pgen.0030120.st008 (12 KB DOC).
Table S9.Association of the SNPs Studied with Incident Ischemic Stroke Events in Time-to-Event Analysis in Women
Covariates: age at baseline, (sex, cohort), smoking, hypertension, TC/ HDL, BMI, diabetes, and CRP. FINRISK-92 and FINRISK-97 cohorts combined for the analysis. Analysis performed according to dominant inheritance model; hazard ratios.1 show major allele as the risk allele.
Found at doi:10.1371/journal.pgen.0030120.st009 (12 KB DOC).
Table S10.Association of the SNPs Studied with Incident Cardiovas-cular (Coronary or Ischemic stroke) Events in Time-to-Event Analysis in Both Sexes
Covariates: age at baseline, (sex, cohort), smoking, hypertension, TC/ HDL, BMI, diabetes, and CRP. FINRISK-92 and FINRISK-97 cohorts combined for the analysis. Analysis performed according to dominant inheritance model; hazard ratios.1 show major allele as the risk allele.
Found at doi:10.1371/journal.pgen.0030120.st010 (12 KB DOC).
Table S11.Association of the SNPs Studied with Incident Cardiovas-cular (Coronary or Ischemic Stroke) Events in Time-to-Event Analysis in Men
HDL, BMI, diabetes, and CRP. FINRISK-92 and FINRISK-97 cohorts combined for the analysis. Analysis performed according to dominant inheritance model; hazard ratios.1 show major allele as the risk allele.
Found at doi:10.1371/journal.pgen.0030120.st011 (12 KB DOC).
Table S12.Association of the SNPs Studied with Incident Cardiovas-cular (Coronary or Ischemic Stroke) Events in Time-to-Event Analysis in Women
Covariates: age at baseline, (sex, cohort), smoking, hypertension, TC/ HDL, BMI, diabetes, and CRP. FINRISK-92 and FINRISK-97 cohorts combined for the analysis. Analysis performed according to dominant inheritance model; hazard ratios.1 show major allele as the risk allele.
Found at doi:10.1371/journal.pgen.0030120.st012 (12 KB DOC).
Table S13.Association of the SNPs Studied with Total Mortality in Time-to-Event Analysis in Both Sexes
Covariates: age at baseline, (sex, cohort), smoking, hypertension, TC/ HDL, BMI, diabetes, and CRP). FINRISK-92 and FINRISK-97 cohorts combined for the analysis. Analysis performed according to dominant inheritance model; hazard ratios.1 show major allele as the risk allele.
Found at doi:10.1371/journal.pgen.0030120.st013 (12 KB DOC).
Table S14.Association of the SNPs Studied with Incident Cardiovas-cular (Coronary or Ischemic Stroke) Events in Time-to-Event Analysis in Men
Covariates: age at baseline, (sex, cohort), smoking, hypertension, TC/ HDL, BMI, diabetes, and CRP. FINRISK-92 and FINRISK-97 cohorts combined for the analysis. Analysis performed according to dominant inheritance model; hazard ratios.1 show major allele as the risk allele.
Found at doi:10.1371/journal.pgen.0030120.st014 (12 KB DOC).
Table S15.Association of the SNPs Studied with Total Mortality in Time-to-Event Analysis in Women
Covariates: age at baseline, (sex, cohort), smoking, hypertension, TC/ HDL, BMI, diabetes, and CRP). FINRISK-92 and FINRISK-97 cohorts combined for the analysis. Analysis performed according to dominant inheritance model; hazard ratios.1 show major allele as the risk allele.
Found at doi:10.1371/journal.pgen.0030120.st015 (12 KB DOC).
Table S16. SNPs Not Chosen for Stage 2 Analyses Based on the Classification-Trees and Showingp-Values,0.05 in the Analysis for
Combined Study Cohorts Analyzed in the Separate Cohorts FINRISK-92 and FINRISK-97
Found at doi:10.1371/journal.pgen.0030120.st016 (12 KB DOC).
Accession Numbers
The National Center for Biotechnology Information LocusLink (http://www.ncbi.nlm.nih.gov/sites/entrez) GeneID numbers for the genes discussed in this paper are Coagulation factor V (F5), 2153; Intercellular adhesion molecule 1, 3383; Protein C, 5624; and Thrombomodulin, 7056.
Acknowledgments
We wish to thank all the FINRISK-92 and FINRISK-97 participants, and the Euroclot study. Siv Knaappila, Anne Nyberg, and Minna Suvela are thanked for their excellent laboratory assistance, and Samuli Ripatti, Tero Hiekkalinna, and Jaana Wessman for statistical assistance. The MORGAM data center is thanked for its participation in the data management.
Author contributions. K. Auro was responsible for the SNP selection and the data analyses, and participated in the genotyping. M. Alanne was responsible for the sample management and participated in the genotyping and the data analyses. K. Kristiansson participated in the genotyping and the data analyses. K. Silander participated in the genotyping and the whole-genome amplification of the DNA. K. Kuulasmaa participated in the study design and the assessment of the quality of the phenotypic data and the data analyses. V. Salomaa participated in the study design, recruitment of the FINRISK participants, and assessment of the clinical diagnoses. L. Peltonen participated in the study design and the data analyses. M. Perola is the principal investigator and holds responsibility of the overall study design and the data analyses. All authors participated in writing the manuscript.
Funding. This study was funded by the Finnish Foundation for Cardiovascular Research, the Biomedicum Helsinki Foundation, Sigrid Juselius Foundation, Jenny and Antti Wihuri Foundation, Aarne Koskelo Foundation, the Research Foundation of Orion Corporation, the Center of Excellence of Disease Genetics by the Academy of Finland, the GenomEUtwin-project (http://www. genomeutwin.org/) under the European Commission‘‘Quality of Life and Management of the Living Resources’’ of 5th Framework Programme (QLG2-CT-2002–01254) and National Institutes of Health/ National Heart, Lung, and Blood Institute (1R01HL70150-01A1).
Competing interests.The authors have declared that no competing interests exist.
References
1. Ma DQ, Whitehead PL, Menold MM, Martin ER, Ashley-Koch AE, et al. (2005) Identification of significant association and gene-gene interaction of GABA receptor subunit genes in autism. Am J Hum Genet 77: 377–388. 2. Maier LM, Chapman J, Howson JM, Clayton DG, Pask R, et al. (2005) No
evidence of association or interaction between the IL4RA, IL4, and IL13 genes in type 1 diabetes. Am J Hum Genet 76: 517–521.
3. Ochoa MC, Marti A, Azcona C, Chueca M, Oyarzabal M, et al. (2004) Gene-gene interaction between PPAR gamma 2 and ADR beta 3 increases obesity risk in children and adolescents. Int J Obes Relat Metab Disord 28 Suppl 3: S37–S41.
4. Weedon MN, McCarthy MI, Hitman G, Walker M, Groves CJ, et al. (2006) Combining information from common type 2 diabetes risk polymorphisms improves disease prediction. PLoS Med 3: e374. doi:10.1371/journal.pmed. 0030374
5. Frikke-Schmidt R, Sing CF, Nordestgaard BG, Steffensen R, Tybjaerg-Hansen A (2006) Subsets of SNPs define rare genotype classes that predict ischemic heart disease. Hum Genet 120: 865–877.
6. Rijneveld AW, Weijer S, Florquin S, Esmon CT, Meijers JC, et al. (2004) Thrombomodulin mutant mice with a strongly reduced capacity to generate activated protein C have an unaltered pulmonary immune response to respiratory pathogens and lipopolysaccharide. Blood 103: 1702–1709.
7. Lane DA, Grant PJ (2000) Role of hemostatic gene polymorphisms in venous and arterial thrombotic disease. Blood 95: 1517–1532.
8. Tiong IY, Alkotob ML, Ghaffari S (2003) Protein C deficiency manifesting as an acute myocardial infarction and ischaemic stroke. Heart 89: E7. 9. Cakir O, Ayyildiz O, Oruc A, Eren N (2002) A young adult with coronary
artery and jugular vein thrombosis: A case report of combined protein S and protein C deficiency. Heart Vessels 17: 74–76.
10. Shibata M, Kumar SR, Amar A, Fernandez JA, Hofman F, et al. (2001)
Anti-inflammatory, antithrombotic, and neuroprotective effects of activated protein C in a murine model of focal ischemic stroke. Circulation 103: 1799–1805.
11. Cheng T, Liu D, Griffin JH, Fernandez JA, Castellino F, et al. (2003) Activated protein C blocks p53-mediated apoptosis in ischemic human brain endothelium and is neuroprotective. Nat Med 9: 338–342. 12. Morange PE, Simon C, Alessi MC, Luc G, Arveiler D, et al. (2004)
Endothelial cell markers and the risk of coronary heart disease: the Prospective Epidemiological Study of Myocardial Infarction (PRIME) study. Circulation 109: 1343–1348.
13. Salomaa V, Matei C, Aleksic N, Sansores-Garcia L, Folsom AR, et al. (1999) Soluble thrombomodulin as a predictor of incident coronary heart disease and symptomless carotid artery atherosclerosis in the Atherosclerosis Risk in Communities (ARIC) Study: A case-cohort study. Lancet 353: 1729–1734. 14. Wu KK, Aleksic N, Ballantyne CM, Ahn C, Juneja H, et al. (2003) Interaction between soluble thrombomodulin and intercellular adhesion molecule-1 in predicting risk of coronary heart disease. Circulation 107: 1729–1732. 15. Auro K, Komulainen K, Alanne M, Silander K, Peltonen L, et al. (2006)
Thrombomodulin gene polymorphisms and haplotypes and the risk of cardiovascular events: A prospective follow-up study. Arterioscler Thromb Vasc Biol 26: 942–947.
16. Vos HL (2006) Inherited defects of coagulation Factor V: The thrombotic side. J Thromb Haemost 4: 35–40.
17. Wu KK, Aleksic N, Ahn C, Boerwinkle E, Folsom AR, et al. (2001) Thrombomodulin Ala455Val polymorphism and risk of coronary heart disease. Circulation 103: 1386–1389.
18. Spek CA, Koster T, Rosendaal FR, Bertina RM, Reitsma PH (1995) Genotypic variation in the promoter region of the protein C gene is associated with plasma protein C levels and thrombotic risk. Arterioscler Thromb Vasc Biol 15: 214–218.
al. (2006) Inflammatory gene polymorphisms and risk of postoperative myocardial infarction after cardiac surgery. Circulation 114: I275–I281. 20. Komulainen K, Alanne M, Auro K, Kilpikari R, Pajukanta P, et al. (2006)
Risk alleles of USF1 gene predict cardiovascular disease of women in two prospective studies. PLoS Genet 2: e69. doi:10.1371/journal.pgen.0020069 21. SeattleSNPs NHLBI Program for genomic applications (2005) Seattle:
SeattleSNPs. Available: http://pga.gs.washington.edu. Accessed 27 June 2007.
22. Barrett JC, Fry B, Maller J, Daly MJ (2005) Haploview: Analysis and visualization of LD and haplotype maps. Bioinformatics 21: 263–265. 23. Vandenplas S, Wiid I, Grobler-Rabie A, Brebner K, Ricketts M, et al. (1984)
Blot hybridisation analysis of genomic DNA. J Med Genet 21: 164–172. 24. Silander K, Komulainen K, Ellonen P, Jussila M, Alanne M, et al. (2005)
Evaluating whole genome amplification via multiply-primed rolling circle amplification for SNP genotyping of samples with low DNA yield. Twin Res Hum Genet 8: 368–375.
25. Evans A, Salomaa V, Kulathinal S, Asplund K, Cambien F, et al. (2005) MORGAM (an international pooling of cardiovascular cohorts). Int J Epidemiol 34: 21–27.
26. Barlow WE (1994) Robust variance estimation for the case-cohort design. Biometrics 50: 1064–1072.
27. Service S, DeYoung J, Karayiorgou M, Roos JL, Pretorious H, et al. (2006) Magnitude and distribution of linkage disequilibrium in population isolates and implications for genome-wide association studies. Nat Genet 38: 556–560.
28. Gruenewald TL, Seeman TE, Ryff CD, Karlamangla AS, Singer BH (2006) Combinations of biomarkers predictive of later life mortality. Proc Natl Acad Sci U S A 103: 14158–14163.
29. Rosendaal FR, Siscovick DS, Schwartz SM, Beverly RK, Psaty BM, et al. (1997) Factor V Leiden (resistance to activated protein C) increases the risk of myocardial infarction in young women. Blood 89: 2817–2821. 30. Voetsch B, Loscalzo J (2004) Genetic determinants of arterial thrombosis.
Arterioscler Thromb Vasc Biol 24: 216–229.
31. Ye Z, Liu EH, Higgins JP, Keavney BD, Lowe GD, et al. (2006) Seven haemostatic gene polymorphisms in coronary disease: Meta-analysis of 66,155 cases and 91,307 controls. Lancet 367: 651–658.