AMTD
6, 1311–1359, 2013MIAWARA-C – validation
B. Tschanz et al.
Title Page
Abstract Introduction
Conclusions References
Tables Figures
◭ ◮
◭ ◮
Back Close
Full Screen / Esc
Printer-friendly Version Interactive Discussion
Discussion
P
a
per
|
Dis
cussion
P
a
per
|
Discussion
P
a
per
|
Discussio
n
P
a
per
|
Atmos. Meas. Tech. Discuss., 6, 1311–1359, 2013 www.atmos-meas-tech-discuss.net/6/1311/2013/ doi:10.5194/amtd-6-1311-2013
© Author(s) 2013. CC Attribution 3.0 License.
Atmospheric Measurement
Techniques
Open Access
Discussions
Geoscientiic Geoscientiic
Geoscientiic Geoscientiic
This discussion paper is/has been under review for the journal Atmospheric Measurement Techniques (AMT). Please refer to the corresponding final paper in AMT if available.
Validation of middle atmospheric
campaign-based water vapour measured
by the ground-based microwave
radiometer MIAWARA-C
B. Tschanz1,2, C. Straub3, D. Scheiben1,2, K. A. Walker4, G. P. Stiller5, and N. K ¨ampfer1,2
1
Institute of Applied Physics, University of Bern, Bern, Switzerland
2
Oeschger Center for Climate Change Research, University of Bern, Bern, Switzerland
3
Norwegian University of Science and Technology, Trondheim, Norway
4
Department of Physics, University of Toronto, Toronto, Canada
5
Karlsruhe Institute of Technology, Institute for Meteorology and Climate Research, Karlsruhe, Germany
Received: 18 January 2013 – Accepted: 1 February 2013 – Published: 6 February 2013
Correspondence to: B. Tschanz ([email protected])
AMTD
6, 1311–1359, 2013MIAWARA-C – validation
B. Tschanz et al.
Title Page
Abstract Introduction
Conclusions References
Tables Figures
◭ ◮
◭ ◮
Back Close
Full Screen / Esc
Printer-friendly Version Interactive Discussion
Discussion
P
a
per
|
Dis
cussion
P
a
per
|
Discussion
P
a
per
|
Discussio
n
P
a
per
|
Abstract
Middle atmospheric water vapour can be used as a tracer for dynamical processes. It is mainly measured by satellite instruments and ground-based microwave radiometers. Ground-based instruments capable of measuring middle atmospheric water vapour are sparse but valuable as they complement satellite measurements, are relatively easy to
5
maintain and have a long lifetime. MIAWARA-C is a ground-based microwave radiome-ter for middle atmospheric waradiome-ter vapour designed for use on measurement campaigns for both atmospheric case studies and instrument intercomparisons. MIAWARA-C’s re-trieval version 1.1 (v1.1) is set up in a way to provide a consistent data set even if the instrument is operated from different locations on a campaign basis. The sensitive
10
altitude range for v1.1 extends from 4 hPa (37 km) to 0.017 hPa (75 km). MIAWARA-C measures two polarisations of the incident radiation in separate receiver channels and can therefore provide two independent measurements of the same air mass. The stan-dard deviation of the difference between the profiles obtained from the two polarisations is in excellent agreement with the estimated random error of v1.1. In this paper, the
15
quality of v1.1 data is assessed during two measurement campaigns: (1) five months of measurements in the Arctic (Sodankyl ¨a, 67.37◦N/26.63◦E) and (2) nine months of measurements at mid-latitudes (Zimmerwald, 46.88◦N/7.46◦E). For both campaigns MIAWARA-C’s profiles are compared to measurements from the satellite experiments Aura MLS and MIPAS. In addition, comparisons to ACE-FTS and SOFIE are presented
20
for the Arctic and to the ground-based radiometer MIAWARA for the mid-latitudinal campaign. In general all intercomparisons show high correlation coefficients, above 0.5 at altitudes above 45 km, confirming the ability of MIAWARA-C to monitor tempo-ral variations on the order of days. The biases are genetempo-rally below 10 % and within the estimated systematic uncertainty of MIAWARA-C. No consistent wet or dry bias is
iden-25
AMTD
6, 1311–1359, 2013MIAWARA-C – validation
B. Tschanz et al.
Title Page
Abstract Introduction
Conclusions References
Tables Figures
◭ ◮
◭ ◮
Back Close
Full Screen / Esc
Printer-friendly Version Interactive Discussion
Discussion
P
a
per
|
Dis
cussion
P
a
per
|
Discussion
P
a
per
|
Discussio
n
P
a
per
|
1 Introduction
Water vapour is a trace gas that plays a major role in radiative, chemical and het-erogeneous processes in the atmosphere. It enters the stratosphere mainly through the tropical transition layer. Due to the cold tropopause temperatures in the tropics dry-freezing takes place resulting in an extremely dry lower stratosphere. The second
5
source of middle atmospheric water vapour is the oxidation of methane leading to a positive vertical gradient in volume mixing ratio (VMR) throughout the stratosphere. The increasing photo-dissociation with altitude results in a negative gradient in the mesosphere. The latitudinal distribution of water vapour is mainly given by the large scale residual circulation.
10
The chemical lifetime of water vapour is in the order of months in the stratosphere and decreases to weeks in the mesosphere (Brasseur et al., 1999). Because of its chemical stability, water vapour can be used as a tracer for dynamics wherever hori-zontal or vertical gradients exist. For recent studies using water vapour as a tracer see e.g. Lossow et al. (2009), Lee et al. (2011), Straub et al. (2012), Scheiben et al. (2012).
15
In the middle atmosphere water vapour is mainly measured by satellite instruments using infrared or microwave radiation and ground-based microwave radiometers. Satel-lite measurements offer good global coverage and good vertical resolution depending on the measurement technique but include horizontal averaging. Ground-based mi-crowave instruments for water vapour deliver vertical profiles above the measurement
20
site with high temporal but coarse vertical resolution.
There are several microwave radiometers for middle atmospheric water vapour cur-rently in operation on a regular basis. Recent validation efforts (e.g. Haefele et al., 2009; Nedoluha et al., 2011; Straub et al., 2011) have demonstrated the reliability of this technique. Validation studies are an important tool to asses the data quality of
25
AMTD
6, 1311–1359, 2013MIAWARA-C – validation
B. Tschanz et al.
Title Page
Abstract Introduction
Conclusions References
Tables Figures
◭ ◮
◭ ◮
Back Close
Full Screen / Esc
Printer-friendly Version Interactive Discussion
Discussion
P
a
per
|
Dis
cussion
P
a
per
|
Discussion
P
a
per
|
Discussio
n
P
a
per
|
This paper presents a validation of water vapour measured by the ground-based MId-dle Atmospheric WAter vapour RAdiometer for Campaigns MIAWARA-C. MIAWARA-C is a transportable instrument and has proven to provide reliable measurements. It is planned to operate MIAWARA-C within the Network for the Detection of Atmospheric Composition Change (NDACC) as a travelling standard. Therefore, the quality of the
5
measured water vapour profiles is assessed in this study. The validation is based on re-sults from the Lapland Atmosphere-Biosphere Facility (LAPBIAT) campaign from Jan-uary to June 2010 in polar latitudes and from Zimmerwald, a mid-latitude station near Bern, from July 2010 to May 2011. Reference data from another ground-based mi-crowave instrument, MIAWARA, as well as satellite data from the Atmospheric
Chem-10
istry Experiment Fourier Transform Spectrometer (ACE-FTS), the Solar Occultation For Ice Experiment (SOFIE), the Michelson Interferometer for Passive Atmospheric Sound-ing (MIPAS) and from the Aura Microwave Limb Sounder (MLS) are used.
The article is organised as follows. In Sect. 2 the characteristics of MIAWARA-C and its retrieval are presented. The different reference experiments are described in Sect. 3
15
including results from previous water vapour intercomparison studies. After introducing the coincident data sets and the method of intercomparison (Sect. 4) the results are presented in Sect. 5. Section 6 summarises the results and Sect. 7 draws conclusions.
2 MIAWARA-C
The ground-based microwave radiometer MIAWARA-C measures the rotational
emis-20
AMTD
6, 1311–1359, 2013MIAWARA-C – validation
B. Tschanz et al.
Title Page
Abstract Introduction
Conclusions References
Tables Figures
◭ ◮
◭ ◮
Back Close
Full Screen / Esc
Printer-friendly Version Interactive Discussion
Discussion
P
a
per
|
Dis
cussion
P
a
per
|
Discussion
P
a
per
|
Discussio
n
P
a
per
|
2.1 Instrument
MIAWARA-C is a compact radiometer equipped with its own weather station and is de-signed for use in measurement campaigns. The whole instrument, frontend, backend and computer, is placed in the same housing with a rain hood that closes automatically whenever there is precipitation or strong winds to prevent damage to the instrument.
5
In order to operate MIAWARA-C, the instrument is just connected to power and the Internet and can then be controlled remotely. The calibration does not depend on any other instrument nor on liquid nitrogen and therefore does not require intervention of an on-site operator. MIAWARA-C’s optical system consists of a very compact choked Gaussian horn antenna and a parabolic off-axis mirror. It has a total length of
approxi-10
mately 50 cm which is very short in comparison to other 22 GHz radiometers.
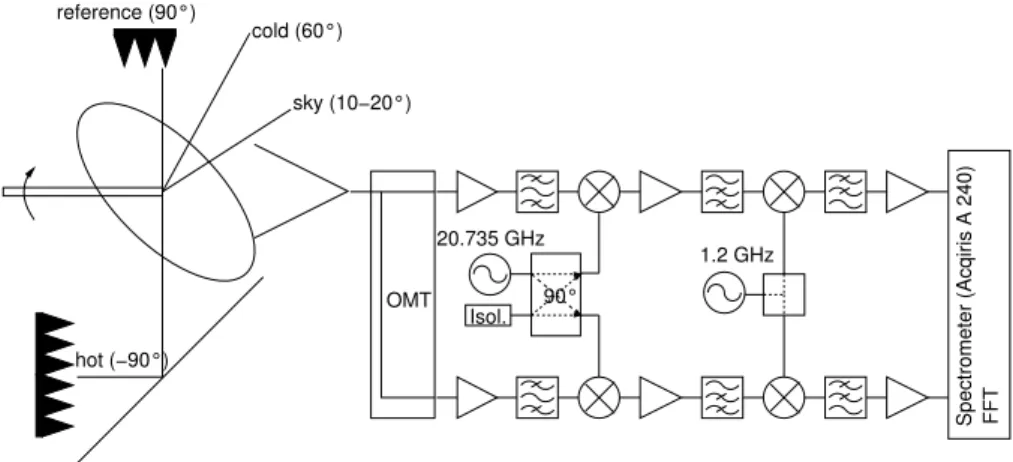
The receiver of MIAWARA-C consists of two identical receiver chains separated im-mediately after the antenna. Originally, the receiver was used as a correlation receiver with a noise source as internal calibration load and a digital cross correlating spectrom-eter for data acquisition. In December 2010 there was a major upgrade of the receiver
15
of MIAWARA-C: the correlation receiver was replaced by a dual-polarisation receiver as shown in Fig. 1. In this new setup the incident radiation is split into vertical and hor-izontal polarisation by an orthomode transducer (OMT) placed immediately after the antenna. The two polarised signals are processed in the two identical receiver chains and separately analysed in the digital Fast Fourier Transform (FFT) spectrometer with
20
a spectral resolution of 30.5 kHz and a usable bandwidth of 400 MHz.
In order to calibrate the measurements a balancing scheme is applied consisting of a line measurement at a low elevation angle (10◦to 18◦) and a reference measurement of the sky at zenith with a microwave absorber inserted. The elevation angle of the line measurement is continuously adjusted to balance the reference measurement. For the
25
AMTD
6, 1311–1359, 2013MIAWARA-C – validation
B. Tschanz et al.
Title Page
Abstract Introduction
Conclusions References
Tables Figures
◭ ◮
◭ ◮
Back Close
Full Screen / Esc
Printer-friendly Version Interactive Discussion
Discussion
P
a
per
|
Dis
cussion
P
a
per
|
Discussion
P
a
per
|
Discussio
n
P
a
per
|
representing the cold load. The brightness temperature of the cold load is determined with regular tipping curve measurements. For details, see Straub et al. (2010).
The two polarised signals measured by the two receiver chains of the dual-polarisation receiver are calibrated separately. The two measurements,y1andy2, with noise levels, σ1 and σ2, share the same optical system and can therefore be either
5
regarded as two independent measurements of the same airmass or they can be com-bined into one spectrum which has the advantage of lower measurement noise. Both polarised spectra are weighted according to their noise levels to obtain the combined spectrum,y:
y =
σ22y1+σ12y2
σ12+σ22 . (1)
10
A number of measured spectra need to be averaged in order to achieve a sufficiently high signal to noise ratio for the profile retrieval. For MIAWARA-C spectra are averaged until a noise level of 0.014 K is reached. Averaging to a fixed noise level has the advan-tage that the retrieved profiles cover an almost constant altitude range and therefore, this method is chosen over integration over a fixed time interval. The temporal
res-15
olution for spectra of a certain noise level depends on the tropospheric opacity, the calibration scheme, the observation geometry of the instrument as well as on the noise temperature and type of the receiver (Straub et al., 2011).
MIAWARA-C and its calibration scheme have gradually been improved to increase the temporal resolution. The upgrade to the dual-polarisation receiver reduced the
in-20
tegration time by a factor of 4 compared to the correlation receiver allowing more than one profile per hour to be retrieved under favourable tropospheric conditions and using the combined spectrum. The number of profiles per day obtained by MIAWARA-C is presented in Fig. 2. With the correlation receiver it was not possible to get more than 5 profiles per day, whereas with the dual-polarisation receiver more than 10 profiles
25
AMTD
6, 1311–1359, 2013MIAWARA-C – validation
B. Tschanz et al.
Title Page
Abstract Introduction
Conclusions References
Tables Figures
◭ ◮
◭ ◮
Back Close
Full Screen / Esc
Printer-friendly Version Interactive Discussion
Discussion
P
a
per
|
Dis
cussion
P
a
per
|
Discussion
P
a
per
|
Discussio
n
P
a
per
|
obtained during winter months when the troposphere is drier. For more humid con-ditions, the integration time is slightly increased, e.g. measurements from Sodankyl ¨a during the humid summer months of June to August in 2011 show that it is still possible to retrieve 10 or more profiles on 40 % of all measurement days. Such a high temporal resolution above one location cannot be achieved by current satellite instruments. The
5
good temporal resolution is exceptional for middle atmospheric water vapour measure-ments and, together with its reliability, is one of the major benefits of MIAWARA-C.
2.2 Profile retrieval and auxiliary data
The inversion, retrieving an altitude profile from the measured spectra, is based on Op-timal Estimation theory including a priori knowledge on the vertical water vapour profile
10
distribution and is described in Rodgers (2000). For the retrieval, the Atmospheric Ra-diative Transfer Simulator (ARTS) is used as a forward model together with the software package Qpack (Buehler et al., 2005; Eriksson et al., 2011, 2005). A general descrip-tion of the profile retrieval for MIAWARA-C can be found in Straub et al. (2010).
Ground-based microwave radiometers can be used to retrieve middle atmospheric
15
water vapour profiles over a limited altitude range. This altitude range is mainly given by a combination of the altitude dependent shape of the pressure broadened line and the frequency resolution, bandwidth and spectral baseline of the instrument. Outside of the sensitive range the retrieved profile ˆx is approaching the a priori profile xa. The relationship between true (x), a priori (xa) and retrieved state ( ˆx) is given by the
20
averaging kernel matrixA:
ˆ
x=Ax+(I−A)xa+Dyǫ, (2)
whereDy =∂xˆ
∂y is the contribution function and describes the sensitivity of the retrieved profile,xˆ, to the measurement,y, andǫis the noise on the spectrum. The Maximum a Posteriori Solution ˆxis given by
25
ˆ
x=xa+SaKT
KSaKT+Sǫ −1
AMTD
6, 1311–1359, 2013MIAWARA-C – validation
B. Tschanz et al.
Title Page
Abstract Introduction
Conclusions References
Tables Figures
◭ ◮
◭ ◮
Back Close
Full Screen / Esc
Printer-friendly Version Interactive Discussion
Discussion
P
a
per
|
Dis
cussion
P
a
per
|
Discussion
P
a
per
|
Discussio
n
P
a
per
|
whereSais the a priori covariance matrix,K=
∂y
∂x the Jacobian of the forward model,y the measured spectrum andSǫ the covariance matrix of the spectral noise. In addition to the a priori statistics of water vapour, several auxiliary parameters used in the forward model need to be specified.
The aim of this study was to set-up a retrieval version that is consistent for both
5
receivers (the correlation and the dual-polarisation receiver) and for all past campaigns of MIAWARA-C. The retrieval version v1.1, whose specifications are presented below, fulfils these requirements. Depending on the application, other retrieval versions might be favourable.
The a priori profile information xa is taken from a monthly mean zonal mean
cli-10
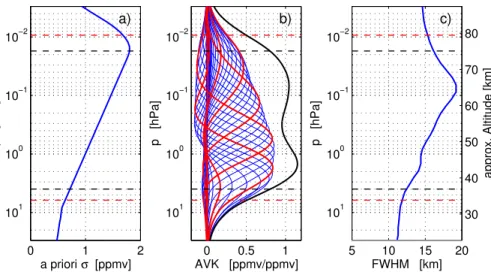
matology using Aura MLS version 3.3 (v3.3) data from 2004 to 2008. Aura MLS v3.3 covers the whole altitude range of MIAWARA-C and is available for all campaign sites. The monthly climatology is interpolated linearly to the day of the measurement to avoid discontinuities. The a priori covariance matrix,Sa, used has fixed VMR values and the square root of its diagonal elements are shown in Fig. 3a. The a priori standard
devi-15
ation increases from 0.72 ppmv at 3.8 hPa to 1.8 ppmv at 0.017 hPa. In addition to the diagonal elements, the shape ofSais defined as exponentially decreasing toward the off-diagonal elements with a correlation length of 4 km.
For the forward model calculations, a temperature profile is needed. For consistency of v1.1 the temperature profiles should be available for all of MIAWARA-C’s past
cam-20
paign sites. Therefore, temperature profiles together with pressure and geopotential height information (ptz grid) from Aura MLS v3.3 are used. A mean value of all tem-perature profiles with a maximal longitudinal distance of 800 km, a maximal latitudinal distance of 400 km from the measurement site and within two days of the measurement time is used. MLS v3.3 temperatures have vertical/horizontal resolution of 7 km/165 km
25
at 1 hPa and 8–12 km/185 km at 0.01 hPa and a precision of 1 K at 1 hPa and 2.2 K at 0.01 hPa (Livesey et al., 2011).
AMTD
6, 1311–1359, 2013MIAWARA-C – validation
B. Tschanz et al.
Title Page
Abstract Introduction
Conclusions References
Tables Figures
◭ ◮
◭ ◮
Back Close
Full Screen / Esc
Printer-friendly Version Interactive Discussion
Discussion
P
a
per
|
Dis
cussion
P
a
per
|
Discussion
P
a
per
|
Discussio
n
P
a
per
|
hyperfine splitting of the 22 GHz line is taken into account. Due to the frequency reso-lution of the spectrometer of MIAWARA-C not all split lines are in the range of a single channel. The intensity is divided into the three frequencies with the highest branching ratios. The sum of the branching ratio of these three lines is larger than 99 % (Seele, 1999). Specifications of the line parameters are presented in Table 1.
5
The forward model only includes the atmosphere as seen by a perfectly described instrument. The spectral baseline, which we define as all contributions to the spec-trum not covered by the forward model, is removed by allowing the Optimal Estimation to fit a polynomial. For MIAWARA-C v1.1, a spectrum with 80 MHz bandwidth and a polynomial fit of degree 2 is used.
10
The averaging kernels for a typical MIAWARA-C v1.1 retrieval are shown in Fig. 3b. For MIAWARA-C we define the reliable range of the retrieval as the region with the area of the averaging kernel (AoA) larger than 0.8. Outside of this range, the amplitude of the averaging kernel starts to shrink. In addition, the difference between the peak height of the averaging kernels and their nominal altitude increases revealing not only
15
an increase in a priori contribution but also the loss of altitude dependent information. For the intercomparison presented here, MIAWARA-C’s data is shown in the altitude range with AoA>0.5 and the reliable altitude range with AoA>0.8 is marked with horizontal dashed lines in the relevant figures.
An estimation of the vertical resolution is obtained from the full width at half
max-20
imum (FWHM) of the averaging kernels. This estimate, presented in Fig. 3c, shows that the vertical resolution changes with altitude from 12 km to a maximum of 19 km. The horizontal resolution is given by the antenna pattern. The half power beam width (HPBW) of 5◦at typical elevation angles of 17.5◦(12.5◦) leads to a horizontal resolution of approximately 40 (77) km at 40 km and 70 (135) km at 70 km.
25
AMTD
6, 1311–1359, 2013MIAWARA-C – validation
B. Tschanz et al.
Title Page
Abstract Introduction
Conclusions References
Tables Figures
◭ ◮
◭ ◮
Back Close
Full Screen / Esc
Printer-friendly Version Interactive Discussion
Discussion
P
a
per
|
Dis
cussion
P
a
per
|
Discussion
P
a
per
|
Discussio
n
P
a
per
|
a bandwidth of 80 MHz and allowing a polynomial fit of degree 2, no relevant baseline remains that could lead to unphysical oscillations in the retrieved profile.
2.3 Error characterisation
The error estimation for MIAWARA-C’s profiles is based on Rodgers (2000) and per-formed using the software package Qpack. Thorough discussions of the error
charac-5
terisation for 22 GHz radiometers are presented in Straub et al. (2010) and De Wachter et al. (2011). A posteriori covariance matrices are calculated for different families of uncertainty, namely measurement noise, calibration (including pointing uncertainty), spectroscopic parameters and temperatures used in the forward model. The smooth-ing error can be ignored as long as the profiles to be compared have a similar vertical
10
resolution. The a posteriori covariance matrices are determined by the a priori covari-ance matrices of the different quantities and their influence on the forward model, and also by the a priori covariance matrixSa. Therefore, the estimated error depends on the choice of Sa. MIAWARA-C v1.1 uses a constant Sa defined in VMR resulting in error estimations approximately constant in VMR.
15
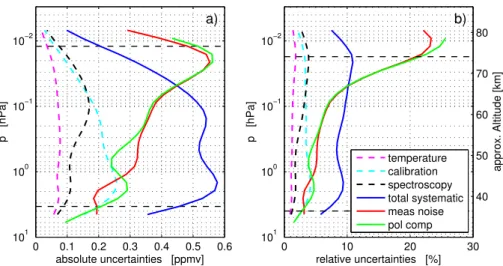
The uncertainties calculated for MIAWARA-C v1.1, based on the uncertainty esti-mates of the forward model parameters presented in Table 2, are displayed in Fig. 5. They are separated into two categories: random error and systematic error. The ran-dom error is the 1-σ uncertainty determined by propagation of the noise on the mea-sured spectrum (0.014 K). As a systematic error estimation the 2-σ root mean square
20
error originating from uncertainties in the temperature profile, in the spectroscopic pa-rameters and in the calibration is used. 2-σ is taken as systematic error in order to obtain an upper limit.
The systematic error of MIAWARA-C v1.1 is between 8 and 11 % for all altitudes. The random error at 45 km (1.1 hPa) is 5 % and increases with altitude to approximately
25
AMTD
6, 1311–1359, 2013MIAWARA-C – validation
B. Tschanz et al.
Title Page
Abstract Introduction
Conclusions References
Tables Figures
◭ ◮
◭ ◮
Back Close
Full Screen / Esc
Printer-friendly Version Interactive Discussion
Discussion
P
a
per
|
Dis
cussion
P
a
per
|
Discussion
P
a
per
|
Discussio
n
P
a
per
|
The dual-polarisation receiver of MIAWARA-C allows the random error on the mea-sured profiles to be determined directly from the measurements. For this purpose, instead of combining the spectra of the two polarisations as described in Eq. (1), we integrate the spectra of each receiver separately over the same time period resulting in a perfect coincidence. The integrated spectra from both receiver channels are
anal-5
ysed separately using the same retrieval setup as v1.1. As the atmospheric conditions and sampled air mass, as well as the instrumental and retrieval setup for both esti-mated profiles are exactly the same, the difference between them is dominated by the measurement noise. Therefore, the standard deviation of the set of difference profiles between the two polarisations divided by√2 is a direct observation of the random error
10
caused by the measurement noise.
Profiles are retrieved separately from the two polarisations from 17 December 2010 to 9 May 2011 resulting in 1217 profile pairs. The standard deviation of the difference, which is equal to the observed variability, is shown together with the estimated errors in Fig. 5a and b. The random errors estimated by propagating the spectral noise are in
15
good agreement with the random errors determined from the difference in the retrieved profiles for all altitudes. This indicates that the noise on MIAWARA-C’s retrieved profiles agrees well with the estimation based on propagation of spectral noise.
3 Reference instruments
Characteristics of the reference instruments used for the validation of MIAWARA-C’s
20
v1.1 are presented in the following sections. An overview of the vertical resolution of the instruments is shown in Fig. 6.
3.1 MIAWARA
MIAWARA is the first 22 GHz radiometer for middle atmospheric water vapour built at the Institute of Applied Physics (Deuber et al., 2004). Since September
AMTD
6, 1311–1359, 2013MIAWARA-C – validation
B. Tschanz et al.
Title Page
Abstract Introduction
Conclusions References
Tables Figures
◭ ◮
◭ ◮
Back Close
Full Screen / Esc
Printer-friendly Version Interactive Discussion
Discussion
P
a
per
|
Dis
cussion
P
a
per
|
Discussion
P
a
per
|
Discussio
n
P
a
per
|
2006 it is measuring permanently from Zimmerwald (Switzerland, 46.88◦N/7.46◦E, 907 m a.m.s.l.). After replacing the previously used acousto-optical spectrometer by a digital FFT spectrometer in 2007, the frontend and the backend have remained un-changed. MIAWARA is operated within NDACC and is used for long-term monitoring of middle atmospheric water vapour and case studies of atmospheric processes.
5
MIAWARA and MIAWARA-C mainly differ in size and compactness and in their re-ceiver. The part of MIAWARA which is operated outdoors is more than twice as large as MIAWARA-C. In addition, the backend of MIAWARA needs to be located indoors. MIAWARA-C has two identical receiver chains whereas MIAWARA has only one result-ing in an increased integration time to cover the same altitude range. For MIAWARA
10
the measured spectra are averaged until a noise level of 0.01 K is reached. This is approximately equivalent to the 0.014 K noise level for MIAWARA-C as MIAWARA’s spectral resolution (61 kHz) is coarser by a factor of two compared to MIAWARA-C.
The retrieval version of MIAWARA used in this study applies the same auxiliary data as MIAWARA-C’s v1.1. The vertical resolution of both ground-based microwave
ra-15
diometers is the same. Haefele et al. (2009) found a bias of±3 % when comparing a similar retrieval version of MIAWARA to Aura MLS version 2.2 (v2.2).
MIAWARA data from July 2010 to May 2011 are used as during this time both in-struments have been operated from the same location. In this period, the temporal resolution of MIAWARA was significantly improved by changing the elevation angle of
20
the line measurements and by installing a faster mirror drive (in mid September 2010). These changes improved the integration time from the order of days to hours.
3.2 Aura MLS
Aura MLS is on board NASA’s Aura satellite which was launched in July 2004. Aura MLS covers latitudes between 82◦S and 82◦N. Due to its Sun-synchronous polar orbit
25
AMTD
6, 1311–1359, 2013MIAWARA-C – validation
B. Tschanz et al.
Title Page
Abstract Introduction
Conclusions References
Tables Figures
◭ ◮
◭ ◮
Back Close
Full Screen / Esc
Printer-friendly Version Interactive Discussion
Discussion
P
a
per
|
Dis
cussion
P
a
per
|
Discussion
P
a
per
|
Discussio
n
P
a
per
|
Both v2.2 and v3.3 water vapour products are used for the intercomparison. For v2.2, a thorough validation is given in Lambert et al. (2007). A bias of less than±5 % was found for all altitudes when comparing to ACE-FTS. For v3.3, the quality and de-scription document (Livesey et al., 2011) is used to characterise the data. The vertical resolution of v2.2/v3.3 is 4.6/2.5 km at 1 hPa and 12/10 km at 0.01 hPa and the
hor-5
izontal resolution is 410/410 km at 1 hPa and 390/680 km at 0.01 hPa. Single profile precisions are 4/7 % at 1 hPa and 34/54 % at 0.01 hPa with a systematic error of 4/4 % and 11/11 %, respectively.
3.3 MIPAS
MIPAS is a mid-infrared limb emission Fourier transform spectrometer on board the
10
Envisat satellite. It was operational from July 2002 to April 2012. It was designed to measure vertical profiles of temperature and a large variety of minor species includ-ing water vapour with global latitudinal coverage. From March 2004, it was operat-ing with reduced spectral resolution. A description of MIPAS is given in Fischer et al. (2008). In our study we use MIPAS water vapour data version V5R H2O 220 obtained
15
in nominal observation mode and processed by the Institute of Meteorology and Cli-mate Research (IMK) at the Karlsruhe Institute of Technology in cooperation with the Instituto de Astrofisica de Andalucia (IAA). This retrieval version is based on ESA level 1 spectra from version IPF 5. The MIPAS version V5R H2O 220 water vapour has a vertical resolution of 2.3 km at 20 km and 6.9 km at 50 km and the horizontal
resolu-20
tion is 206 km at 20 km and 436 km at 40 km. Single profile precisions are 0.2 ppmv at 10 km and 0.92 ppmv at 50 km. Version V5R H2O 220 has not yet been validated but V4O H2O 203 has recently been compared using water vapour measurements obtained during the MOHAVE-2009 campaign (Leblanc et al., 2011). MIAWARA-C was one of the instruments participating in measuring water vapour and is included
25
AMTD
6, 1311–1359, 2013MIAWARA-C – validation
B. Tschanz et al.
Title Page
Abstract Introduction
Conclusions References
Tables Figures
◭ ◮
◭ ◮
Back Close
Full Screen / Esc
Printer-friendly Version Interactive Discussion
Discussion
P
a
per
|
Dis
cussion
P
a
per
|
Discussion
P
a
per
|
Discussio
n
P
a
per
|
45 km MIPAS V4O H2O 203 showed a wet bias of up to 10 % and above 55 km a dry bias caused by neglecting non-local thermodynamic equilibrium (non-LTE) effects in the retrieval (Stiller et al., 2012). V5R H2O 220 does not yet include non-LTE effects and therefore, a similar behaviour with altitude is expected. For that reason MIPAS V5R H2O 220 data are not used for altitudes above 0.1 hPa. All IMK/IAA MIPAS water
5
vapour data after 2005 are retrieved as log(VMR), although provided as VMR. This has to be considered when using the averaging kernel of MIPAS for convolution, since it refers to log(VMR) as well.
3.4 ACE-FTS
ACE-FTS is operating on board the Canadian SCISAT-1 satellite which was launched in
10
August 2003. Routine operations started in February 2004. ACE-FTS is measuring in solar occultation mode and covers 85◦S–85◦N with the majority of the measurements occurring in the polar regions. A mission description is given in Bernath et al. (2005). The retrieval of water vapour is described in Boone et al. (2005). Water vapour profiles are retrieved between 5 to 90 km. A first validation of ACE-FTS v2.2 is presented in
15
Carleer et al. (2008). This shows a slight positive bias smaller than 10 % in the alti-tude range from 15 to 70 km versus MIPAS (version 13, full resolution mode), SAGE II, HALOE, POAM III and Odin-SMR. In this study, ACE-FTS v3.0 is used. Between approximately 20 and 55 km, there are small differences of the order of±2 % between ACE-FTS v2.2 and v3.0. The vertical resolution of ACE-FTS is determined by the field
20
of view and is 3–4 km throughout the whole altitude range. The random uncertainty given in the data files is generally 2–5 % for altitudes between 20 and 80 km.
3.5 SOFIE
SOFIE is on board the Aeronomy of Ice in the Mesosphere (AIM) satellite, which was launched in April 2007. Latitudes of ≈65◦–85◦ South and North are covered. Details
25
AMTD
6, 1311–1359, 2013MIAWARA-C – validation
B. Tschanz et al.
Title Page
Abstract Introduction
Conclusions References
Tables Figures
◭ ◮
◭ ◮
Back Close
Full Screen / Esc
Printer-friendly Version Interactive Discussion
Discussion
P
a
per
|
Dis
cussion
P
a
per
|
Discussion
P
a
per
|
Discussio
n
P
a
per
|
v1.022 water vapour is presented in Rong et al. (2010) revealing excellent agreement (0 %–2 %) in the Northern Hemisphere compared to ACE-FTS v2.2 and Aura MLS v2.2 in the vertical range 45–80 km. Water vapour profiles are available for the altitude range from 15 to 95 km. The tangent path length is approximately 280 km and the vertical resolution is 2 km throughout the whole altitude range. This study uses the v1.2 water
5
vapour product. SOFIE has a high sensitivity resulting in low random uncertainties of less than 0.8 % for altitudes below 75 km as given in the data files. The total systematic error is below 4 % for the altitude range used.
4 Data and method
In the following sections, the coincidence criteria and the resulting data sets are
pre-10
sented and the intercomparison method is introduced.
4.1 Coincident data sets
For this intercomparison study two data sets of MIAWARA-C obtained at two different sites are used, one in the polar region and one in the mid-latitudes. From January to June 2010, MIAWARA-C was measuring at the Arctic Research Centre in Sodankyl ¨a
15
(Finland, 67.37◦N/26.63◦E, 180 m a.m.s.l.) in the frame of the LAPBIAT 2010 cam-paign. The second data set spans from July 2010 to May 2011 in Zimmerwald (Switzer-land, 46.88◦N/7.46◦E, 907 m a.m.s.l.). In the LAPBIAT campaign and the first part of the Zimmerwald campaign MIAWARA-C was still equipped with its original correlation receiver, which was replaced by the dual-polarisation receiver in December 2010 for
20
the second part of the Zimmerwald campaign.
AMTD
6, 1311–1359, 2013MIAWARA-C – validation
B. Tschanz et al.
Title Page
Abstract Introduction
Conclusions References
Tables Figures
◭ ◮
◭ ◮
Back Close
Full Screen / Esc
Printer-friendly Version Interactive Discussion
Discussion
P
a
per
|
Dis
cussion
P
a
per
|
Discussion
P
a
per
|
Discussio
n
P
a
per
|
for Zimmerwald because the number of coincident profiles for ACE-FTS is too small and SOFIE does not cover mid-latitudes.
Spatial coincidence is determined from the difference in latitude and longitude be-tween MIAWARA-C’s station location and a representative altitude in the satellite pro-file. The viewing direction of MIAWARA-C was South during the LAPBIAT campaign
5
whereas the instrument was pointing North while measuring from Zimmerwald. There-fore, the criterion for collocation used for the satellite data is +1◦/−2◦ in latitude for LAPBIAT and +2◦/−1◦ in latitude for Zimmerwald and ±10◦ in longitude for both pe-riods. The winter data of the LAPBIAT campaign are obtained in the vicinity of the vortex edge where steep horizontal gradients of water vapour are present. However,
10
all instruments used for the validation study have a coarse horizontal resolution, in some cases up to several hundred kilometres, due to observation geometries and an-tenna patterns. Hence, the effect of sampling different air masses is reduced due to the horizontal smoothing. Changing the latitudinal coincidence criterion for LAPBIAT by a degree north or south did not considerably change the outcome of the
intercompari-15
son. Therefore, no additional coincidence criterion separating the measured air masses according to the potential vorticity is applied.
After applying the spatial coincidence criterion, the profile pair (MIAWARA-C – refer-ence measurement) that is closest in time is sought. All profiles are only used once to avoid inter-dependencies in the data set. In addition, a maximal temporal difference of
20
12 h for the satellites and 6 h for MIAWARA is applied.
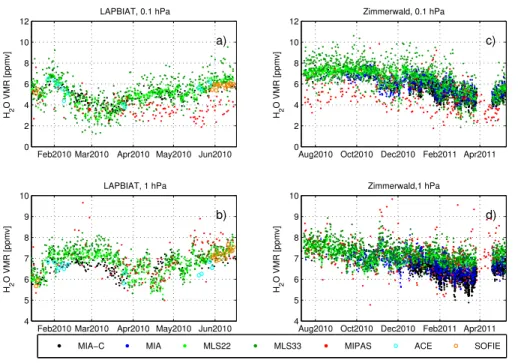
An overview of the time series used for the intercomparison at the two locations is shown in Fig. 7 for 1 and 0.1 hPa. The numbers of profiles fulfilling the coincidence criterion for the intercomparison are summarised in Table 3.
The different vertical resolution of the instruments (Fig. 6) is taken into account for
25
AMTD
6, 1311–1359, 2013MIAWARA-C – validation
B. Tschanz et al.
Title Page
Abstract Introduction
Conclusions References
Tables Figures
◭ ◮
◭ ◮
Back Close
Full Screen / Esc
Printer-friendly Version Interactive Discussion
Discussion
P
a
per
|
Dis
cussion
P
a
per
|
Discussion
P
a
per
|
Discussio
n
P
a
per
|
compared to MIAWARA-C’s. Aura MLS v3.3 is regarded as highly resolved even though the vertical resolution at the uppermost altitude level with MIAWARA-C’s AoA>0.8 is comparable. Hence, these satellite profiles need to be convolved with the averaging kernels of the ground-based radiometer in order to make them comparable:
xhigh, conv=A xhigh−xa+xa (4)
5
wherexhigh is the satellite profile, A the averaging kernel matrix and xa the a priori profile of the ground-based radiometer. The convolution decreases the vertical reso-lution and accounts for the a priori contribution of MIAWARA-C v1.1. In the reliable altitude range of MIAWARA-C v1.1 with AoA>0.8, the contribution of the a priori pro-file is small. To account for the additional smoothing introduced by the convolution, the
10
covariance matrix of the profile with higher resolution,Shigh, is transformed as well. The resolution corrected covariance matrixShigh, conv belonging toxhigh, convis given by
Shigh,conv =AShighAT. (5)
The square root of the diagonal elements ofShigh, conv are the transformed error esti-mates belonging toxhigh, conv.
15
Aura MLS v2.2 has comparable resolution above 0.1 hPa and higher resolution at lower altitudes. Hence, the convolved profile is used below 0.1 hPa and it is compared directly above 0.1 hPa. The profiles of MIAWARA-C and MIAWARA have the same vertical resolution and can directly be compared.
4.2 Intercomparison strategy
20
AMTD
6, 1311–1359, 2013MIAWARA-C – validation
B. Tschanz et al.
Title Page
Abstract Introduction
Conclusions References
Tables Figures
◭ ◮
◭ ◮
Back Close
Full Screen / Esc
Printer-friendly Version Interactive Discussion
Discussion
P
a
per
|
Dis
cussion
P
a
per
|
Discussion
P
a
per
|
Discussio
n
P
a
per
|
sets, the profiles are given together with corresponding pressure as vertical coordi-nate. The reference profiles are interpolated to MIAWARA-C’s pressure grid. The inter-polated reference profiles are either compared directly or convolved with MIAWARA-C’s averaging kernels using Eq. (4).
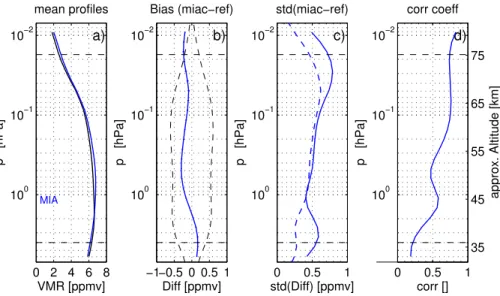
All comparison plots have the same structure (Figs. 8, 9, 10, 11, 12). In panel a,
5
the mean coincident profiles from MIAWARA-C and from the reference instrument are shown.
Panel b shows the biasbi which is the mean of the differences between MIAWARA-C and reference instrument at altitude level i. The standard error of the bias σi,bias is shown as horizontal error bars in panel b. For large coincident data setsσi,biasis hardly
10
visible. The bias is considered as clearly insignificant if the intervalbi±σi,biasincludes zero. In addition, the bias is compared to the estimated systematic error. The sys-tematic error of the reference instrument is assumed to be negligible reducing the combined estimated systematic error to the systematic error of MIAWARA-C. A bias outside the range of the estimated systematic error hints towards either a not corrected
15
bias of the reference instrument or an underestimation of MIAWARA-C’s systematic error.
Panel c presents a validation of the random error. The error provided along with the satellite profiles is assumed to be purely random and together with the estimated random error of MIAWARA-C builds the combined estimated random error. The bias
20
corrected standard deviation of the difference profiles σi,diff, herein called observed variability, is expected to be equal to the combined estimated random error of the struments neglecting non-perfect coincidence. Non-perfect coincidence results in in-creased observed variability due to variations in atmospheric water vapour in both space and time. Therefore, observed variability larger than the combined random error
25
can either be explained by non-perfect coincidence or underestimation of the random error of MIAWARA-C or of the reference instrument.
AMTD
6, 1311–1359, 2013MIAWARA-C – validation
B. Tschanz et al.
Title Page
Abstract Introduction
Conclusions References
Tables Figures
◭ ◮
◭ ◮
Back Close
Full Screen / Esc
Printer-friendly Version Interactive Discussion
Discussion
P
a
per
|
Dis
cussion
P
a
per
|
Discussion
P
a
per
|
Discussio
n
P
a
per
|
the comparison plots. The correlation coefficient of the coincident profiles is reduced by non-perfect coincidence and by the random errors of the instruments. Only significant correlation coefficients are displayed at the 95 % confidence level.
5 Results of the intercomparison
The results of the intercomparison following the description given in Sect. 4.2 are
pre-5
sented for each reference instrument. In order to increase the readability of the figures some abbreviated descriptions are added for LAPBIAT (soda), Zimmerwald (ziwa) and for convolved (conv).
5.1 MIAWARA
For the Zimmerwald campaign with MIAWARA-C measuring next to MIAWARA a total
10
of 775 coincident profiles are found. Both instruments are looking in a similar direction: MIAWARA is pointing North and MIAWARA-C is pointing to an azimuth of 18◦ east of North. The two instruments use the same measurement principle, the same calibration scheme, a similar retrieval setup and have the same vertical resolution. Therefore, the profiles are compared directly without applying the averaging kernels and the
uncer-15
tainties estimated for MIAWARA-C are assumed to be valid for MIAWARA as well. Only data points with AoA>0.5 are considered for both microwave instruments.
The mean coincident profiles are shown in Fig. 8a. Figure 8b shows the bias with its standard error and the estimated systematic error of MIAWARA-C. The standard error of the bias is hardly visible due to the large number of coincident profiles. In
20
the stratosphere around 40 km (0.17 hPa) MIAWARA-C shows a wet bias with a maxi-mum of 0.17 ppmv. This changes to a slight dry bias throughout the mesosphere with a maximum of 0.3 ppmv above 50 km (0.47 hPa). The bias is well within the estimated systematic uncertainty of MIAWARA-C for all altitudes. The two instruments use the same line parameters and the same temperature profiles for the retrieval. Nevertheless,
AMTD
6, 1311–1359, 2013MIAWARA-C – validation
B. Tschanz et al.
Title Page
Abstract Introduction
Conclusions References
Tables Figures
◭ ◮
◭ ◮
Back Close
Full Screen / Esc
Printer-friendly Version Interactive Discussion
Discussion
P
a
per
|
Dis
cussion
P
a
per
|
Discussion
P
a
per
|
Discussio
n
P
a
per
|
the systematic error of MIAWARA-C includes temperature and line parameter effects. Therefore, the bias is expected to be smaller than the estimated systematic error. The standard deviation of the differences together with the combined estimated random er-ror is presented in Fig. 8c. Between 45 km (1 hPa) and 65 km (0.06 hPa) the estimated and the observed random variations agree in shape and in magnitude but below and
5
above this range, the observed variation is larger.
The correlation coefficients of the coincident time series for all altitudes for the Zim-merwald campaign are shown in Fig. 8d. The correlation coefficient is larger than 0.5 for all altitudes above 42 km (1.7 hPa) and reaches values of 0.75 throughout the meso-sphere. Below 42 km (1.7 hPa) the correlation coefficient decreases.
10
5.2 Aura MLS
For Aura MLS both v2.2 and v3.3 are used. Because of the different vertical resolutions of the two versions, different comparison strategies are used: the vertical resolution of v3.3 is better by more than a factor of two compared with MIAWARA-C for all altitudes except for the uppermost justifying a convolution with the averaging kernels whereas
15
v2.2 data are convolved below 0.1 hPa and compared directly above 0.1 hPa.
The good spatial and temporal coverage of Aura MLS in combination with the co-incidence criterion used leads to a large data set consisting of 162 (163) profiles for LAPBIAT and 323 (322) for Zimmerwald for v2.2 and v3.3, respectively.
The comparison of v3.3/v2.2 for LAPBIAT displayed in Fig. 9a shows similar mean
20
coincident profiles throughout the whole reliable altitude range. This is also reflected in panel b): The bias is within the estimated systematic uncertainties of MIAWARA-C for both versions and is almost constant with altitude. Compared to v3.3 ,MIAWARA-C shows a small dry bias of maximum 0.17 ppmv between 45 km (1.1 hPa) and 75 km (0.012 hPa). Compared to v2.2, there is a wet bias of MIAWARA-C that is smaller than
25
AMTD
6, 1311–1359, 2013MIAWARA-C – validation
B. Tschanz et al.
Title Page
Abstract Introduction
Conclusions References
Tables Figures
◭ ◮
◭ ◮
Back Close
Full Screen / Esc
Printer-friendly Version Interactive Discussion
Discussion
P
a
per
|
Dis
cussion
P
a
per
|
Discussion
P
a
per
|
Discussio
n
P
a
per
|
For v2.2 the estimated and the observed random variations are in agreement at higher altitudes whereas v3.3 hints towards an underestimation of the random error.
The comparison for Zimmerwald is shown in Fig. 10. The biases for Zimmerwald are generally larger than for LAPBIAT. Compared to MLS v3.3 and v2.2, the biases of MIAWARA-C show a similar altitude dependence: MIAWARA-C has a wet bias at
5
the lowermost altitudes that is smaller than 0.2 ppmv (0.4 ppmv) for v3.3 (v2.2). Above 45 km (1.1 hPa) MIAWARA-C shows a dry bias of less than 0.5 ppmv for v3.3 and less than 0.4 ppmv for v2.2. The magnitudes of the biases are in the range of the estimated systematic errors. The observed variations presented in panel c of Fig. 10 are larger than the estimated random errors below 46 km (1 hPa). At upper altitudes,
10
the observed variations are similar to the estimated random errors for v2.2 whereas v3.3 shows higher observed variability.
The correlation coefficients for both versions are shown in Fig. 9d for LAPBIAT and Fig. 10d for Zimmerwald. The correlation coefficient profiles have a different shape for the two campaigns: LAPBIAT correlations have lower values than Zimmerwald below
15
45 km (1.1 hPa) but consistently high values above, whereas Zimmerwald data already show correlation coefficients above 0.5 at the lowermost altitudes.
5.3 MIPAS
The coincidence criterion produced a data set consisting of 82 coincident profiles for LAPBIAT and 173 profiles for Zimmerwald. For the comparison MIPAS V5R H2O 220
20
is only used below 0.1 hPa and convolved with MIAWARA-C’s averaging kernels. The results shown in Fig. 11 are similar for both intercomparison periods. The means of the differences are presented in Fig. 11b. For LAPBIAT, there is a dry bias of MIAWARA-C of less than 0.42 ppmv above 2 hPa (40 km). For Zimmerwald, a small dry bias of MIAWARA-C is observed below 0.5 hPa (48 km) and above there is a wet
25
AMTD
6, 1311–1359, 2013MIAWARA-C – validation
B. Tschanz et al.
Title Page
Abstract Introduction
Conclusions References
Tables Figures
◭ ◮
◭ ◮
Back Close
Full Screen / Esc
Printer-friendly Version Interactive Discussion
Discussion
P
a
per
|
Dis
cussion
P
a
per
|
Discussion
P
a
per
|
Discussio
n
P
a
per
|
error for altitudes above 0.3 hPa (55 km). The observed random variations shown in Fig. 11c are higher than the estimated errors for all altitudes and both campaigns. The observed random variation exceeds the combined estimated errors by up to a factor of 3 for Zimmerwald and by up to a factor of 1.9 for LAPBIAT.
The correlation coefficients are shown in Fig. 11d. The correlation is between 0.19
5
and 0.7 for all altitudes. Above 2 hPa, the correlation is higher for LAPBIAT than for Zimmerwald. At the lowermost altitude levels, the correlation between MIAWARA-C and MIPAS is not significant for LAPBIAT.
5.4 ACE-FTS
The coincidence criterion results in a data set of 12 coincident ACE-FTS profiles for
10
LAPBIAT. Because the vertical resolution of ACE-FTS is 3–4 km at all altitudes, which is clearly higher than the vertical resolution of MIAWARA-C, MIAWARA-C’s averaging kernels are applied in the whole altitude range.
The profile comparisons of ACE-FTS are presented in Fig. 12 for LAPBIAT. Due to the small number of coincident profiles, the standard error of the bias is larger than that
15
for the results previously presented. Nevertheless, the bias together with its standard error is within the systematic error for almost all altitudes. Figure 12b indicates a wet bias of less than 0.33 ppmv through the whole altitude range of MIAWARA-C compared to ACE-FTS. The observed variations are higher than the random error above 55 km (0.3 hPa) as shown in Fig. 12c. At the upper limit, the observed variations are 2.5 times
20
as large as the combined random error. The underestimation of the random error at low altitudes is present but less pronounced than in the comparison with Aura MLS and MIAWARA.
The correlation coefficients are shown in Fig. 12d. Even though the comparison data set is small, high correlation coefficients are observed. Above 43 km (1.5 hPa), the
25
AMTD
6, 1311–1359, 2013MIAWARA-C – validation
B. Tschanz et al.
Title Page
Abstract Introduction
Conclusions References
Tables Figures
◭ ◮
◭ ◮
Back Close
Full Screen / Esc
Printer-friendly Version Interactive Discussion
Discussion
P
a
per
|
Dis
cussion
P
a
per
|
Discussion
P
a
per
|
Discussio
n
P
a
per
|
5.5 SOFIE
SOFIE has a much higher vertical resolution than MIAWARA-C (2 km at all altitudes). Therefore, SOFIE profiles are convolved with MIAWARA-C’s averaging kernels for all altitudes. Applying the coincidence criterion results in a data set of 14 coincident pro-files for LAPBIAT.
5
The mean coincident profiles are displayed in Fig. 12a. The bias shown in Fig. 12b oscillates with altitude with the following extreme values: wet bias of 0.68 ppmv at 40 km (2.6 hPa), dry bias of 0.49 ppmv at 53 km (0.36 hPa) and wet bias of 0.32 ppmv at 74 km (0.02 hPa). The wet biases are outside of the range of MIAWARA-C’s systematic error and the dry bias is on the limit. The pronounced biases could be influenced by the small
10
intercomparison data set. As for ACE-FTS, the small number of coincident observations leads to a larger standard error of the bias. In contrast to most other comparison data sets, the observed variations determined using MIAWARA-C and SOFIE are generally in agreement with the estimated random errors throughout the reliable altitude range (AoA>0.8) as shown in Fig. 12c.
15
The correlation coefficients for SOFIE, presented in Fig. 12d, reach values between 0.51 and 0.94 for altitudes above 38 km (3.4 hPa).
6 Summary and discussion
To facilitate the comparison with other studies, Fig. 13 shows a compilation of the biases found for both LAPBIAT and Zimmerwald in percent (mean of the differences
20
relative to MIAWARA-C). The biases for both campaigns are generally within±10%. Compared to MIAWARA, MIAWARA-C has a wet bias of smaller than 2.6 % at the lowermost altitude levels which changes to a dry bias generally below 5 % above ap-proximately 40 km (2 hPa) for Zimmerwald. Over the same time period, the bias with respect to Aura MLS v3.3 shows a similar shape: a slight wet bias of MIAWARA-C
25
AMTD
6, 1311–1359, 2013MIAWARA-C – validation
B. Tschanz et al.
Title Page
Abstract Introduction
Conclusions References
Tables Figures
◭ ◮
◭ ◮
Back Close
Full Screen / Esc
Printer-friendly Version Interactive Discussion
Discussion
P
a
per
|
Dis
cussion
P
a
per
|
Discussion
P
a
per
|
Discussio
n
P
a
per
|
to a dry bias increasing with altitude and reaching 10 % above 60 km (0.15 hPa). For Zimmerwald, the behaviour of the bias relative to Aura MLS v2.2 is similar but v2.2 is slightly drier than v3.3. For the LAPBIAT campaign, MIAWARA-C shows a dry bias of less than 5 % with respect to Aura MLS v3.3. The bias compared to Aura MLS v2.2 is within ±5 %. The coincident data sets of ACE-FTS and SOFIE for LAPBIAT
5
are small. This could influence the results of the comparison. The bias between SOFIE and MIAWARA-C shows a strong oscillation with maxima below±10 %. ACE-FTS hints towards an almost constant wet bias of MIAWARA-C around 5 % whereas Aura MLS v3.3 hints towards a dry bias.
The mean of the differences relative to MIPAS shows a dry bias of MIAWARA-C
10
of 6.5 % around 5 hPa (50 km) for LAPBIAT and of 3.7 % around 1 hPa (45 km) for Zimmerwald. According to Stiller et al. (2012), MIPAS V4O H2O 203 has a tendency to be biased high by up to 10 % around 45 km. Hence, the observed bias between MIPAS and MIAWARA-C v1.1 is likely to originate from MIPAS. For Zimmerwald, a strong positive bias is observed with a maximum of 11.6 % at 0.15 hPa (58 km). As no
15
similar bias is seen with respect to the other reference instruments, it is attributed to the influence of neglecting non-LTE effects in MIPAS V5R H2O 220 as discussed in Stiller et al. (2012) for V4O H2O 203.
For LAPBIAT, no bias consistent for all instruments can be identified. During the Zim-merwald campaign MIAWARA-C seems to have a dry bias of smaller than 5–10 % for
20
all altitudes above 45 km compared to MIAWARA and Aura MLS v3.3. Without taking MIPAS data above 0.2 hPa into account, all biases found are within ±10 %. The es-timated systematic error of MIAWARA-C has proven to be a conservative estimation as it can generally explain the observed biases. No systematic errors were taken into account for the satellite instruments. Therefore, the estimated systematic error of v1.1
25
is confirmed to be an upper limit.
AMTD
6, 1311–1359, 2013MIAWARA-C – validation
B. Tschanz et al.
Title Page
Abstract Introduction
Conclusions References
Tables Figures
◭ ◮
◭ ◮
Back Close
Full Screen / Esc
Printer-friendly Version Interactive Discussion
Discussion
P
a
per
|
Dis
cussion
P
a
per
|
Discussion
P
a
per
|
Discussio
n
P
a
per
|
towards an underestimation of the random errors below 0.1 hPa of one or both of the instruments. In contrast, Stiller et al. (2012) found an overestimated combined random error by comparing two different versions of MIPAS and MIAWARA-C. When compar-ing to SOFIE, the observed and estimated random variations of the difference profiles agree throughout the whole altitude range.
5
The discrepancy between estimated and observed variability above 70 km and be-low 45 km found when comparing to MIAWARA, Aura MLS, MIPAS and ACE-FTS can be caused by contributions from natural variations due to non-optimal coincidence or by an underestimation of one of the instrument’s random errors. Below approximately 45 km, MIAWARA-C’s random error is likely to be underestimated as the error due to
10
the instrumental baseline is not included in the error budget. This error could have a random component and is expected to affect the profile at stratospheric heights. Above 70 km, the observed variability is larger than the combined estimated random error. Attributing this difference to an underestimation of MIAWARA-C’s random error, it could originate from an underestimation of the influence of the spectral noise on the
15
profile, underestimation of the a priori covariance matrixSa at these altitudes or from the use of temperature profiles deviating from the true atmospheric state. The vari-ability observed by comparing profiles retrieved from the two polarisation channels of MIAWARA-C originates purely from spectral noise and is in excellent agreement with the estimated random error of v1.1 (see Sect. 2.3). Therefore, the underestimation of
20
the random error at altitudes above 70 km is mainly attributed to random uncertainties in the temperature profile and to natural variability between the profiles considered as coincident.
The correlation coefficients for all reference instruments and for both campaigns are summarised in Fig. 14. All correlation coefficients of the coincident data sets are
sig-25
AMTD
6, 1311–1359, 2013MIAWARA-C – validation
B. Tschanz et al.
Title Page
Abstract Introduction
Conclusions References
Tables Figures
◭ ◮
◭ ◮
Back Close
Full Screen / Esc
Printer-friendly Version Interactive Discussion
Discussion
P
a
per
|
Dis
cussion
P
a
per
|
Discussion
P
a
per
|
Discussio
n
P
a
per
|
seasonal cycle at these altitudes. Baseline effects add an uncorrelated signal to the time series and uncorrelated signals increase their contribution for decreasing corre-lated variations. In addition to the typical shape, SOFIE correlation coefficients oscillate with altitude. Above 45 km the correlation coefficients between MIPAS and MIAWARA-C are lower than those compared to the other instruments. Below 45 km, the correlation
5
with MIPAS is comparable to the other reference instruments.
7 Conclusions
The ground-based microwave radiometer MIAWARA-C for middle atmospheric water vapour is operated on a campaign basis. The retrieval version 1.1 provides a consis-tent data set for all of MIAWARA-C’s measurement sites to date. Water vapour profiles
10
of v1.1 cover the altitude range from 4 hPa (37 km) to 0.017 hPa (75 km). The dual-polarisation receiver of MIAWARA-C offers the opportunity to compare the estimated random error to independent measurements of the two receiver channels. The esti-mated random error of v1.1 and the observed variability are in excellent agreement.
The quality of v1.1 is assessed using five months of measurements in the Arctic
15
(LAPBIAT campaign) and nine months of measurements at mid-latitudes (Zimmer-wald). For both campaigns, the data are compared to Aura MLS and MIPAS. For the LAPBIAT campaign, additional data measured by ACE-FTS and SOFIE are used. Zim-merwald data are compared to the ground-based radiometer MIAWARA. The spatial coincidence criterion applied in latitude is+1◦/−2◦ for LAPBIAT and+2◦/−1◦ for
Zim-20
merwald, in longitude±10◦is used for both campaigns. Only profile pairs with a max-imum temporal difference of 12 h for the satellites instruments and 6 h for MIAWARA are used.
In general, the biases found between MIAWARA-C and the reference instruments are within ±10 %. The biases can be explained by the conservative estimation of
25
AMTD
6, 1311–1359, 2013MIAWARA-C – validation
B. Tschanz et al.
Title Page
Abstract Introduction
Conclusions References
Tables Figures
◭ ◮
◭ ◮
Back Close
Full Screen / Esc
Printer-friendly Version Interactive Discussion
Discussion
P
a
per
|
Dis
cussion
P
a
per
|
Discussion
P
a
per
|
Discussio
n
P
a
per
|
(Stiller et al., 2012). There is no consistent bias found for all reference instruments. However, for the Zimmerwald campaign MIAWARA-C shows a slight dry bias above 45 km of less than 5–10 % and a wet bias below 45 km compared to MIAWARA and Aura MLS v3.3.
The estimated random error of MIAWARA-C is combined with the reference
instru-5
ments precision and then compared to the standard deviation of the differences of the coincident measurements. Between 45 km and 70 km most estimated and observed random errors agree well, while MIPAS indicates an underestimation of the random error. The comparisons with MIAWARA, Aura MLS, MIPAS and ACE-FTS show an underestimation of the estimated random error below 45 km and above 70 km. The
10
difference at low altitudes is attributed to random effects originating from the spectral baseline fit in MIAWARA-C’s retrieval which are not included in the error estimation. The source of the underestimation of MIAWARA-C’s random error above 70 km is most likely due to random uncertainties of the temperature profile used for the retrieval and non-perfect coincidence.
15
The coincident satellite and ground-based measurements of water vapour used for this intercomparison study support the reliability of MIAWARA-C’s v1.1 for monitoring the temporal evolution of water vapour above the measurement site. The correlation coefficients of the coincident data sets are significant at the 95 % confidence level and generally above 0.5 for altitudes above 45 km. Below 45 km the correlation coefficients
20
decrease. The low correlation at low altitudes is partly attributed to random effects originating from the spectral baseline of MIAWARA-C and partly to small seasonal variations.
MIAWARA-C’s v1.1 has no major biases. In addition, the estimated random and sys-tematic errors are confirmed to be realistic by this validation study. The demonstrated
25
AMTD
6, 1311–1359, 2013MIAWARA-C – validation
B. Tschanz et al.
Title Page
Abstract Introduction
Conclusions References
Tables Figures
◭ ◮
◭ ◮
Back Close
Full Screen / Esc
Printer-friendly Version Interactive Discussion
Discussion
P
a
per
|
Dis
cussion
P
a
per
|
Discussion
P
a
per
|
Discussio
n
P
a
per
|
Acknowledgements. This work has been supported by the Swiss National Science Founda-tion grant number 200020-134684. ParticipaFounda-tion at the LAPBIAT campaign was funded through the EU Sixth Framework Programme, Lapland Atmosphere-Biosphere Facility (LAPBIAT2). We thank the team of the Finnish Weather Service for their hospitality and support during the campaign. We like to thank the Bern University Research Foundation for funding the weather 5
station of MIAWARA-C. Assistance provided by the ARTS/Qpack team is greatly appreciated. The Atmospheric Chemistry Experiment (ACE), also known as SCISAT-1, is a Canadian-led mission mainly supported by the Canadian Space Agency and the Natural Sciences and Engi-neering Research Council of Canada. The provision of MIPAS level-1b data by ESA is grate-fully acknowledged. We thank NASA for making Aura MLS data available. We thank the the 10
NASA/AIM team for making SOFIE data available. The provision of MIPAS level-1b data by ESA is gratefully acknowledged.
References
Bernath, P. F., McElroy, C. T., Abrams, M. C., Boone, C. D., Butler, M., Camy-Peyret, C., Carleer, M. R., Clerbaux, C., Coheur, P. F., Colin, R., DeCola, P., Bernath, P. F., McElroy, C. T., Abrams, 15
M. C., Boone, C. D., Butler, M., Camy-Peyret, C., Carleer, M. R., Clerbaux, C., Coheur, P. F., Colin, R., DeCola, P., DeMaziere, M., Drummond, J. R., Dufour, D. G., Evans, W. F. J., Fast, H., Fussen, D., Gilbert, K., Jennings, D. E., Llewellyn, E. J., Lowe, R. P., Mahieu, E., Mc-Connell, J. C., McHugh, M., McLeod, S. D., Michaud, R., Midwinter, C., Nassar, R., Nichitiu, F., Nowlan, C. R., Rinsland, C. P., Rochon, Y. J., Rowlands, N., Semeniuk, K., Simon, P., Skel-20
ton, R., Sloan, J. J., Soucy, M. A., Strong, K., Tremblay, P., Turnbull, D., Walker, K. A., Walkty, I., Wardle, D. A., Wehrle, V., Zander, R., and Zou, J.: Atmospheric Chemistry Experiment (ACE): Mission overview, Geophys. Res. Lett., 32, L15S01, doi:10.1029/2005GL022386, 2005. 1324
Boone, C. D., Nassar, R., Walker, K. A., Rochon, Y., McLeod, S. D., Rinsland, C. P., and Bernath, 25
P. F.: Retrievals for the atmospheric chemistry experiment Fourier-transform spectrometer, Appl. Optics, 44, 7218–7231, 2005. 1324