BGD
6, 2125–2162, 2009Leaf size in Amazonia
A. C. M. Malhado et al.
Title Page
Abstract Introduction
Conclusions References
Tables Figures
◭ ◮
◭ ◮
Back Close
Full Screen / Esc
Printer-friendly Version
Interactive Discussion Biogeosciences Discuss., 6, 2125–2162, 2009
www.biogeosciences-discuss.net/6/2125/2009/ © Author(s) 2009. This work is distributed under the Creative Commons Attribution 3.0 License.
Biogeosciences Discussions
Biogeosciences Discussionsis the access reviewed discussion forum ofBiogeosciences
Spatial trends in leaf size of Amazonian
rainforest trees
A. C. M. Malhado1,*, Y. Malhi1,**, R. J. Whittaker1,**, R. J. Ladle1,**,
H. ter Steege2,**,***, L. E. O. C. Arag ˜ao1,***, C. A. Quesada3,***,
A. Araujo-Murakami4,***, O. L. Phillips3,**,***, J. Peacock3,***,
G. Lopez-Gonzalez3,***, T. R. Baker3,***, N. Butt1,**, L. O. Anderson1,**,
L. Arroyo4,***, S. Almeida5,***, N. Higuchi6,***, T. J. Killeen7,***, A. Monteagudo8,***,
D. Neill9,***, N. Pitman10,***, A. Prieto11,***, R. P. Salom ˜ao5,***, N. Silva12,***,
R. V ´asquez-Mart´ınez8,***, and W. F. Laurance6,***
1
School of Geography and the Environment, Oxford University, UK
2
Dept. of Plant Ecology and Biodiversity, Utrecht University, The Netherlands
3
Earth and Biosphere Institute, School of Geography, University of Leeds, UK
4
Museo Noel KempffMercado, Santa Cruz, Bolivia
5
Museu Paraense Emilio Goeldi, Belem, Brazil
6
Instituto National de Pesquisas Amaz ˆonicas, Manaus, Brazil
7
Center for Applied Biodiversity Science, Conservation International, Washington, DC, USA
8
Herbario Vargas, Universidad Nacional San Antonio Abad del Cusco, Cusco, Per ´u
9
BGD
6, 2125–2162, 2009Leaf size in Amazonia
A. C. M. Malhado et al.
Title Page
Abstract Introduction
Conclusions References
Tables Figures
◭ ◮
◭ ◮
Back Close
Full Screen / Esc
Printer-friendly Version
Interactive Discussion
10
Center for Tropical Conservation, Duke University, Durham, USA
11
Inst. de Investigaci ´on de Recursos Biol ´ogicos Alexander von Humboldt, Bogot ´a D.C, Colombia
12
CIFOR, Tapajos, Brazil ∗
Conceived the study, collected leaf data, undertook the analysis. ∗∗
Worked on the manuscript. ∗∗∗
Contributed data.
Received: 17 December 2008 – Accepted: 26 January 2009 – Published: 23 February 2009
Correspondence to: A. C. M. Malhado ([email protected])
BGD
6, 2125–2162, 2009Leaf size in Amazonia
A. C. M. Malhado et al.
Title Page
Abstract Introduction
Conclusions References
Tables Figures
◭ ◮
◭ ◮
Back Close
Full Screen / Esc
Printer-friendly Version
Interactive Discussion
Abstract
Leaf size influences many aspects of tree function such as rates of transpiration and photosynthesis and, consequently, often varies in a predictable way in response to envi-ronmental gradients. The recent development of pan-Amazonian databases based on permanent botanical plots (e.g. RAINFOR, ATDN) has now made it possible to assess
5
trends in leaf size across environmental gradients in Amazonia. Previous plot-based studies have shown that the community structure of Amazonian trees breaks down into at least two major ecological gradients corresponding with variations in soil fertility (de-creasing south to northeast) and length of the dry season (in(de-creasing from northwest to south and east). Here we describe the results of the geographic distribution of leaf size
10
categories based on 121 plots distributed across eight South American countries. We find that, as predicted, the Amazon forest is predominantly populated by tree species
and individuals in the mesophyll size class (20.25–182.25 cm2). The geographic
dis-tribution of species and individuals with large leaves (>20.25 cm2) is complex but is
generally characterized by a higher proportion of such trees in the north-west of the
15
region. Spatially corrected regressions reveal weak correlations between the propor-tion of large-leaved species and metrics of water availability. We also find a significant negative relationship between leaf size and wood density.
1 Introduction
Leaf size is one of the most plastic traits of a tree and it is not uncommon to see great
20
variability within genera, species, individuals within a species, and even between the
same individual at different stages of development (e.g. sapling, canopy tree) or on
different parts of the same tree (e.g. sun versus shade leaves). Despite this very large
variation it is often possible to detect significant associations between a range of envi-ronmental variables and leaf size. For example, Givnish (1987) reviewed comparative
25
BGD
6, 2125–2162, 2009Leaf size in Amazonia
A. C. M. Malhado et al.
Title Page
Abstract Introduction
Conclusions References
Tables Figures
◭ ◮
◭ ◮
Back Close
Full Screen / Esc
Printer-friendly Version
Interactive Discussion lobes or leaflets – increases along gradients of increasing rainfall, humidity and/or soil
fertility, and decreases with increasing irradiance. Leaf size also tends to decrease with elevation on mountains in regions receiving high rainfall at low elevation, and to increase and then decrease with elevation in more arid regions. Givnish (1987) also observed that older plants often possess smaller leaves than younger ones of the same
5
species.
The existence of broad-scale (macrogeographic) environment-leaf size correlations probably reflect the evolutionary response of this trait to its environment (Givnish, 1987; Westoby et al., 2002). The size of leaves on a tree can therefore be productively considered as a “solution” to the complex environmental “problems” of, most notably,
10
light capture for photosynthesis (Falster and Westoby, 2003), economics of gas and water vapour exchange (Givnish and Vermeij, 1976; Givnish, 1984), avoidance of heat stress from intense sunlight, mechanical stability (Westoby et al., 2002), and defence against herbivores (Moles and Westoby, 2000). Certainly the size of a leaf is by no means ecologically trivial since, as Givnish (1987) points out, leaf size variation will
15
have a direct effect on whole-plant growth rate, mainly through size-related changes in
the conductance of the boundary layer, which affects heat exchange, uptake of carbon
dioxide and loss of water vapour.
Leaf size theory predicts that the costs and benefits of a “large leaf” or a “small leaf” strategy should vary in a predictable way with environmental parameters such as
20
humidity, water availability, and soil fertility (Parkhurst and Loucks, 1972; Givnish and Vermeij, 1976; Givnish, 1978, 1979, 1984; Westoby et al., 2002). Larger leaves have a thicker boundary layer of slow-moving, non-turbulent air and slower convective heat loss and therefore tend to be hotter than ambient air temperature when exposed to net incoming radiation. This can be disadvantageous, especially in areas where water is
25
BGD
6, 2125–2162, 2009Leaf size in Amazonia
A. C. M. Malhado et al.
Title Page
Abstract Introduction
Conclusions References
Tables Figures
◭ ◮
◭ ◮
Back Close
Full Screen / Esc
Printer-friendly Version
Interactive Discussion
has the net effect of reducing CO2 uptake and reducing the rate of photosynthesis.
Increased water acquisition costs would therefore be expected to favour smaller leaves (Givnish, 1987). With respect to soil fertility, trees growing in oligotrophic (low nutrient) soils will be more limited in their rate of construction of photosynthetic enzymes and therefore benefit less from temperature-related increases in photosynthetic metabolism
5
– once again favouring the evolution and development of smaller leaves (Givnish, 1984, 1987).
The complex nature of the relationship between environment and leaf size is further reflected by the considerable variation in leaf size that can be observed within areas
with similar macroclimatic conditions (Cornelissen, 1999). In other words, many diff
er-10
ent leaf size strategies frequently co-exist in physically similar environments. It is likely that within-site (or plot) variation in leaf size arises because the ecological opportuni-ties for each species are also strongly dependent on the other species present in the community (Westoby et al., 2002). Thus, the ability of a species to establish success-fully in a habitat may be dependent upon which other species are present and may be
15
influenced by other traits apart from leaf form and size. These complex trade-offs and
the multiple selective pressures on leaf size have generated considerable diversity in this trait, even between ecologically similar species (Ackerly, 1996).
Care should be taken not to interpret everything purely in terms of optimisation of a
single trait (leaf size) since developmental and physiological constraints and trade-offs
20
(cf. Dawkins, 1982) may also play a role in determining leaf size. This is clearly illus-trated by the associations between leaf size and canopy architecture and branching morphology (Midgley and Bond, 1989; Ackerly and Donoghue, 1998). Furthermore, these latter traits may, in turn, influence leaf size evolution independent of ecophys-iological function (Ackerly and Reich, 1999). An example of the importance of such
25
trade-offs could be the commonly observed negative relationship between wood
BGD
6, 2125–2162, 2009Leaf size in Amazonia
A. C. M. Malhado et al.
Title Page
Abstract Introduction
Conclusions References
Tables Figures
◭ ◮
◭ ◮
Back Close
Full Screen / Esc
Printer-friendly Version
Interactive Discussion al., 2007). Alternatively, this relationship is perhaps related to the “pioneer-climax” tree
gradient or may be due to co-varying factors that do not directly affect each other and
are therefore difficult to identify. However, the fact that there is still considerable varia-tion in leaf size between species with similar wood densities suggests that this is by no means the whole story.
5
Despite the fact that ecologists have had a long-standing interest in explaining vari-ations in leaf size between, and within, species and habitats it is still a subject that appears far from resolution. For instance, Westoby et al. (2002) consider the leaf size– twig size spectrum of ecological variation as being fundamental to our understanding of the texture and function of forest canopies, but acknowledge that the costs and
ben-10
efits of large versus small leaf and twig size are still poorly understood. Ackerly and Reich (1999) also feel obliged to admit that, “variation [in leaf size] among species within habitats is still poorly explained”.
Givnish (1987), in his agenda-setting review of comparative studies in leaf form, sug-gests two methodological approaches that may lead towards a better understanding of
15
leaf size. Firstly, in-depth physiological studies may be able to tease apart the various
constraints and trade-offs that affect leaf size (e.g. Parkhurst and Loucks’ (1972)
gen-eral eco-physiological model of leaf size). Secondly, broader comparative studies are required, since the more intensive physiologically-based approaches will necessarily be subject to biases stemming from a range of genetic influences such as linkage,
20
epistasis and pleiotropy that are peculiar to the study population, in addition to any influence of natural selection.
In this paper we adopt the broader comparative approach advocated by Givnish (1987). With the recent creation of very large databases of Amazonian trees based on permanent plots scattered throughout the Amazon region it has now become
25
envi-BGD
6, 2125–2162, 2009Leaf size in Amazonia
A. C. M. Malhado et al.
Title Page
Abstract Introduction
Conclusions References
Tables Figures
◭ ◮
◭ ◮
Back Close
Full Screen / Esc
Printer-friendly Version
Interactive Discussion ronmental factors driving regional scale patterns in leaf size. We do this to gain further
insights into the ecological significance of leaf size and improve our understanding of the functioning of the Amazonian rainforest.
Specifically, we seek answers to the following questions:
– Which leaf size categories predominate in the canopy of the Amazon rainforest?
5
– Are there spatial patterns in leaf size distribution in the Amazon?
– Are the frequencies of different leaf size categories associated with environmental
variables that reflect their adaptive function (e.g. rainfall, soil fertility, and length of dry season)?
– Are leaf size categories associated with the growth strategy of trees?
10
– Are leaf size and wood density negatively correlated?
More specifically, we will be testing the following key hypotheses about leaf size in Amazonia: a) small leaves are an adaptation to relatively drier conditions and will show a macrogeographic pattern that reflects this; b) small leaves are favoured on oligotrophic soils; and c) there is a negative relationship between leaf size and wood
15
density.
2 Methods
2.1 Database construction
Our main source of data and research tool for exploring spatial variation in leaf size categories across the Amazon basin was the RAINFOR database (Peacock et al.,
20
20071) and 26 data plots from Guyanas and Suriname compiled by the ATDN
net-work (ter Steege et al., 2003). The database has been constructed using information
1
BGD
6, 2125–2162, 2009Leaf size in Amazonia
A. C. M. Malhado et al.
Title Page
Abstract Introduction
Conclusions References
Tables Figures
◭ ◮
◭ ◮
Back Close
Full Screen / Esc
Printer-friendly Version
Interactive Discussion from 141 permanent plots distributed across eight South American countries (Malhi et
al., 2002). However, not all data were available for all plots, so plots lacking relevant environmental data were removed from certain analyses. Furthermore, 20 plots were
excluded from the study because they had>30% of species that were either
uniden-tified at species level (475 species from entire database) or for which herbarium/flora
5
data were not available (61 species). As a consequence, numbers of plots included in the analyses varied from 51 to 121. The database at the time of extraction for this study
(August 2006) contained 111 123 individual trees (>100 mm DBH) from 3324 species.
The plots used in this study span local and regional environmental gradients that nat-urally occur in Amazonia, including mature forests that are seasonally flooded,
water-10
logged, and non-flooded lowland terra firme (88% of plots) forests on both clay-rich and white-sand substrates. All sites consisted of an apparently mature old-growth for-est with natural gap-phase dynamics and a canopy dominated by non-pioneer species. None of the plots is believed to have experienced any recent human-caused
distur-bance. The individual plots range in size from 0.25 to 9 ha (1.17 ha±1.04=mean±SD)
15
and in total encompass 141.5 ha of forest. The density of stems per plot (including
undetermined stems) ranged from 265 to 1307 per ha (672±167 per ha=mean±SD).
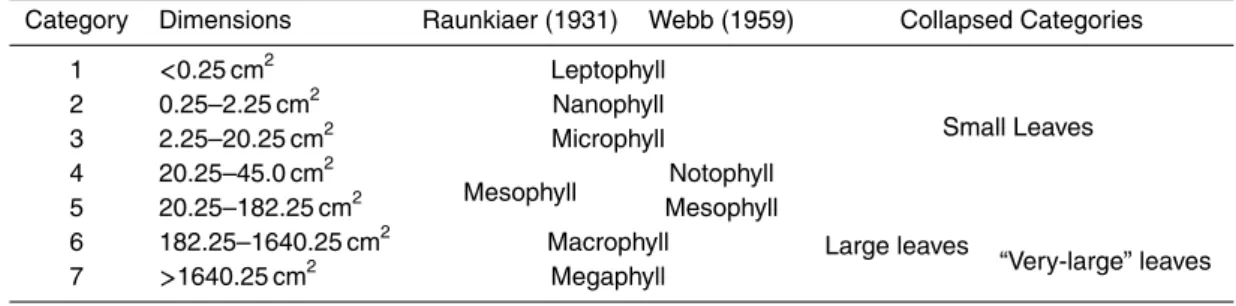
To this existing database, information was added on leaf size for each (2788) species using images from floras and herbaria (Table 1). Leaf-size was determined from the herbarium or flora specimen using the geometric leaf-size classification of Raunkiaer
20
(1934) as modified by Webb (1959). Raunkiaer (1934) defined six leaf-size classes:
leptophyll (leaves up to 0.25 cm2in area), nanophyll (0.25–2.25 cm2), microphyll (2.25–
20.25 cm2), mesophyll (20.25–182.25 cm2), macrophyll (182.25–1640.25 cm2), and
megaphyll (>1640.25 cm2). Webb (1959) divided the mesophyll size class into two
further size classes (see Table 2): notophyll (20.25–45.0 cm2) and mesophyll (45.0–
25
BGD
6, 2125–2162, 2009Leaf size in Amazonia
A. C. M. Malhado et al.
Title Page
Abstract Introduction
Conclusions References
Tables Figures
◭ ◮
◭ ◮
Back Close
Full Screen / Esc
Printer-friendly Version
Interactive Discussion
2.2 Leaf size metrics
The spatial patterns of variation in leaf size were assessed through the use of sev-eral simple metrics, which then acted as dependent variables within OLS (Ordinary Least Squares) regressions. Following Dolph and Dilcher (1980), our main metrics for
describing the geographic distribution of leaf sizes are the proportion ofspeciesor
indi-5
vidualsthat possess large leaves (category 5, mesophyll; category 6, macrophyll; and
category 7, megaphyll). Where appropriate for analysis or illustration we also collapse categories 6 and 7 into a combined “very-large” leaves category (Table 2). Further-more, palm trees were placed in a separate palm-leaf category and were only used to report abundance.
10
2.3 Geographic trends in leaf size
Recent studies (e.g. Baker et al., 2004; Malhi et al., 2004; ter Steege et al., 2006) have
demonstrated consistent ecological differences in tree characteristics (including a
vari-ety of leaf traits – Malhado, 2008) across different regions of the Amazon. Here, to aid
direct comparisons with these studies, we follow the practice of splitting the Amazon
15
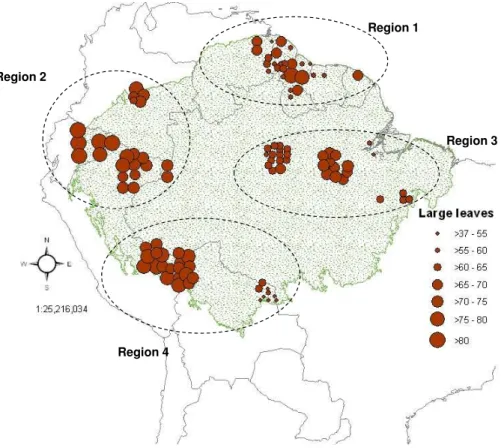
into four main regions: Region 1, North Amazonia, containing plots from Guyana, Suri-name and Venezuela; Region 2, North-West Amazonia, containing plots from Ecuador, Colombia, and North Peru; Region 3, Central and East Amazonia, all Brazilian plots (states of Amazonas and Par ´a only); Region 4, South-West Amazonia, containing plots from Bolivia and South Peru.
20
Leaf size could be associated with the size of the tree if tall or short species tend to have leaves of characteristic sizes. To control for this potential association, trees were
separated into three different height ranges that were analysed separately using DBH
(diameter at breast height) as a proxy for height: small trees (≤200 mm DBH), medium
trees (>200 mm to<400mm DBH), and large trees (≥400 mm DBH). The regional
dis-25
BGD
6, 2125–2162, 2009Leaf size in Amazonia
A. C. M. Malhado et al.
Title Page
Abstract Introduction
Conclusions References
Tables Figures
◭ ◮
◭ ◮
Back Close
Full Screen / Esc
Printer-friendly Version
Interactive Discussion within the Fabaceae dataset.
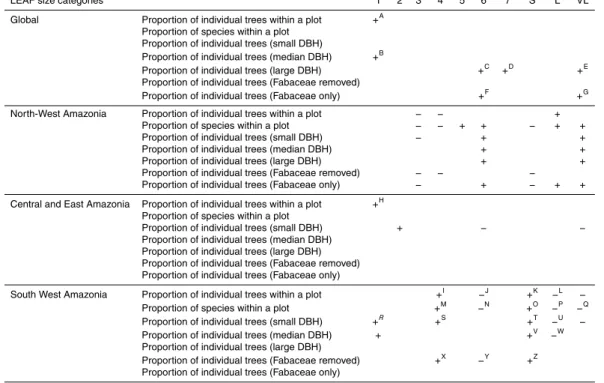
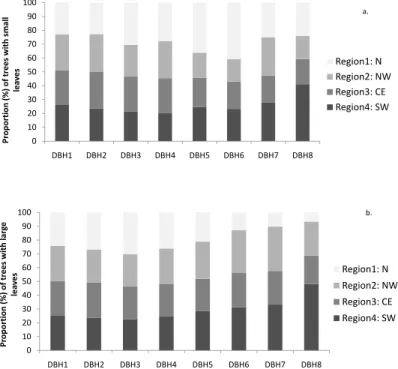
To better detect and visualize regional patterns in leaf size categories, taking into account tree diameters, we also quantified the relative contribution (proportion) of each leaf size (categories 1 to 6) across eight tree trunk diameter (DBH) classes
(100–190 mm,>190–280 mm, >280–370 mm, >370–480 mm, >480–550 mm, >550–
5
640 mm,>640–730 mm,>730 mm) for each region. The relative abundance was
quan-tified through a two-stage process: first, the proportion of trees within each DBH cat-egory within a region was calculated; second, relative proportion of each size class
across the four regions was calculated (proportion of trees in DBH categoryi and
regioni/sum of proportions in category for all regions).
10
2.4 Life history metrics
In this paper, we define the growth strategy of each species through a simple index (henceforth referred to as the pioneer index) based on expert judgment. This in-dex reflects the degree of consensus among botanists familiar with the taxa, in this
case Oliver Phillips, Rodolfo V ´asquez-Mart´ınez, and Abel Monteagudo, and was
cross-15
referenced with herbarium material collector’s labels. To calculate the index each taxon was judged independently by each botanist and given a value between zero (“non-pioneer”) and one (“(“non-pioneer”). The pioneer index was then calculated as the average score for each species. Wood density for each species was calculated using infor-mation available in the RAINFOR database (Baker and Lopez-Gonzalez, 2006) and
20
derived from published sources (Baker et al., 2004; Peacock et al., 2007).
2.5 Environmental variables
The choices of independent (predictor) variables for our spatially controlled regression models were based on both observation and theory. Since one of the main hypotheses is that small leaves in tropical forests are an adaptation to relatively drier conditions
25
BGD
6, 2125–2162, 2009Leaf size in Amazonia
A. C. M. Malhado et al.
Title Page
Abstract Introduction
Conclusions References
Tables Figures
◭ ◮
◭ ◮
Back Close
Full Screen / Esc
Printer-friendly Version
Interactive Discussion
monthly TRMM (Tropical Rainfall Measuring Mission -TRMM 3B43-V6, 0.25◦ spatial
resolution). This product combines multiple data sources including satellite
informa-tion on rainfall with ground precipitainforma-tion gauge adjustment (Huffman and Bolvin, 2007).
These data have recently been shown to represent the rainfall patterns over the Amazo-nian region (Arag ˜ao et al., 2007). For each month we calculate the average mean from
5
1998 to 2005. The monthly mean surfaces (one for each month of the year, combin-ing twelve geo-referenced surfaces) were then used to estimate for each pixel: (1) the
annual rainfall (mm year−1), based on the sum of the monthly values; (2) the standard
deviation (SD) of rainfall within the year, as a measure of seasonality; (3) the maximum climatological water deficit (MWD; mm), calculated by assuming that the
evapotranspi-10
ration rate is approximately 100 mm month−1in tropical forests and a cumulative deficit
is thus incurred if the rainfall is less than this value (Arag ˜ao et al., 2007); and (4) the
length of the dry season, as the number of months with rainfall<100 mm (Fig. 1).
Al-though crude, the MWD is Al-thought to be a useful indicator of meteorologically-induced water stress without taking into account local soil conditions and plant adaptations,
15
which are poorly understood in Amazonia (Arag ˜ao et al., 2007).
Small leaves may also be favoured on oligotrophic soils even under wet conditions (Givnish, 1987) and we therefore used data on soil fertility (sum of bases), where available (51 plots, Quesada 2008). Soil sampling for the sites was carried out in
accordance with a standard protocol developed for the RAINFOR project2. Soil pits
20
were situated at representative locations for the dominant soil and topographic posi-tions, usually located a few metres outside the permanent sample plots in order to re-duce potential disturbances. All the soil samples (Quesada, 2008) were analysed and exchangeable Ca, Mg, K, Na and Al were determined by the silver thiourea method (Pleysier and Juo, 1980) as described in detail in ISRI (1995). The sum of bases
25
(SB) was calculated as: [SB]=[Ca]+[Mg]+[K]+[Na] (Units: mmol kg−1). Soil analyses
ranged from regional to global scales and used individual leaf size categories (leaf categories 1, 2, 3, 4, 5, 6) and clustered categories (small, large, “very-large”) for
par-2
BGD
6, 2125–2162, 2009Leaf size in Amazonia
A. C. M. Malhado et al.
Title Page
Abstract Introduction
Conclusions References
Tables Figures
◭ ◮
◭ ◮
Back Close
Full Screen / Esc
Printer-friendly Version
Interactive Discussion tial datasets (all trees, Fabaceae removed, only Fabaceae) while controlling for tree
diameter (small DBH, median DBH, large DBH).
2.6 Statistical analysis
Leaf size characteristics varied considerably within taxonomic groups in the study sug-gesting that it is unnecessary to control formally for phylogeny. However, RAINFOR
5
plots do show a degree of spatial clustering and ecological and physical variables may therefore be more similar (or dissimilar) because of spatial proximity and it is therefore appropriate to account statistically for spatial autocorrelation (Legendre, 1993). With multiple variables it is a common strategy to perform Ordinary Least Squares (OLS) regressions of response variables (in this case metrics of leaf size) on the raw
envi-10
ronmental factors and use Moran’s I correlograms to check for the presence of spatial autocorrelation in the residuals (Rangel et al., 2006). When correlograms showed ev-idence of spatial autocorrelation we used a spatial filtering approach to control for the influence of spatial position on the relationship between explanatory and response vari-ables. Furthermore, we tested for an association between the sum of bases (plot soil
15
fertility data) and proportion of leaf size categories adjusting for the number of degrees of freedom using Dutilleul’s (1993) method. All spatial analyses were performed using the software Spatial Analysis in Macroecology (SAM v2) (Rangel et al., 2006).
Trends in the distribution of the various leaf size metrics (see Materials and Methods) in relation to the four Amazonian regions (regional analyses) were assessed using a
20
BGD
6, 2125–2162, 2009Leaf size in Amazonia
A. C. M. Malhado et al.
Title Page
Abstract Introduction
Conclusions References
Tables Figures
◭ ◮
◭ ◮
Back Close
Full Screen / Esc
Printer-friendly Version
Interactive Discussion
3 Results
3.1 Abundance of leaf size categories
Based on our analysis of herbaria specimens, among the 2788 studiedspecies50% fell
into the mesophyll category (category 5), 1.2% leptophyll, 1.3% nanophyll, 7.6% micro-phyll, 23.6% notomicro-phyll, 13.7% macromicro-phyll, and 0.1% megaphyll (Fig. 2). The final 2%
5
were palms, which were excluded from further analysis. The proportion ofindividual
trees that fall into different leaf size categories closely mirrored the observed
propor-tion ofspecies: 52.4% of 84 554 individual trees fell into mesophyll category, 1.3% were
leptophyll, 0.6% nanophyll, 4.1% microphyll, 18.5% notophyll, 11.9% macrophyll, and 0.6% megaphyll (Figure 2). Palms account for 10.5% of the total number of individual
10
trees across the studied plots.
Leaf size classes are broadly distributed within and between families. This is clearly illustrated by the proportion of families that contain species in two leaf size categories (24.7%), three leaf size categories (29.6%) or four leaf size categories (30.9%,). Only 13.6% of the families were characterized by all their species belonging to a single leaf
15
size category – although it is important to note that the vast majority of these families contained only 1 or 2 species. The species rich Fabaceae family are the group with the largest distribution of leaf size categories and are characterised by species that are represented in 6 (out of the 7) leaf classes.
The leaf size distribution of the largest families (those with >60 species) follows a
20
humped distribution with a distinct peak in the mesophyll leaf category (Fig. 3). Further analyses on families where all species possess simple leaves and on families dis-playing at least one species with compound leaves (leaflets), also followed a humped distribution. Two families deviate from the general form: the Fabaceae and Myrtaceae, both of which are characterized by a flatter distribution (lower kurtosis) of leaf size
25
BGD
6, 2125–2162, 2009Leaf size in Amazonia
A. C. M. Malhado et al.
Title Page
Abstract Introduction
Conclusions References
Tables Figures
◭ ◮
◭ ◮
Back Close
Full Screen / Esc
Printer-friendly Version
Interactive Discussion
3.2 Spatial trends in leaf size
There is a significant difference in the mean proportion of species with large leaves
(categories 5 to 7) among the four Amazonian regions (n=121, d f=3, F=14.455,
p<0.001), with plots from northwest Amazonia (Region 2) possessing a greater
pro-portion of larger-leavedspecieson average than plots from the other regions (Fig. 4).
5
It is interesting to note that Region 4 appears to consist of two quantitatively distinct clusters of plots (Fig. 4), a northwestern set and a southeastern set. The northwestern cluster (nearest to Region 2) features forests with a similar proportion of large-leaved trees to those found in plots in Region 2. When the analysis is repeated using the
two largest leaf size categories (categories 6 and 7), a significant difference is found
10
between the mean proportion of species with leaves in these classes between all 4 regions. In this case, northwest Amazonia (Region 2) once again has the greatest pro-portion of species with the largest leaves, followed by southwest Amazonia (Region 4), central and eastern Amazonia (Region 3), and finally, north Amazonia (Region 1).
Very similar geographical patterns are observed when we consider relative
abun-15
dance of individual trees with large leaves (categories 5 to 7), or ‘very-large’ leaves
(categories 6 and 7) and these regional differences remain when we control for the
di-ameter of a tree (using DBH). The mean proportion ofindividualtrees with DBH smaller
or equal to 200 mm with large leaves (categories 5 to 7) is significantly different among
the four regions (n=92, d f=3, F=4.669, p=0.004). In this case, Tukey’s post-hoc
20
test reveals that the difference is being driven by Region 1 (north Amazonia), which is
characterized by a lower mean proportion of large leaves than the other regions. The regional gradient found is similar to the one described above: northwest Amazonia (Region 2) having the greatest mean proportion of large leaves, followed by southwest Amazonia (Region 4), then central and eastern Amazonia (Region 3), and finally north
25
Amazonia (Region 1), which had the lowest mean proportion of large-leaved trees. We found an identical pattern of significant regional differences (n=92, d f=3, F=5.969,
In-BGD
6, 2125–2162, 2009Leaf size in Amazonia
A. C. M. Malhado et al.
Title Page
Abstract Introduction
Conclusions References
Tables Figures
◭ ◮
◭ ◮
Back Close
Full Screen / Esc
Printer-friendly Version
Interactive Discussion
terestingly, there are no significant regional differences in the mean proportion of large
trees (DBH≥400 mm) with large leaves (n=92,d f=3,F=0.808,p=0.493).
There is still a significant difference among the four regions in terms of the mean
proportion of trees with large leaves (and “very-large” leaves) when we control for the possible influence of the numerically abundant Fabaceae family. Specifically, when
5
all the Fabaceae trees are removed from the analysis there was a significant diff
er-ence observed forindividual trees with large leaves among the regions (n=118,d f=3,
F=13.068,p<0.001). Tukey’s post-hoc test reveals two distinct clusters: 1) north and
southwest Amazonia (Regions 1 and 4) that display a lower mean proportion of trees with large leaves, and 2) northwest Amazonia and central-eastern Amazonia (regions 2
10
and 3) that display a higher mean proportion of trees with large leaves. An identical geographical pattern and level of significance was observed when the proportion of trees with “very-large” leaves (classes 6 and 7) was used as the dependent variable (n=118,d f=3,F=7.464,p<0.001).
When the analysis was repeated within the Fabaceae we found a weakly significant
15
difference among the regions in the mean proportion of trees with large leaves (n=118,
d f=3,F=2.715, p=0.048). In this case northwest Amazonia (Region 2) still contains
the largest mean proportion of Fabaceae trees with large leaves although Tukey’s post
hoc test revealed that none of the means (regional mean) are statistically different from
each other. However, when the same test is performed using the mean proportion of
20
Fabaceae trees with “very-large” leaves a strongly significant result is gained (n=118,
d f=3,F=4.639, p=0.004), once again following the “typical” geographic pattern
out-lined above: trees with “very-large” leaves being relatively less abundant in north and southwest Amazonia and relatively more abundant in northwest Amazonia and central-eastern Amazonia.
25
The mean frequency of different leaf size categories shows a consistent pattern
BGD
6, 2125–2162, 2009Leaf size in Amazonia
A. C. M. Malhado et al.
Title Page
Abstract Introduction
Conclusions References
Tables Figures
◭ ◮
◭ ◮
Back Close
Full Screen / Esc
Printer-friendly Version
Interactive Discussion mesophyll dominance is repeated when the most numerically abundant and species
rich family, the Fabaceae, are removed from the dataset with Region 1 conforming most closely to the “typical” pattern (Fig. 5b). When the size distribution of individuals within the Fabaceae is plotted each region appears to have its own singular distribution (Fig. 5c) testifying to the unique and unusual ecology of this remarkable family.
5
We also looked at the relative proportion of individual trees in each leaf size category in relation to regions and DBH classes (Fig. 6). The distribution of trees in leaf size cat-egories 1 and 2 is in concordance with the distribution of Fabaceae across the regions and DBH size classes. Relative proportions of trees in leaf size categories 3 and 4 are relatively even among our regions, although it is possible to detect a slight increase in
10
relative proportion for region 4 for trees in the higher DBH ranks (Fig. 6). The relative proportions of trees in leaf size classes 5 and 6 are very consistent in smaller DBH categories but show a trend of increasing regional separation in the higher DBH cate-gories (Fig. 6). Regional analysis of small (classes 1 to 4 combined) and large leaves (classes 5 to 7 combined) reveals a singular pattern in Region 4 (southwest Amazonia),
15
which is distinguished by a higher proportion of large DBH trees that possess either smaller leaves or larger leaves (Fig. 7). Region 1 shows a trend of a relatively lower proportion of large leaved trees in larger DBH categories (Fig. 7).
3.3 Leaf size and tree characteristics
Specieswith small leaves show significantly lower “pioneer” scores thanspecies with
20
large leaves (n=1358,d f=1,F=7.822, p=0.005). A more detailed analysis using leaf
categories one to six also shows a significant difference in identified growth strategy
among the classes (n=1358, d f=5, F=3.978, p=0.001). Tukey’s post-hoc test
re-veals that the significance is being primarily driven by the growth strategy ofspecies
with large leaves (category 6)3, which are characterized by almost 40% higher mean
25
3
BGD
6, 2125–2162, 2009Leaf size in Amazonia
A. C. M. Malhado et al.
Title Page
Abstract Introduction
Conclusions References
Tables Figures
◭ ◮
◭ ◮
Back Close
Full Screen / Esc
Printer-friendly Version
Interactive Discussion
scores than species with smaller leaf sizes (categories 3, 4 and 5). Unsurprisingly,
whenspeciesin the two largest leaf size categories (6 and 7) are compared against all
the other smaller categories (1 to 5), significantly higher index values are observed in
specieswith large leaves (n=1358,d f=1,F=12.927,P <0.001).
Specieswith large leaves (categories 5 to 7) have lower wood density (approximately
5
10% less) when compared withspecies with small leaves (categories 1 to 4) (n=967,
d f=1,F=26.097,p<0.001; mean wood density large leaves: 0.62; small leaves: 0.68).
This pattern repeats itself when we looked at the largest leaves (categories 6 to 7) against smaller leaves (categories 1 to 5) (n=967, d f=1,F=33.905,p<0.001).
Indi-vidualtrees with small leaves tend to have larger diameters (DBH), while larger leaves
10
present smaller diameters although, interestingly, it is also possible to findindividual
trees with large DBH possessing large leaves.
3.4 Environmental correlates of leaf size
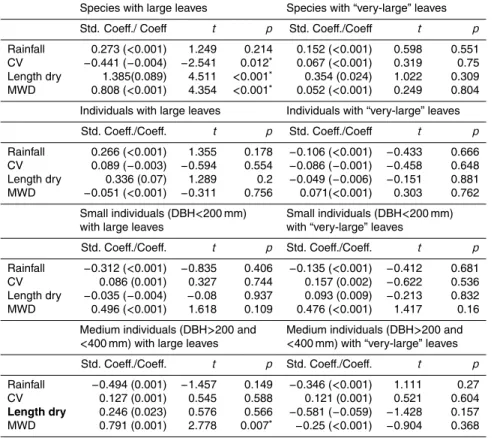
The proportion of species per site with large leaves was significantly correlated with
three precipitation metrics used in the study: length of the dry season (months
15
<100 mm rainfall), maximum water deficit, and a metric of the variation in water
avail-ability based on the standard deviation of total rainfall (full results given in Table 3).
However, no significant relationships were seen at theindividual level or for species
orindividualswhen the leaf size metric was the proportion of trees per plot with
“very-large” leaves (categories 6 and 7).
20
When we controlled for diameter of theindividualtrees, we found only one significant
association: between the proportion of medium-sizedindividual trees (DBH>200 and
<400 mm) with large leaves (categories 5 to 7) and MWD. No other associations were
observed between the data subsets – i) trees with small diameter (DBH<200 mm),
and ii) large trees (DBH>400 mm) – and the precipitation metrics (TRMM variables) for
25
either large or “very-large” (categories 6 and 7) leaves (Table 3).
BGD
6, 2125–2162, 2009Leaf size in Amazonia
A. C. M. Malhado et al.
Title Page
Abstract Introduction
Conclusions References
Tables Figures
◭ ◮
◭ ◮
Back Close
Full Screen / Esc
Printer-friendly Version
Interactive Discussion – also resulted in a small number of significant correlations (Table 3). When the
Fabaceae were removed, the proportion of trees with large leaves and “very-large” leaves did not correlate with any variables. However, when the Fabaceae were anal-ysed separately significant correlations were found between the proportion of trees with large leaves and length of the dry season. The proportion of Fabaceae individuals
5
with “very-large” leaves only correlated with the coefficient of variation (SD) of rainfall (Table 3).
The relationship between soil fertility and leaf size was complex and revealed no strong patterns or consistent associations. From the global dataset (individual and
clustered leaf categories of proportion of individual trees and species) only one
cor-10
relation was significant – between the proportion of individual trees with leaf size 1
and soil fertility (Table 4). There was no correlation between small DBH trees and soil fertility, median DBH trees are only correlated with leaf size category 1 (Table 4) and large DBH trees were correlated with category 6, category 7, and the “very-large” leaf size category (Table 4). No correlations were found when we removed the Fabaceae,
15
while only categories 6 and “very-large” leaves were correlated within the Fabaceae trees subset (Table 4).
Analyses within region 2 did not reveal any significant correlation with soil fertility and leaf size, while analyses within Region 3 (Central-East Amazonia) produced only
one significant (positive) correlation betweenindividual trees and leaf size category 1.
20
An interesting contrast is found in Region 4 (Southwest Amazonia) with 18 significant
results supporting an inverse correlation between the proportions of individual trees
with large leaves and soil fertility (Table 4) – the opposite trend to that observed by previous authors (Wright et al., 2007).
4 Discussion
25
Richards (1952), in his pioneering study on tropical rainforests, noted that plants of
BGD
6, 2125–2162, 2009Leaf size in Amazonia
A. C. M. Malhado et al.
Title Page
Abstract Introduction
Conclusions References
Tables Figures
◭ ◮
◭ ◮
Back Close
Full Screen / Esc
Printer-friendly Version
Interactive Discussion species, even of the same genera, in temperate forests. This is very apparent for
traits such as leaf size, where species within tropical forests can be remarkably ho-mogenous in the leaf size properties that they possess. In lowland rainforests the predominant leaf size category is mesophyll (sensu Raunkiaer, 1934) – Grubb and his colleagues describe 64% of species in Ecuador, 84% of their sample in Brazil, and
5
98% of their sample in Australia as belonging to the mesophyll category (Grubb et al., 1963). Turner (2001) proposes that trees in this category normally constitute approx-imately three-quarters of all species in lowland tropical rainforests across the globe. The current study supports these findings, with 73.6% of species identified belonging to this size category. This result also supports the observation that the mesophyll
cat-10
egory dominates in Neotropical rainforests (Grubb et al., 1963; Thompson et al., 1992; Kelly et al., 1994). Another characteristic feature of tropical rainforests is to have a small proportion of (non-palm) species with very large leaves. Once again this was further supported by this study in that we observed 0.01% of species with leaves in the megaphyll size category.
15
4.1 Spatial trends in leaf size
Our study demonstrates complex patterns of variation in leaf size characteristics across the Amazon rainforest. At the crudest level of analysis there is a trend of larger propor-tions of individuals and species in large leaf size categories in the western plots. The relatively lower proportion of trees with large leaves in the Guiana Shield region may be
20
due to the high proportion of Fabaceae in this area, many of which are characterized by the possession small leaves.
These spatial trends in leaf size can be interpreted in relation to previous macro-geographic studies in the Amazon. Most significantly, ter Steege et al. (2006) recently used inventory data to identify two major gradients in tree composition and function
25
BGD
6, 2125–2162, 2009Leaf size in Amazonia
A. C. M. Malhado et al.
Title Page
Abstract Introduction
Conclusions References
Tables Figures
◭ ◮
◭ ◮
Back Close
Full Screen / Esc
Printer-friendly Version
Interactive Discussion is paralleled by declines in functional traits such as wood density and seed mass. The
main ecological driver of this gradient is hypothesized to be a gradient of increasingly poorer soils as one approaches the northeastern corner of Amazonia. The second gradient stretches from Colombia to southeastern Amazonia and is characterized by the increasing presence of more drought-adapted species in the forests on the
south-5
eastern edge of Amazonia, which is postulated to be driven by a parallel gradient of dry season length (ter Steege et al., 2006).
In the present study the relative predominance of larger-leaved species in west and southwest Amazonia closely aligns with the scores for the second axis of ter Steege’s DCA analysis of genus level community composition (ter Steege et al., 2006) and
indi-10
cates a possible influence of length of the dry season on leaf size. This interpretation is further supported, although weakly, by the spatially-corrected OLS regressions, which identified three metrics of water availability (see materials and methods) as being sig-nificantly associated with the proportion of tree species with large leaves. However, the data do not generate a clear signal when individual trees are split into DBH classes,
15
when the Fabaceae are excluded from the dataset, or when the Fabaceae are anal-ysed independently. In summary, the data presented here do not provide any clear support for the work of Webb (1959) and Dolph and Dilcher (1980), who suggested that leaf size in rainforests is positively correlated with annual rainfall.
4.2 Leaf size and tree characteristics
20
The postulated functional association between water availability and leaf size may also underlie the observed negative relationship between leaf size and wood density. Wright et al. (2007) argue that trees with lower wood density have larger-diameter stem ves-sels and can therefore transport more water and have a greater total leaf area per stem. As interspecific variation in leaf area per stem is driven more by leaf size than number
25
BGD
6, 2125–2162, 2009Leaf size in Amazonia
A. C. M. Malhado et al.
Title Page
Abstract Introduction
Conclusions References
Tables Figures
◭ ◮
◭ ◮
Back Close
Full Screen / Esc
Printer-friendly Version
Interactive Discussion water transport abilities of large-leaved, low wood density species is a disadvantage in
sites with lower water availability.
It should be noted, however, that wood density itself has a complex relationship with precipitation. Thus, while Wiemann and Williamson (2002) found a positive correla-tion between wood density and mean annual precipitacorrela-tion in their comparison of North
5
American and South American tree communities, ter Steege and Hammond (2001) found that the variation in mean wood density within the Guyanas was not correlated with precipitation. On the other hand, Barajas-Morales (1987) found that mean wood density was negatively related to precipitation in two tropical forests in Mexico. Wood density has also been observed to vary between Amazonian regions and with
alti-10
tude. A recent study in the Amazon described a complex spatial pattern of significant
decreases in wood density with increasing altitude and significant differences among
low-altitude Amazonian regions: the forests of western Amazonia have significantly lower mean wood density than those of eastern and central Amazonia (Chave et al., 2006). In conclusion, wood density should be considered as one potentially important
15
factor driving spatial trends in leaf size in Amazonia but further manipulative and
com-parative work is clearly desirable in order to better understand the complex trade-offs
and selective pressures on these two traits.
5 Conclusions
This study set out to address three key hypotheses. First, that small leaves are an
20
adaptation to relatively drier conditions and will show a macrogeographic pattern that reflects this. The regional distribution of leaf size categories is broadly consistent with this hypothesis, although the spatially corrected regressions failed to provide strong ev-idence for quantitative relationships between leaf size and precipitation metrics. Sec-ond, that small leaves are favoured on oligotrophic soils. No evidence was found in
25
support of this hypothesis, possibly because of the numerous trade-offs with other
BGD
6, 2125–2162, 2009Leaf size in Amazonia
A. C. M. Malhado et al.
Title Page
Abstract Introduction
Conclusions References
Tables Figures
◭ ◮
◭ ◮
Back Close
Full Screen / Esc
Printer-friendly Version
Interactive Discussion Finally, that there is a negative relationship between leaf size and wood density. Like
many other studies we found strong support in favour of this hypothesis, suggesting that this relationship is one of the constraints on leaf size evolution.
Although the regional trends in leaf size described here fit well with our current un-derstanding of the macroecology of the Amazon, other factors not easily be picked
5
up at this resolution of analysis may also be influencing observed patterns. Regional trends in leaf size might also be influenced by allometry, development and phylogeny in constraining the expression of this trait in different ways in different habitats (Cornelis-sen, 1999). It is even possible that other factors, such as herbivory, may also influence the geographic distribution of leaf size since small leaves are often thicker and more
re-10
sistant to herbivores. Moles and Westoby (2000) have argued that species with smaller
leaves may suffer less herbivory during leaf expansion because the leaf expands for a
shorter period. Finally, it should also be noted that while single plot-based attributes such as proportion of trees in a given leaf size category may produce useful correlates with biophysical variables at large spatial scales, these may break down under varying
15
spatial, temporal and environmental scales (Gillison and Carpenter, 1997), thus limiting their utility. However, despite these difficulties in inferring causal relationships, macro-geographic studies of functional traits, such as leaf size, clearly provide important tools to help describe the still poorly-understood functional ecology of Amazonia (ter Steege et al., 2006).
20
Acknowledgements. We thank Ingolf K ¨uhn for advice about spatial analyses; Mike Ladle
for comments and copy-editing; and the whole RAINFOR network. Corine Vriesendorp,
BGD
6, 2125–2162, 2009Leaf size in Amazonia
A. C. M. Malhado et al.
Title Page
Abstract Introduction
Conclusions References
Tables Figures
◭ ◮
◭ ◮
Back Close
Full Screen / Esc
Printer-friendly Version
Interactive Discussion
References
Ackerly, D. D.: Canopy structure and dynamics: integration of growth processes in tropical pioneer trees, in: Tropical Forest Plant Ecophysiology, Chapman and Hall, NY, US, 619–658, 1996.
Ackerly, D. D. and Donoghue, M. J.: Leaf size, sapling allometry, and Corner’s rules: phylogeny
5
and correlated evolution in maples (Acer), Am. Nat., 152, 767–791, 1998.
Ackerly, D. D. and Reich, P. B.: Convergence and correlations among leaf size and function in seed plants: a comparative test using independent contrasts, Am. J. Bot. 9, 1272–1281, 1999.
Ackerly, D. D.: Functional strategies of chaparral shrubs in relation to seasonal water deficit
10
and disturbance, Ecol. Monogr., 74, 25–44, 2004.
Arag ˜ao, L. E. O. C., Malhi, Y., Roman-Cuesta, R. M., Saatchi, S., Anderson, L. O., and Shimabukuro, Y. E.: Spatial patterns and fire response of recent Amazonian droughts, Geo-phys. Res. Lett., 34, L07701, doi:10.1029/2006GL028946, 2007.
Baker, T. R., Phillips, O. L., Malhi, Y., Almeida, S., Arroyo, L., Di Fiore, A., Erwin, T., Killeen, T.,
15
Laurance, S. G., Laurance, W. F., Lewis, S. L., Lloyd, J., Monteagudo, A., Neill, D. A., Pati ˜no,
S., Pitman, N. C., Silva, J. N. M., and V ´asquez-Mart´ınez, R.: Variation in wood density
determines spatial patterns in Amazonian forest biomass, Global Change Biol., 10, 1–18, 2004.
Baker, T. R. and Lopez-Gonzalez, G.: Wood density, in: RAINFOR: Functional Traits Database,
20
Date of extraction: August 2006.
Barajas-Morales, J.: Wood specific gravity in species from two tropical forests in Mexico, IAWA Journal, 8, 143–148, 1987.
Cain, S. A., Oliveira Castro, G. M., Pires, J. M., and da Silva, N. T.: Application of some phytosociological techniques to Brazilian rain forest, Am. J. Bot., 43, 911–941, 1956.
25
Chave, J., Muller-Landau, H. C., Baker, T. R., Easdale, T. A., ter Steege, H., and Webb, C. O.: Regional and phylogenetic variation in wood density among 2456 Neotropical tree species, Ecol. Appl., 16, 2356–2367, 2006.
Cornelissen, J. H. C.: A triangular relationship between leaf size and seed size among woody species: allometry, ontogeny, ecology and taxonomy, Oecologia, 118, 248–255, 1999.
30
Dawkins, R.: The Extended Phenotype, Oxford University Press, Oxford, 1982.
BGD
6, 2125–2162, 2009Leaf size in Amazonia
A. C. M. Malhado et al.
Title Page
Abstract Introduction
Conclusions References
Tables Figures
◭ ◮
◭ ◮
Back Close
Full Screen / Esc
Printer-friendly Version
Interactive Discussion Western Hemisphere, B. Torrey. Bot. Club., 107, 154–162, 1980.
Dutilleul, P.: Modifying the t-test for assessing the correlation between 2 spatial processes, Biometrics, 49, 305–314, 1993.
Falster, D. S. and Westoby, M.: Leaf size and angle vary widely across species: what conse-quences for light interception?, New. Phytol., 158, 509–525, 2003.
5
Gillison, A. N. and Carpenter, G.: A generic plant functional attribute set and grammar for dynamic vegetation description and analysis, Funct. Ecol., 11, 775–783, 1997.
Givnish, T. J.: On the adaptive significance of compound leaves, with particular reference to tropical trees, in: Tropical Trees as Living Systems, Cambridge University Press, New York, USA, 351–380, 1978.
10
Givnish, T. J.: On the adaptive significance of leaf form, in: Topics in Plant Population Biology, Columbia University Press, New York, USA, 375–407, 1979.
Givnish, T. J.: Leaf and canopy adaptations in tropical forests, in: Physiological ecology of plants in the wet tropics, Junk, The Hague, Netherlands, 51–58, 1984.
Givnish, T. J.: Comparative studies of leaf form – assessing the relative roles of selective
15
pressures and phylogenetic constraints, New. Phytol. 106, 131–160, 1987.
Givnish, T. J. and Vermeij, G. J.: Sizes and shapes of liana leaves, Am. Nat. 110, 743–778, 1976.
Grubb, P. J., Lloyd, J. R., Pennington, T. D., and Whitmore, T. C.: A comparison of montane and lowland rain forest in Ecuador I. The forest structure, physiognomy, and floristics, J. Ecol.,
20
51, 567–601, 1963.
Huffman, G. J. and Bolvin, D. T.: TRMM and Other Data Precipitation Data Set Documentation,
Laboratory for Atmospheres, NASA Goddard Space Flight Center and Science Systems and Applications, Inc., 2007.
Kelly, D. L., Tanner, E. V. J., Nic Lughadha, E. M., and Kapos, V.: Floristics and biogeography
25
of a rain forest in the Venezuelan Andes, J. Biogeogr., 21, 421–440, 1994.
Legendre, P.: Spatial autocorrelation: trouble or new paradigm?, Ecology, 74, 1659–1673, 1993.
Lloyd, J. and Farquhar, G. D.: Effects of rising temperatures and [CO2] on the physiology of
tropical forest trees, Philos. T. Roy. Soc. B, 363, 1811–1817, 2008.
30
Malhado, A. C. M.: The Functional Biogeography of Leaves of the Amazonian Rainforest, Ph.D. Thesis, Oxford University Centre for the Environment, Oxford University, UK, 2008.
BGD
6, 2125–2162, 2009Leaf size in Amazonia
A. C. M. Malhado et al.
Title Page
Abstract Introduction
Conclusions References
Tables Figures
◭ ◮
◭ ◮
Back Close
Full Screen / Esc
Printer-friendly Version
Interactive Discussion Grace, J., Higuchi, N., Killeen, T., Laurance, W. F., Lea ˜no, C., Lewis, S., Meir, P., Monteagudo,
A., Neill, D., N ´u ˜nez Vargas, P., Panfil, S. N., Pati ˜no, S., Pitman, N., Quesada, A., Rudas, A., Salom ˜ao, R., Saleska, S., Silva, N., Silveira, M., Sombroek, W. G., Valencia, R., V
´asquez-Mart´ınez, R., Vieira, I. C. G., and Vinceti, B.: An international network to understand the
biomass and dynamics of Amazonian forests (RAINFOR), J. Veg. Sci., 13, 439-450, 2002.
5
Malhi, Y., Baker, T. R., Phillips, O. L., Almeida, S, Alvarez, E., Arroyo, L., Chave, J., Czimczik, C. I., Di Fiore, A., Higuchi, N., Killeen, T. J., Laurance, S. G., Laurance, W. F., Lewis, S. L., Mercado, L. M., Monteagudo, A., Neill, D. A., N ´u ˜nez Vargas, P., Pati ˜no, S., Pitman, N. C. A.,
Quesada, C. A., Silva, N., Torres Lezama, A., V ´asquez-Mart´ınez, R., Terborgh, J., Vinceti,
B., and Lloyd, J.: The above-ground coarse woody productivity of 104 Neotropical forest
10
plots, Global Change. Biol., 10, 563–591, 2004
Midgley, J. J. and Bond, W. J.: Leaf size and inflorescence size may be allometrically related traits, Oecologia, 78, 427–429, 1989.
Moles, A. T. and Westoby, M.: Do small leaves expand faster than large leaves, and do shorter expansion times reduce herbivore damage?, Oikos, 90, 517–524, 2000.
15
Parkhurst, F. and Loucks, L.: Optimal leaf size in relation to environment, J. Ecol., 60, 505–537, 1972.
Peacock, J., Baker, T. R., Lewis, S. L., Lopez-Gonzalez, G., and Phillips, O. L.: The RAINFOR database: monitoring forest biomass and dynamics, J. Veg. Sci., 18, 535–542, 2007. Pleysier, J. L. and Juo, A. S. R.: A single-extraction method using silver-thiourea for measuring
20
exchangeable cations and effective CEC in soils with variable charges, Soil Sci., 129, 205–
211, 1980.
Quesada, C. A.: Soil Vegetation Interactions across Amazonia, Unpublished PhD, Leeds Uni-versity, UK & RAINFOR, 2008.
Rangel, T. F. L. V. B., Diniz-Filho, J. A. F., and Bini, L. M.: Towards an integrated computational
25
tool for spatial analysis in macroecology and biogeography, Global Ecol. Biogeogr., 15, 321– 327, 2006.
Raunkiaer, C.: The Life Forms of Plants and Statistical Plant Geography, Oxford University Press, Oxford, 632 pp., 1934.
Richards, P. W.: The Tropical Rain Forest: an Ecological Study, Cambridge University Press,
30
Cambridge, 1952.
BGD
6, 2125–2162, 2009Leaf size in Amazonia
A. C. M. Malhado et al.
Title Page
Abstract Introduction
Conclusions References
Tables Figures
◭ ◮
◭ ◮
Back Close
Full Screen / Esc
Printer-friendly Version
Interactive Discussion ter Steege, H., Pitman, N., Sabatier, D., Castellanos, H., Van der Hout, P., Daly, D. C., Silveira,
M., Phillips, O., V ´asquez-Mart´ınez, R, Van Andel, T., Duivenvoorden, J., de Oliveira, A. A.,
Ek, R., Lilwah, R., Thomas, R., Van Essen, J., Baider, C., Maas, P., Mori, S., Terborgh, J., Vargas, P. N., Mogoll ´on, H., Morawetz, W.: A spatial model of tree alpha-diversity and tree density for the Amazon, Biodiv. Conser., 12, 2255–2277, 2003.
5
ter Steege, H., Pitman, N. C. A., Phillips, O. L., Chave, J., Sabatier, D., Duque, A., Molino, J.
F., Prevost, M. F., Spichiger, R., Castellanos, H., von Hildebrand, P., and V ´asquez-Mart´ınez,
R.: Continental-scale patterns of canopy tree composition and function across Amazonia, Nature, 443, 444–447, 2006.
Thompson, J., Proctor, J., Viana, V., Milliken, W., Ratter, J. A., and Scott, D. A.: Ecological
10
studies on a lowland evergreen rain forest on Maraca Island, Roraima, Brazil. I. Physical environment, forest structure and leaf chemistry, J. Ecol., 80, 689–703, 1992.
Turner, I. M.: The Ecology of Trees in the Tropical Rainforest, Cambridge University Press, Cambridge, 2001.
V ´asquez-Mart´ınez, R.: Fl ´orula de las Reservas Biol ´ogicas de Iquitos, Per ´u, Missouri Botanical
15
Garden Press, St. Louis, 1997.
Webb, L. J.: A physiognomic classification of Australian rain forests, J. Ecol., 47, 551–570, 1959.
Westoby, M., Falster, D. S., Moles, A. T., Vesk, P. A., and Wright, I. J.: Plant ecological strate-gies: some leading dimensions of variation between species, Annu. Rev. Ecol. Syst., 33,
20
125–159, 2002.
Wiemann, M. C. and Williamson, G. B.: Geographic variation in wood specific gravity: effects
of latitude, temperature, and precipitation, Wood. Fiber. Sci., 34, 96–107, 2002.
Wright, I. J., Ackerly, D. D., Bongers, F., Harms, K. E., Ibarra-Manriquez, G., Martinez-Ramos, M., Mazer, S. J., Muller-Landau, H. C., Paz, H., Pitman, N. C. A., Poorter, L., Silman, M.
25
BGD
6, 2125–2162, 2009Leaf size in Amazonia
A. C. M. Malhado et al.
Title Page
Abstract Introduction
Conclusions References
Tables Figures
◭ ◮
◭ ◮
Back Close
Full Screen / Esc
Printer-friendly Version
Interactive Discussion
Table 1. List of floras and herbaria used as information sources and number of species
re-trieved from each source.
Source Total Species
1. Neotropical Herbarium Specimens – The Field Museum 1918
2. New York Botanical Garden 160
3. The Nationaal Herbarium Nederland (NHN) 159
4. Fl ´orula de las Reservas Biol ´ogicas de Iquitos, Per ´u V ´asquez-Mart´ınez (1997) 154
5. Mobot – Missouri Botanical Gardens Herbarium 140
6. Centre IRD de Cayenne, French Guiana 99
7. Instituto Nacional de Pesquisas da Amaz ˆonia Herbarium, INPA, Brazil 55
8. Botanic Garden and Botanical Museum, Berlin, Germany 18
9. Cain et al. (1954) 18
10. Museu Paraense Emilio Goeldi Herbarium, Brazil 16
11. Oxford University – Plant Science Herbarium, UK 13
12. The Herbarium of the University of Aarhus, AAU, Denmark 9
13. HerbW – Virtual Herbaria Austria 4
14. http://images.nbii.gov/ 2
BGD
6, 2125–2162, 2009Leaf size in Amazonia
A. C. M. Malhado et al.
Title Page
Abstract Introduction
Conclusions References
Tables Figures
◭ ◮
◭ ◮
Back Close
Full Screen / Esc
Printer-friendly Version
Interactive Discussion
Table 2. Derivation and correspondence of leaf size categories used in study. Collapsed
categories are used as dependent variables in analyses.
Category Dimensions Raunkiaer (1931) Webb (1959) Collapsed Categories
1 <0.25 cm2 Leptophyll
Small Leaves
2 0.25–2.25 cm2 Nanophyll
3 2.25–20.25 cm2 Microphyll
4 20.25–45.0 cm2
Mesophyll Notophyll
5 20.25–182.25 cm2 Mesophyll
Large leaves
6 182.25–1640.25 cm2 Macrophyll
“Very-large” leaves
BGD
6, 2125–2162, 2009Leaf size in Amazonia
A. C. M. Malhado et al.
Title Page
Abstract Introduction
Conclusions References
Tables Figures
◭ ◮
◭ ◮
Back Close
Full Screen / Esc
Printer-friendly Version
Interactive Discussion
Table 3.OLS regression analysis of large leaves of species and individual trees (and variation
of sub-datasets: small DBH, median DBH, large DBH, only Fabaceae trees, Fabaceae trees removed) in relation to climatic variables controlled for spatial autocorrelation. Spatial structure was accounted for in all regressions by adding eigenvector filters produced with the PCNM. Filters were omitted and only plots with measurements for all variables were used in the
re-gressions. CV=coefficient of variation in water availability (see methods). MWD=maximum
water deficit.
Species with large leaves Species with “very-large” leaves Std. Coeff./ Coeff t p Std. Coeff./Coeff t p
Rainfall 0.273 (<0.001) 1.249 0.214 0.152 (<0.001) 0.598 0.551 CV −0.441 (−0.004) −2.541 0.012∗
0.067 (<0.001) 0.319 0.75 Length dry 1.385(0.089) 4.511 <0.001∗
0.354 (0.024) 1.022 0.309 MWD 0.808 (<0.001) 4.354 <0.001∗
0.052 (<0.001) 0.249 0.804 Individuals with large leaves Individuals with “very-large” leaves Std. Coeff./Coeff. t p Std. Coeff./Coeff t p
Rainfall 0.266 (<0.001) 1.355 0.178 −0.106 (<0.001) −0.433 0.666 CV 0.089 (−0.003) −0.594 0.554 −0.086 (−0.001) −0.458 0.648 Length dry 0.336 (0.07) 1.289 0.2 −0.049 (−0.006) −0.151 0.881 MWD −0.051 (<0.001) −0.311 0.756 0.071(<0.001) 0.303 0.762
Small individuals (DBH<200 mm) with large leaves
Small individuals (DBH<200 mm) with “very-large” leaves
Std. Coeff./Coeff. t p Std. Coeff./Coeff. t p
Rainfall −0.312 (<0.001) −0.835 0.406 −0.135 (<0.001) −0.412 0.681 CV 0.086 (0.001) 0.327 0.744 0.157 (0.002) −0.622 0.536 Length dry −0.035 (−0.004) −0.08 0.937 0.093 (0.009) −0.213 0.832 MWD 0.496 (<0.001) 1.618 0.109 0.476 (<0.001) 1.417 0.16
Medium individuals (DBH>200 and
<400 mm) with large leaves
Medium individuals (DBH>200 and
<400 mm) with “very-large” leaves Std. Coeff./Coeff. t p Std. Coeff./Coeff. t p
Rainfall −0.494 (0.001) −1.457 0.149 −0.346 (<0.001) 1.111 0.27 CV 0.127 (0.001) 0.545 0.588 0.121 (0.001) 0.521 0.604
Length dry 0.246 (0.023) 0.576 0.566 −0.581 (−0.059) −1.428 0.157 MWD 0.791 (0.001) 2.778 0.007∗
BGD
6, 2125–2162, 2009Leaf size in Amazonia
A. C. M. Malhado et al.
Title Page
Abstract Introduction
Conclusions References
Tables Figures
◭ ◮
◭ ◮
Back Close
Full Screen / Esc
Printer-friendly Version
Interactive Discussion
Table 3.Continued.
Large individuals (DBH>400 mm) with large leaves
Large individuals (DBH>400 mm) with “very-large” leaves
Std. Coeff./Coeff. t p Std. Coeff./Coeff. t p
Rainfall 0.084 (<0.001) 0.237 0.813 −0.248 (<0.001) −0.77 0.444 CV −0.29 (−0.005) −1.101 0.274 −0.128 (−0.002) −0.529 0.598 Length dry 0.658 (0.097) 1.548 0.125 −0.13 (−0.013) −0.306 0.761 MWD 0.38 (<0.001) 1.357 0.178 −0.09 (<0.001) −0.315 0.754
Individuals (not Fabaceae) with large leaves
Individuals (not Fabaceae) with “very-large” leaves
Std. Coeff./Coeff. t p Std. Coeff./Coeff. t p
Rainfall 0.412 (<0.001) 1.296 0.198 0.168 (<0.001) 0.547 0.585 CV −0.26 (−0.003) −1.061 0.291 −0.199 (−0.003) −0.801 0.425 Length dry 0.65 (0.052) 1.524 0.13 0.304 (0.031) 0.7 0.486 MWD 0.066 (<0.001) 0.334 0.739 0.057 (<0.001) 0.215 0.83
Individuals (only Fabaceae) with large leaves
Individuals (only Fabaceae) with “very-large” leaves
Std. Coeff./Coeff. t p Std. Coeff./Coeff. t p
Rainfall 0.488 (<0.001) 1.487 0.14 0.059 (<0.001) 0.261 0.795 CV −0.518 (−0.0012) −1.966 0.052 −0.453 (−0.003) −2.505 0.014∗ Length dry 1.065 (0.196) 2.364 0.02∗