American Journal of Engineering Research (AJER)
e-ISSN : 2320-0847 p-ISSN : 2320-0936
Volume-03, Issue-05, pp-179-186
www.ajer.org
Research Paper Open Access
Effects of Process Parameters on the Yield of oil from Castor
Seed
1
Mbah, G.O,
2Amulu, N.F,
3Onyiah, M.I
1
Department of Chemical Engineering Enugu State University of Science and Technology, Enugu
2
Food Tech. Department Institute of Management and Technology (I.M.T) Enugu
3
Projects Development Institute (PRODA) Enugu.
Abstract: - The physicochemical properties of castor seed oil were evaluated in this work using standard
analytical technique. The results showed the percentage (%) moisture, crude lipid, crude protein, ash and carbohydrate contents of the castor seed as 0.700, 48.800, 7.200, 10.600, 31.615 respectively. The oil from the castor seed was odourless and yellowish at room temperature (30℃). The treatment combinations used (leaching time, leaching temperature and solvent: solute ratio) showed significant differences (p< 0.05) in yield of castor oil seed flour with % oil yield of 35.52 – 53.90%. Lipid indices of the castor seed oil indicated the acid value (AV) as 1.100mg NaOH/g of oil, free fatty acid (FFA) as 0.550%, saponification value (SV) as 188.300mgkOH/g of oil, iodine value (IV) as 74.700I2/g of oil, peroxide value as 1.500ml/g of oil, and
viscosity as 0.008. A standard statistical package Minitab version 16.0 program was used in the regression analysis and analysis of variance (ANOVA). The statistical software mentioned above was also used to generate various plots such as single effect, interaction plot, contour plot and 3D surface plot. The response or yield of oil extracted from castor flour was used to develop a mathematical model that correlates the yield of oil. The optimum condition obtained to give the highest yield of castor oil extraction are leaching time of 2hrs, leaching temperature of 50℃ and solute: solvent ratio of 0.05g/ml.
I. INTRODUCTION
Seed oils have extensive demand both for human consumption and for industrial applications (Kyari, 2008) and also have been rated as the second most valuable commodity in the world trade today (Ige et al., 1984). Castor oil is derived from the seeds of the plant Ricinus Communis, sometimes known as Ricinus oil (Marter, A.D. 1981). Castor oil represents a potential byproduct and is used in many technical, medical and different industrial applications like biodiesel (Amara A. A. and Salem, S. R., 2009). Castor oil derivatives are used in the production of paints, varnishes, lacquers, and other protective coatings, and as a raw material in the manufacturing of various chemicals used in the production of plasticizer and Nylon (Akpan et al., 2006). Like any other vegetable oils and animal fats, it is a triglyceride, which chemically is a glycerol molecule with each of its three hydroxyl group esterified with a long chain fatty acid. Its major fatty acid is the unsaturated, hydroxylated 12-hydroxy, 9-octadecenoic acid, known familiarly as Ricinoleic acid. The fatty acid composition of a typical castor oil contains about 87% ricinoleic acid (Akpan et al., 2006).
Numerous researchers (Akubugwo et al., 2007) have carried out a lot of analytical works on seeds primarily because of extensive and increasing demands for them both for human consumption and for numerous industrial applications.
affected by the following factors- leaching time, leaching temperature and solute-to-solvent ratio. Analysis of variance ANOVA (Mark, A. and Patrick, W., 2007) will be applied to the results of the experimental design in the statistical analysis.
II. MATERIALS AND METHODS
Collection and processing of sample:
The castor seeds were bought from a shop in Ogbete main market, Enugu, Enugu state. The seeds were taken to Food Science and Technology laboratory of the Institute of Management and Technology (I.M.T) Enugu. Standard methods for sample processing, preparation and analytical procedures were used.
The castor seeds pass through various processing steps in the course of its preparation for extraction. The castor seeds were cleared of any foreign materials and dirt by handpicking. The cleaned seeds were sundried in the open air until the casing splited and shaded the seeds. The seeds were further dried in the oven at 60℃ for 7hrs to a constant weight in order to reduce its moisture content which was initially at about 5 - 7%. The separation of the shell from the nibs (cotyledon) was carried out using tray to blow away the cover in order to achieve very high yields. The seeds were then milled manually using machine set to obtain different sieve millimeter sizes. Grinding weakens or ruptures the cell walls and releases seed oils/fats for extraction (Akpan, et al., 2006 and Sepidar, et al., 2009).
III. PROXIMATE AND LIPID INDICES ANALYSIS
Proximate analysis tells the food value and nutritional composition of the food. Proximate analysis was carried out on the castor seed to determine the percentage moisture, Crude fat content, ash, protein, lipid and carbohydrate using standard method of analysis. The moisture content of the processed sample was determined by the gravimetric method of AOAC. The crude fat content of the minced sample was extracted by soxhlet apparatus method as described by (Pearson, D. 1976 and Odo, F. O. and Ishiwu, C. N.., 1999). The crude protein was determined by the Kjedahl method, the protein was calculated using the general factor 6.25 (AOAC, 1997). The percentage ash content of the sample was determined gravimetrically by the method of AOAC, while the percentage carbohydrate content was estimated as the nitrogen free extract (NFF) as outlined in AOAC (1997). The results of the proximate analyses are presented in Table 2 below.
IV. PHYSICOCHEMICAL ANALYSES OF OIL
A standard procedure of American oil chemist society was used for the lipid indices values, acid value was determined according to the method outlined in ISO 969.17 and the peroxide value was determined as outlined by AOAC (1997) of the sample. The indicator method was used in determining the saponification value as outlined by (Pearson, D., 1981). The iodine value was determined by Wij’s method as described by (Pearson, D. 1976 and Odo, F. O. and Ishiwu, C. N., 1999). The refractive index of the oil sample was determined using a refractometer according to (Kyari, M.Z. 2008). The specific gravity of the castor oil sample was described using pycometric method as described (Onwuka, G.I, 2005), while the viscosity was determined using a viscometer according to the method outlined by AOAC, 1997. The results are shown in Table 3.
V. OIL EXTRACTION
The extraction of oil from the processed flour was done using solid-liquid extraction otherwise known as leaching.2g of the castor flour was dispersed in 40ml of n-hexane and heated for 1hr at 40℃ to leach out the oil. as shown in Table 1 below. The weighed flour sample was dispersed in the given volume of solvent and subjected to the heating temperature and time in a water bath. At the end of the process, the supernatant (oil solvent mixture) was decanted out and centrifuged at 900rpm for 5minutes. The clear transparent liquid obtained after centrifuge was then evaporated completely in a hot air oven and the oil was cooled, weighed and the yield calculated.
The % oil yield was calculated thus:
% = × 100
1 1
The collected results of the two-level three-factor experiments were applied in the factorial design as presented in Table 4 below.
VI. EXPERIMENTAL DESIGN
Table 1: Experimental design showing the treatments given to Castor Seed Flour (CAF) S/No Code Leaching Time
(hr)(X1)
Leaching temp. (℃) (X2)
Wt. of flour(g)/Vol. of solvent (ml) (X3)
1 CAF1 1 40 2: 40
2 CAF2 2 50 2: 40
3 CAF3 2 40 2: 30
4 CAF4 2 40 2: 40
5 CAF5 1 50 2: 30
6 CAF6 2 50 2: 30
7 CAF7 1 50 2: 40
8 CAF8 1 40 2: 30
VII. RESULTS AND DISCUSSION.
Table 2 above shows the proximate composition of castor seed oil. Results from the present investigation show that the castor seeds are of high nutritional value. The proximate composition, being the nutrient composition, show high values of fat, carbohydrate and ash. The ash content exhibiting high values is an indication that the castor seeds are also high in minerals. This is because the minerals are imbedded in the ash, and therefore have a positive correlationship. Castor seed is also a good source of edible oil and fat which when ingested metabolizes to give energy and other fats soluble vitamins. Protein content of the seed is 7.2%
which is however lower than obtainable in beans ranged between7.5%-40%.
(www.healthaliciouness.com/articles/beans-legumes-highest protein.php).The average fat content of castor seeds (48.80%) agrees with the values (46.3%) respectively by Achinewu (1982) and 47.4% by Odoemelam (2005) respectively.
Key: V = viscosity, AV = acid value, SG = specific gravity, PV = peroxide value, SV = Saponification value, FFA = free fatty acid.
Table 4 shows the result of percentage oil yield from the castor seeds. The castor oil is extracted using different process treatment combinations for the 8 samples. For example the oil yield of samples 1 and 2 for castor seed flour differed very significantly thus the superscripts a and b for sample 1 and 2 respectively. The treatments given to samples 2 and 4 for castor have no significant difference in the oil yield and likewise samples 5 and 6. The percentage oil yield ranged between 35.52 – 53.90% as shown in Table 4 below. Treatments given to samples 2 and 4 exhibited the highest percentage oil yield (53.90 and 53.52% respectively). The least percentage oil yield of castor flour was observed in sample 8 (35.52 %).
VIII. STATISTICAL ANALYSIS OF FACTORS AFFECTING OIL YIELD
All extraction and analysis were performed in duplicate. Results were expressed as mean ± �tandard Deviation (SD). The design of experiment selected for this study is two level- three factor factorial design and the response measured is the yield of oil from the castor flour. The three parameters studied are leaching time, leaching temperature and solute/solvent concentration. Fishers least significant difference (LSD) was used to identify significant differences among treatment means at p≤0.05 using a statistical package (SPSS version 17.0). Minitab version 16.0 program was used in the regression analysis and analysis of variance (ANOVA). The statistical softwares mentioned above were also used to generate single effect plots, interaction plots, contour plots and 3D surface plots shown below. The response or yield of oil extracted from the castor flour was used to develop a mathematical model that correlates the yield of oil i.e. castor oil to the process variables studied.
�= + 1 1 + 2 2 + 3 3 + 12 12 + 13 13 + 23 23 (2)
Where Y is the predicted response, a is the value of the fixed response or intercept; 1, 2, 3 are the linear
coefficients for the input factors 1, 2, 3; 12, 13, 23 are the interaction effects coefficients regression
terms, respectively; 1, 2, 3 are the levels of independent variables.
Table 5 below shows the comparison of the experimental results obtained and the ASTM standard specification for castor seed oil.
Table: 5 ASTM Specification for Quality castor oil
Property Ranges Experimental Results
Acid value 0.4 – 4.0 1.100±0.028
Saponification value 175 – 187 188.300±11.391
Iodine value 82 – 88 74.700±0.283
Specific gravity 20/25℃ 0.957 – 0.968 0.932±0,013
Viscosity at 25℃ 6.3 -8.8 St 0.008±0.000
IX. SINGLE FACTOR EFFECT
The single effect of treatment combination 1, 2, 3 on the percentage oil yield is shown in Fig. 1a
2 1
52
50
48
46
44
50 40
40 30
52
50
48
46
44
Leaching t ime
%
o
il
y
ie
ld
Leaching t emp
Conc
Fig. 1a: Single Effe ct Plot for Cas tor
X. EFFECT OF INTERACTION BETWEEN PROCESS VARIABLES
The process variables were found to have significant interaction effects. Fig. 2a below show the various interactions of the process variables such as leaching time, leaching temperature and solvent/solute concentrations and their corresponding yields on the castor oil sample. The parameters were operated at two levels of low and high. The black line denotes low i.e. initial condition, while the red line denotes final condition.
The interaction effect of leaching time against leaching temperature shows that a higher yield of castor oil was extracted from the flour at a lower temperature of 40℃ shown by the black line, i.e. the line showing a positive linear movement, while at a temperature of 50℃ there was no significant increase in the yield as shown by the red line. For the interaction of leaching time and concentration both showed a positive linear movement by the black and red line which means that as leaching time and concentration is increased the yield of oil from castor oil seed also increases. The leaching temperature against concentration also showed a significant increase in the yield of castor oil as the parameters are increased from low to high as can be observed from the plot shown by the lines.
50
40 30 40
50
45
40
50
45
40
L eaching time
L eaching temp
C onc
1 2 time Leaching
40 50 temp Leaching
Fig.2a: Inte raction Effe ct of x , x and x on oil yie ld of Cas tor s e e d
XI. CONTOUR PLOTS OF OIL YIELD FROM THE CASTOR SEED
Leaching temp Co nc 50 48 46 44 42 40 40 38 36 34 32 30 > – – – – < 36 36 40 40 44 44 48 48 52 52 castor oil y ield
Fig.3a:Contour plot for oil yield of Castor seed
Leaching time Le ac hi ng t em p 2.0 1.8 1.6 1.4 1.2 1.0 50 48 46 44 42 40 > – – – – < 36
36 40 40 44 44 48 48 52 52 castor oil y ield
Fig.3c: Contour plot for oil yield of Castor seed
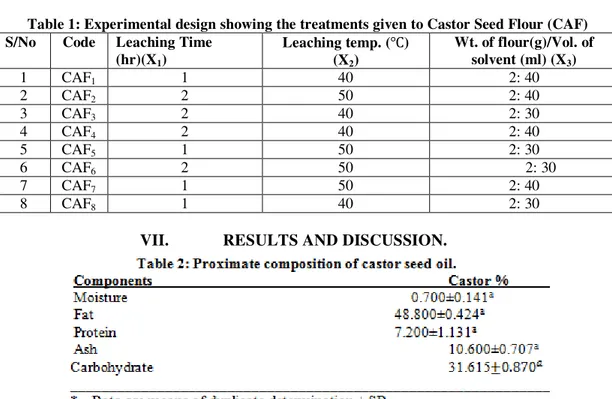
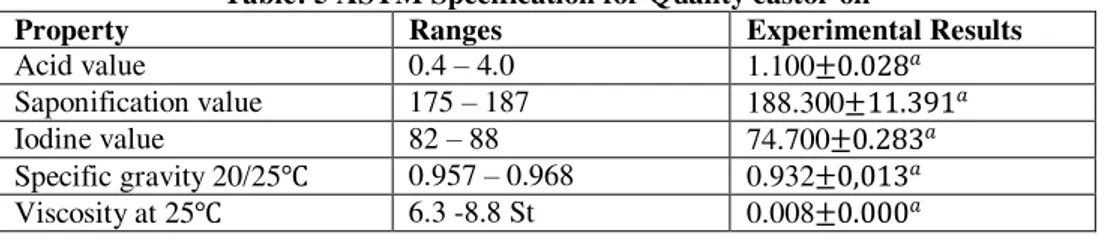
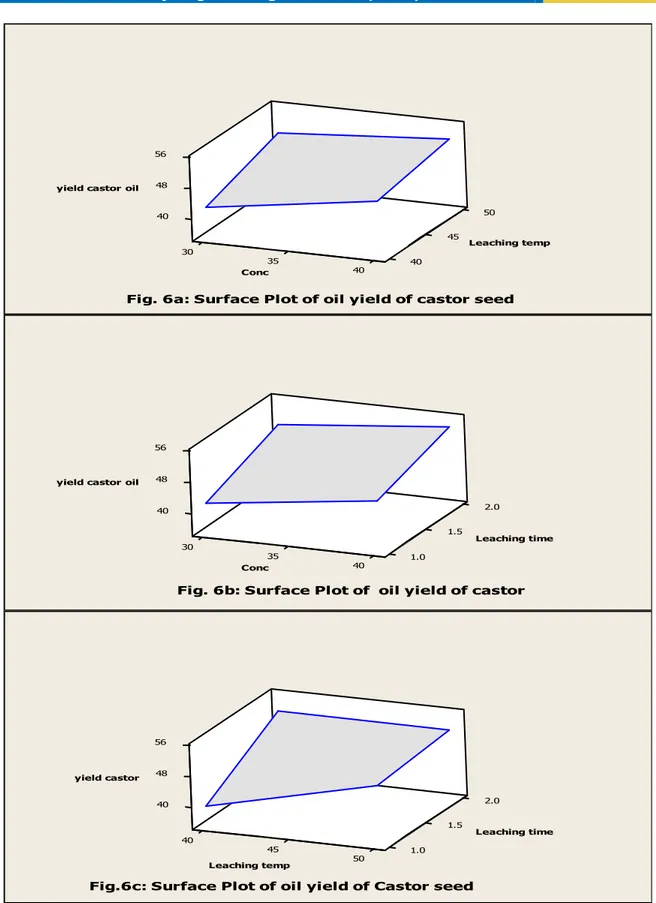
Surface plots of oil yield from castor seed
Leaching time Co nc 2.0 1.8 1.6 1.4 1.2 1.0 40 38 36 34 32 30 > – – – – < 36 36 40 40 44 44 48 48 52 52 castor oil y ield
50
45 40
48
30 56
35 40
40
yield castor oil
Leaching temp
Conc
Fig. 6a: Surface Plot of oil yield of castor seed
2.0
1.5 40
48
30 56
35 1.0
40
yield castor oil
Leaching time
Conc
Fig. 6b: Surface Plot of oil yield of castor
2.0
1.5 40
48
40 56
45 1.0
50
yield castor
Leaching time
Leaching temp
Fig.6c: Surface Plot of oil yield of Castor seed
From Fig. 4a, 4b and 4c above surface plots of oil yield from the interactive effects was observed to be the same as that of the contour plot.
XII. CONCLUSION
studied promises long shelf life for the plant seed before cultivation. The characteristics of the castor oil such as Iodine value, Peroxide value, Acid value, etc compared favourably with most of the conventional vegetable oil sold in Nigerian markets.
The study also demonstrated the use of multilevel factorial design using Minitab software version 16.0 in determining the conditions leading to the optimum yield of castor oil extraction. The optimum conditions are leaching time of 2hrs, leaching temperature of 50℃ and solute: solvent ratio of 2g: 40ml. This methodology could therefore be successfully employed to any process where an analysis of the effects and interaction of many experimental factors are studied.
REFERNCES
[1] Achinewu, S.C. (1982). Nutritional composition of Jackbean and star apple seed. Nigeria journal of science 8: 71 – 81.
[2] Akpambang, V.O.E. Amoo, I.A. and Izuagie, (2008). Comparative studies on oils from some common plant seeds in Nigeria. Pak. J. Nutr. 7: 570 – 573.
[3] Akpan U.G, Jimoh, A, and Mohammed A.D (2006). Extraction, Characterization and modification of castor seed oil, Leonardo Journal of sciences (8), p. 43 – 52
[4] Akubugwo, I.E., Obasi, N.A., Chinyere, G.C., and Ugbogu, A.E., (2007). Nutritional and Chemical value of Amaranthus hybridusn L. Leaves from Afikpo, Nigeria. Afr. J. Biotechnol., 6: 2833-2839.
[5] Amara, A.A and Salem, S.R (2009). Dehydration of castor oil and lipase production by pseudomonas aeruginosa, American – Eurasian J. Agric. And Environ. Sci., 5(4), p. 556 – 563.
[6] AOAC, (1997). Official methods of analysis of the association of analytical chemistry 5th Ed.
Washington DC.
[7] Codex Alimentarius Commission (1982). Recommended internal standard for edible fats and oils Ed. Journal vol 11: FAO/WHO Rome pp 1 – 179.
[8] Dhellot, J R. Matouba, E. Maloumbi, M.G. Nzikou, J.M. Ngoma, D.G.S and Linder, M. (2006). Extraction, chemical composition and nutritional characteristics of vegetable oils: case of Amaranthus hybridus (var. 1 and 2) of Congo Brazzaville. African journal of biotechnology, 5(11): 1095 – 1101.
[9] Elert, G. (2000). Density of cooking oil in the physics facebook online,
http://hypertextbook.com/facts/2000/inga dorfman.html.
[10] Ige, M.M., Ogunsua, A.O. and Oke, O.L (1984). Functional properties of the proteins of some Nigerian oil seeds, Conophor seeds and three varieties of melon seeds. Journal of agric food chem.., 32: 822- 825 [11] Igwe, J. and Mbah, G. O., 2011, Effect of Some Process Parameters on the Optimum Yield of Oil from
Soya Bean , Journal of Science and Technology. (JST),Vol. 17(1) pp 82-92
[12] Kyari, M.Z. (2008). Extraction and characterization of seed oils, Agro-physics 22: 139 – 142. [13] Marter, A.D. (1981). Markets utilization and prospects, tropical product institute, G152, P. 55 – 78 [14] Odo, F.O. and Ishiwu, C.N. (1999). Experimental processes for food and water analysis. Computer Edge
publishers Enugu pp 27 – 30.
[15] Odoemelam, S.A. (2005). Proximate composition and selected physicochemical properties of the seeds of African oil bean (penaclethra marcophylla). Pakistan journal of nutrition 3.4(6): 382 – 38
[16] Onwuka, G.I. (2005). Food analysis and instrumental theory and practical, Naphtali printers Lagos pp 72
– 75.
[17] Pearson, D. (1976). The chemical analysis of foods, Churchill Livingstone NewYork pp 6 – 15, 488 – 494.
[18] Pearson, D. (1981). The chemical analysis of foods, Churchill Livingstone England pp 504 – 530.
[19] Pirie, N.W. (1975). Food protein sources. Cambridge University press Britain pp 22 – 45, 96 – 104 [20] Sepidar, S., Zurina, Z.A, Robiah Y, and Azhari M. (2009). Extraction of oil from Jatropha seeds,
Optimization and Kinetics. American journal of Applied science 6 (7) pp 1390 – 1395.
[21] Yusuf, A.A, Adewuyi, S. and Lasisi, A.A. (2006). Physicochemical composition of leaves, meals and oils of fluted pumpkin (Telfaria occidentals) and melon (citrullus vulgaris). Agric journal 1: 32 – 35.