Spatial Scales of Genetic Structure in
Free-Standing and Strangler Figs (
Ficus
,
Moraceae) Inhabiting Neotropical Forests
Katrin Heer1,2,3*, Elisabeth K. V. Kalko3,4†, Larissa Albrecht3, Roosevelt García-Villacorta5,
Felix C. Staeps1, Edward Allen Herre4, Christopher W. Dick6
1Conservation Biology, Faculty of Biology, Philipps-University Marburg, Karl-von-Frisch-Strasse 8, 35043 Marburg, Germany,2Department of Ecology, Faculty of Biology, Philipps-University Marburg, Karl-von-Frisch-Strasse 8, 35043 Marburg, Germany,3Institute of Experimental Ecology, University of Ulm, Albert-Einstein-Allee 11, 89069 Ulm, Germany,4Smithsonian Tropical Research Institute, P.O. Box 0843–03092, Balboa, Panamá,5Institute of Molecular Plant Sciences, University of Edinburgh, Mayfield Rd, Edinburgh EH9 3JH, United Kingdom,6Department of Ecology and Evolutionary Biology, University of Michigan, 830 North University, 2019 Kraus Natural Science Building, Ann Arbor, MI 48109–1048 United States of America
†Deceased.
Abstract
Wind-borne pollinating wasps (Agaonidae) can transport fig (Ficussp., Moraceae) pollen over enormous distances (>100 km). Because of their extensive breeding areas,
Neotropi-cal figs are expected to exhibit weak patterns of genetic structure at loNeotropi-cal and regional scales. We evaluated genetic structure at the regional to continental scale (Panama, Costa Rica, and Peru) for the free-standing fig speciesFicus insipida. Genetic differentiation was detected only at distances>300 km (Jost´sDest= 0.68±0.07 &FST= 0.30±0.03 between
Mesoamerican and Amazonian sites) and evidence for phylogeographic structure (RST>>permutedRST) was only significant in comparisons between Central and South
America. Further, we assessed local scale spatial genetic structure (SGS, d8 km) in Pan-ama and developed an agent-based model parameterized with data fromF.insipidato esti-mate minimum pollination distances, which determine the contribution of pollen dispersal on SGS. The local scale data forF.insipidawas compared to SGS data collected for an additional free-standing fig,F.yoponensis(subgenusPharmacosycea), and two species of strangler figs,F.citrifoliaandF.obtusifolia(subgenusUrostigma) sampled in Panama. All four species displayed significant SGS (meanSp= 0.014±0.012). Model simulations
indi-cated that most pollination events likely occur at distances> >1 km, largely ruling out
spa-tially limited pollen dispersal as the determinant of SGS inF.insipidaand, by extension, the other fig species. Our results are consistent with the view thatFicusdevelops fine-scale SGS primarily as a result of localized seed dispersal and/or clumped seedling establish-ment despite extensive long-distance pollen dispersal. We discuss several ecological and life history factors that could have species- or subgenus-specific impacts on the genetic structure of Neotropical figs.
a11111
OPEN ACCESS
Citation:Heer K, Kalko EKV, Albrecht L, García-Villacorta R, Staeps FC, Herre EA, et al. (2015) Spatial Scales of Genetic Structure in Free-Standing and Strangler Figs (Ficus, Moraceae) Inhabiting Neotropical Forests. PLoS ONE 10(7): e0133581. doi:10.1371/journal.pone.0133581
Editor:Wolfgang Arthofer, University of Innsbruck, AUSTRIA
Received:May 19, 2014
Accepted:June 30, 2015
Published:July 30, 2015
Copyright:This is an open access article, free of all copyright, and may be freely reproduced, distributed, transmitted, modified, built upon, or otherwise used by anyone for any lawful purpose. The work is made available under theCreative Commons CC0public domain dedication.
Funding:The project was funded by a scholarship from the German National Merit Foundation (Studienstiftung des Deutschen Volkes) to KH and NSF funding (DEB 0640379) to CWD. The funders had no role in study design, data collection and analysis, decision to publish, or preparation of the manuscript.
Competing Interests:The authors have declared
Introduction
In contrast with high latitude forests, where wind is often the primary vector of pollen- and seed-mediated gene flow in trees, animals are the predominant pollinators and dispersers of tropical trees [1,2]. Biotic interactions thus play a vital role in gene flow and the maintenance of genetic diversity in tropical trees, and genetic based parentage analyses have shown that insects frequently transport pollen over hundreds to thousands of meters (reviewed in [2]). To date, the greatest insect-mediated pollen dispersal distance of 160 km [3] has been recorded for a fig tree (Ficusspp., Moraceae). Fig trees have specialized, often species-specific relationships with minute (1–2 mm) wasps in the family Agaonidae [4,5,6]). Although fig-pollinating wasps are weak flyers and live only 1–2 days, they can be carried long distances by wind currents [3,7]. Figs, particularly in the Neotropics, typically occur at low population densities (e.g. one adult/ha). Further, they flower asynchronously, which increases the already large distances between potential mates [4]. Thus, large pollen dispersal distances in figs are the rule rather than the exception and breeding areas are considered to be huge [7]. Some authors have even suggested that figs might be panmictic at regional spatial scales [8,9].
There is some debate about how patterns of gene dispersal distances, and therefore spatial genetic structure (SGS), are likely to differ amongFicuslife forms and subgenera [10,11,12]. For example, functionally dioecious figs of Paleotropical forests are often small in stature, and have clumped distributions and locally dispersing wasp pollinators [10,11,13], traits which could impede long distance gene flow and enhance SGS relative to monoecious species
(Table 1). Dev et al. [11] hypothesized that Neotropical species should exhibit weaker SGS than the Indian species in their study, and in dioecious PaleotropicalFicusmore generally. Nazareno et al. [12] subsequently performed an SGS analysis of two fig species (subgenusUrostigma) in Brazil and indeed found evidence of significantly lower SGS as measured by theSpstatistic, which measures degree of SGS [14].
Within the NeotropicalFicus, the two subgenera exhibit contrasting life histories that could further influence genetic structure (seeTable 1). For example, free-standing figs (subgenus
Pharmacosycea) require high light intensities mostly encountered in large light gaps [15], which could lead to clumped pattern of seedling recruitment. In contrast, strangler figs (subge-nusUrostigma) establish as hemi-epiphytes on host trees, rendering effective seed dispersal a more spatially random process.
Table 1. Characteristics of the four studied NeotropicalFicusspecies.Calculation of Nearest Neighbour distance (median with 25th /75th percentile in parentheses) is based on census data by Albrecht, Kalko and Handley.
Species Ficus insipidaWilld. Ficus yoponensisDesv. Ficus citrifoliaMill. Ficus obtusifoliaKunth
Subgenus Pharmacosycea Urostigma
Growth form large, free-standing trees mostly stranglers or hemi-epiphytes
Regeneration in light gaps on host trees
Flowering pattern asynchronous in population
Pollen dispersal distances
wide ranging (>10 km)
Main seed dispersers frugivorous bats (Phyllostomidae)
Pollinatingfig wasp Tetrapus costaricanusGrandi, 1925
Tetrapus ecuadoranusGrandi, 1934
Pegoscapus tonduziGrandi, 1919
Pegoscapus Hoffmeyeri
Grandi, 1934
Fruit weight 9.5±1.3 g 3.1±0.7 g 1.6±0.3 g 9.5±1.4 g
Tree density (in m) 36 (16–87)1 94 (37–208)1 98 (38–231)1 99 (49–209)1
References [65,78]
At the biogeographic scale, genetic structure has been shown for several fig species [16,17]. A recent study of the free-standing Neotropical speciesFicus insipidasubs.insipidashowed sig-nificant cpDNA haplotype differentiation between Mesoamerican and western Amazon sam-ples [18]. Using a molecular clock approach, these authors suggested a mid-Miocene (14.6 Ma, range 5.1 to 26.4 Ma) divergence time of the South and Central American haplotypes. Given the absence of differentiation at the nuclear ITS locus, the authors suggested that the phylographic structure was caused primarily by seed dispersal limitation combined with the geo-graphically isolating effects of the northern Andes and Llanos region.
Here we present an analysis of genetic structure in Neotropical figs based on nuclear micro-satellite data. Our study spans local, regional, and continental spatial scales forFicus insipida, and compares local scale spatial genetic structure (SGS) in an additional free-standing fig,
F.yoponensis(subgenusPharmacosycea), and two species of strangler figs,F.citrifoliaand
F.obtusifolia(subgenusUrostigma) within Panama. Using data fromF.insipida, we developed and parameterized an agent-based model to estimate minimum pollen dispersal distances. We then evaluated the extent to which pollen dispersal is expected to drive SGS in our study spe-cies. Finally, in order to determine whether our microsatellite data concurs with results from plastid and ITS sequences in showing population differentiation forF.insipidaacross its distri-bution range [18], we sampled the widespread speciesF.insipida(subgenusPharmacosycea) broadly within the Panama Canal Watershed, and in Costa Rica and Peru and tested for phylo-geographic structure at these nuclear loci.
Material & Methods
Studied species
There are more than 750Ficusspecies (family Moraceae) worldwide [19,20] from monoecious and functionally dioecious subgenera. In the Neotropics, only monoecious species of two of the four acknowledged fig subgenera are present [21]. Molecular and morphological evidence sug-gest that subgenusPharmacosyceais phylogenetically distant fromAmericana[22]. Trees of the subgenusPharmacosyceaare pollinated by fig wasps of the genusTetrapus(Agaonidae) and grow as free-standing trees that mostly establish in early successional stages due to their initial dependency on high light intensity [15]. Species belonging to the subgenusUrostigma
(sectionAmericana) grow mostly as hemi-epiphytes or strangler figs on host trees (hereafter we will refer toUrostigmaas“strangler figs”).Americanafigs are pollinated by fig wasps of the genusPegoscapus[19].
In our study area in Panama, 13 of 16 fig species ripen medium to large, green, inconspicu-ous fruits that are mostly removed at night [23] suggesting that the seeds are mainly dispersed by fruit-eating bats of the Neotropical family of leaf-nosed bats (Phyllostomidae, Chiroptera). We concentrated our study on the most common and widespread speciesF.insipida. At the local scale we included a second free-standing fig speciesF.yoponensis, and two species of strangler figs,F.citrifoliaandF.obtusifolia, all of which are mainly dispersed by fruit-eating bats.Ficus obtusifoliausually grows as a strangler fig or hemi-epiphyte, and seldom as free-standing tree. Large individuals are most frequently found in mature forests. In contrast,F.
citrifoliamostly grows as a small hemi-epiphyte or bush and is frequently found on palm trees in the study area (seeTable 1for more details on the studied species).
Study sites and sampling
mid-December to mid-April. The largest island in the BCNM with about 15.6 km2is Barro Colo-rado Island (BCI) where adult figs have been censused repeatedly since 1973 [24,25]. Since 1982, fig populations have been censused along the shoreline of many additional islands and peninsulas (Albrecht, Herre, unpubl. data), and we collected samples of a high number of indi-viduals despite the low population densities of the four targeted fig species. The free-standing
F.insipida(n = 190) is by far the most common fig species in the vicinity of the Panama Canal and relatively abundant along the shoreline as well as on the North-Eastern part of BCI which is covered by secondary forest of about 90–150 years [26]. In contrast, the free-standing fig
F.yoponensis(n = 37) is relatively rare along most shorelines and thus sampling was limited to the secondary forest on BCI. The strangler figsF.citrifolia(n = 62) andF.obtusifolia(n = 59) were mostly sampled along the shoreline, as few individuals are known from the core region of the main island (S1 Fig). Because exhaustive census data are restricted to the main island and to the shoreline of the surrounding islands and peninsulas, we were not able to determine the overall fig tree density but calculated Nearest Neighbor (NN) distances based on all censused individuals (Table 1).
Our focal speciesF.insipidawas additionally sampled at several sites within the Panama Canal watershed. First, we collected samples along a 7 km stretch of Pipeline Road (PLR in the following, n = 155), within in Soberanía National Park, for more intensive studies of spatial genetic structure, including a comparison of SGS in adults (dbh10 cm, n = 67) and saplings (<3 m in height and with soft leaves, n = 73). While mostly situated within 20 m from the dirt road, some individuals were located up to 600 m in the forest interior (S1 Fig). At the regional scale, we sampledF.insipidain the eastern sector of Soberanía National Park, close to the town of Gamboa, and in Parque Nacional San Lorenzo on the Caribbean Coast. All sampling sites Fig 1. Sampling sites ofF.insipidalocated along the Panama Canal.Black dots indicate sampled individuals. (BCNM: Barro Colorado Nature Monument, BCI: Barro Colorado Island, PLR: Pipeline Road, detailed maps for all species sampled in BCNM are presented inS3 Fig).
were located close to the Panama Canal and spanned a total distance of about 43 km (Fig 1). To test for genetic differentiation over biogeographic scales, we sampledF.insipidafrom Costa Rica and northern Amazonian Peru. In Costa Rica, samples were collected in and around Tir-imbina Ecological Reserve in Sarapiqui. In Peru, samples were obtained from sites in the Peru-vian regions Loreto and San Martín (seeS1 Tablefor geographic coordinates and numbers of samples for each site).
Leaves were collected either directly from the crown or in a few cases from the ground below the canopy if there were no conspecific trees nearby and if the leaves were still green. All leaf samples were immediately transferred to Ziploc bags containing silica gel. Due to the gen-erally low tree densities and the concentration of most individuals along the shorelines or forest roads, we did not follow a particular sampling scheme [14,27], but rather sampled as many individuals as feasible.
Ethic statement
Permits for sample collection in protected areas and sample export were obtained from the Autoridad Nacional del Ambiente, Panama (ANAM, Permit No. SC/AP-2-10 and SEX/AP-8-10), Ministerio del Ambiente, Energía y Telecomunicaciones, Costa Rica (MINAET, Permit No. 047–142 2010_SINAC) and Instituto Nacional de Recursos Naturales, Peru (INRENA, Autorización No. 029 -2004-INRENA-IFFS-DCB).
Genotyping
DNA was extracted from ca. 10 mg of desiccated leaf tissue using a modified CTAB protocol [28]. We scored 7 to 10 nuclear microsatellite loci for each species (S2 Table) with markers that were developed from an EST library ofF.citrifoliaandF.popenoei[29] or were published pre-viously [30,31]. Details on PCR conditions and genotyping are described in Heer et al. [29]. We used one fluorescently labeled primer that could be applied universally with all microsatel-lites via an attached M13 adaptor sequence [32]. For genotyping, we pooled 2–4 loci using 1μl of each PCR product in 12μl formamide and a ROX500 internal standard (Applied Biosys-tems, Carlsbad, CA, USA). Genotyping was performed in an ABI Prism 3730 Sequencer. Alleles were scored with GeneMarker V1.97 Demo Version (SoftGenetics, State College, PA, USA). Samples were only included in the final analysis when60% of the loci could be scored. We also tested a number of maternally inherited chloroplast markers (cpSSR) in order to obtain additional information on seed dispersal distances but none of them was polymorphic within the Panama Canal watershed (seeS1 Methodsfor details).Microsatellite data are within Supporting Information files(S1 Dataset).
Genetic Data Analysis
For each species and sampling site we calculated total numbers of alleles (NA), expected
hetero-zygosity (He), global estimates ofFISover alleles [33] and tested for deviations from the Hardy-Weinberg equilibrium (HWE) using Genepop 4.1 [34]. Presence of null alleles was determined with MicroChecker 2.2.3 [35]. If null alleles were present, we calculated the mean null allele fre-quency from the four estimates provided by the software.
Hardy [14]. This statistic largely circumvents the limitations of other methods (e.g. spatial autocorrelation) that are strongly dependent on sampling scheme and arbitrary choice of dis-tance classes. TheSpstatistic is defined asSp¼ b
ð1 F1Þwithbas the slope of the regression ofFij
on ln(dij), the natural logarithm of the spatial distance between individuals, andF1being the mean pairwise kinship coefficient of thefirst distance class that includes nearest neighbors (withdij<200 m for free-standingfigs anddij<300 m for stranglerfigs taking account of the density of sampled individuals). To determine the significance ofbwe conducted 9999 permu-tations of the spatial positions of all individuals. Standard errors (SE) ofbwere approximated by jackknifing. We restricted the range for regression todij= 0–3.0 km, with 3.0 km being the maximum distance of the smallest sampling area (forF.yoponensison BCI). ForF.insipida, we calculatedSpfor all samples collected in the BCNM and for samples exclusively from BCI to compare them to the results ofF.yoponensis. We always refer to theSpstatistics when discuss-ing SGS in this manuscript. When compardiscuss-ing SGS among sampldiscuss-ing sites or species we
classi-fied differences ofSpas significant if standard errors (± 2 SE) ofbdid not overlap.
In order to visualize the data for each species, we plotted meanFijfor n = 5–14 distance clas-ses such that the number of pairwise comparisons within each distance interval was approxi-mately constant. This way, the values for the first distance class do not correspond to theF1 values calculated for theSpstatistics. We obtained 95% confidence intervals (CI) by permuting
Fijof all pairs of individuals per distance class 9999 times. Standard errors were assessed by jackknifing for each distance class. All calculations were performed with the program SPAGeDi version 1.3d [37]. In addition, we regressedFijover ln(dij) in R [38] and generated plots with all pairwise comparisons and regression line (S6 Fig).
At larger spatial scales, we used Jost´sDestandFSTto determine whether there is genetic dif-ferentiation among sampling sites ofF.insipida[39]. Under a model of isolation by distance (IBD) genetic differentiation among populations is expected to increase linearly with distance [40,41]. We used GenAlEx 6.5b3 [42] to calculate pairwiseDestamong the sampling sites and SPAGeDI to calculateFST. In order to test whetherDestincreases significantly with distance we conducted a regression ofDestover distance inRversion 3.0.1. To this end, we calculated a mean value across all pairwise comparisons for the Panamanian sampling sites that were not genetically differentiated (one data point) and used the pairwise comparisons among Panama, Costa Rica, Eastern and Western Peru (six data points). Further, we performed a STRUCTURE analysis [43] to test whether individuals from different Panamanian sampling sites could be assigned to one or more clusters based on multi-locus genotype data. We selected the setting with correlated frequencies as it improves estimates of admixture and left all other parameters at their default values [44]. We used 250,000 MCMC repetitions after a burn-in period of 100,000. To determine the most likely number of clustersK, we testedKvalues from 1–10 and carried out 10 runs for eachK. Afterwards, we followed the procedure suggested by Evanno et al. [45] to select the optimalK. With the same settings, we analyzed all samples from Pan-ama, Costa Rica and Peru with 10 repetitive runs for eachK= 1–7.
Phylogeographic structure can be inferred from the microsatellite DNA data set if allele sizes within a populations or geographic region are more similar than in the overall sample [14]. This was tested by comparing the allele-size based differentiation statisticRSTwith its value after permuting allele sizes within loci (“permutedRST”—similar to FST) using SPAGeDI
with 10,000 permutations. A significant one-sided test establishes the alternative hypothesis of
Pollen dispersal model
In order to explore the possible role of pollen dispersal limitation in shaping fine scale genetic structure, we designed a computational model using theRprogramming language [38] that allowed us to estimate the number and distance of possible pollen donors forF.insipidatrees in the BCNM. Based on the available census data we included allF.insipidatrees on BCI that were still alive in 2007 and all trees mapped along the shoreline of the islands and peninsulas (n = 342 trees, seeS3 Fig).
In the model, each tree undergoes a reproductive cycle that starts at a randomly chosen day of the year. The cycle consists of a receptive phase of six days, a ripening phase of 28 days and a phase of six days during which fig wasps are released and search for fig trees in the receptive phase. The next reproductive cycle starts after a randomly varying period of 228 to 326 days. The model was run for two consecutive cycles for each tree and was repeated ten times. In addi-tion, we repeated the runs with a receptive and release phase of five and seven days, respec-tively. Trees were classified as potential pollen donors when their release phase overlapped with the receptive phase of another tree, independently of the geographic distance. For each tree we calculated the number of potential pollinators and the Euclidian distance between pol-len donor and receptor. Based on these results we estimated the mean number of polpol-len donors for a number of predefined distance classes. The phenological data for the model was derived from Milton et al. [38,47], Milton [48] and Morrison [24]. We used the R packages“calibrate”,
“maptools”,“plotrix”and“sp”[49,50,51,52]. More detailed information on the model is pre-sented as supplementary material (S3 FigandS2 Methods).
Results
For eachFicusspecies, we were able to score 7–10 markers with a mean allele number (per locus) of 7.0–10.9 and total allele numbers of 56–109 alleles per species (S2 Table). The number of loci differs between individuals because some of the SSRs did not amplify across all species, had a peak pattern that we could not score reliably, or an excess of null alleles. Null alleles were present in two and three markers forF.citrifoliaandF.obtusifolia, respectively (S2 Table) and markers with null allele frequencies>0.2 were omitted from the data analysis.
Each sampled individual had a unique multi-locus genotype. All of the species exhibited high levels of heterozygosity (meanHO= 0.58–0.79) and low inbreeding coefficients (meanFIS = -0.056–0.054), except forF.obtusifolia, which exhibited a relatively highFISof 0.146.Ficus
obtusifoliahad an excess of homozygosity in 4 (of 7) loci. BecauseFISis not uniformly high across all loci, we interpret deviations from HWE in the 4 loci as the result of allelic drop-out rather than inbreeding, which would affect all loci. Allele dropout is commonly encountered in microsatellite markers that were not developed for the focal species.
Spatial genetic structure
ForF.insipida, we found low but significant SGS in the BCNM (Sp= 0.003 ± 0.002, p = 0.011, Table 2) and detected comparable values at PLR (Sp= 0.0054 ± 0.0052, p<0.001). Along PLR, SGS was significant in adults (Sp= 0.0049 ± 0.0046, p = 0.020), but only marginally significant in saplings (Sp= 0.0037 ± 0.0074, p = 0.055).
For the other three fig species we found significant SGS in the BCNM as well. TheSp statis-tics revealed strongest SGS for the strangler figF.obtusifolia(Sp= 0.031 ± 0.023, p<0.001) compared toF.citrifolia(Sp= 0.013 ± 0.008, p<0.001),F.yoponensis(Sp= 0.008 ± 0.012, p = 0.032) andF.insipida. When comparingSpbased on the overlap of 2SE, onlyF.obtusifolia
yoponensis, we found no significant SGS (Sp= 0.001 ± 0.003, ns). To exclude the possible of null alleles affecting these results, we repeated the analysis by omitting markers with null alleles (S2 Table). This did not alter the results significantly.
The autocorrelation analysis largely supported the finding of significant SGS and indicated that pairwise kinship was higher than expected under conditions of random pollen and seed dispersal (reflected by the 95% CI) for distance classes up to 1 km inF.insipida(Fig 2). For both strangler figs the pairwise kinship coefficient of the first distance class (mean pairwise distance<500 m) was significant. InF.yoponensis, the autocorrelations was not significant, butFijdecreases with increasing distance as well except for the first distance class.
Pollen dispersal model
When the receptive and release phase in our model were set to six days, we found that 48 out of 342F.insipidatrees had no potential mate within a radius of 500 m (mean number of mating partners<500 m: 1.7 ± 1.0). On average, 4.0 ± 2.1 potential pollen donors could be encoun-tered within a radius of 1 km in our simulations (Fig 3). In total, each receptive tree could potentially receive pollen from 25.8 ± 2.3 trees in our simulation. Mean distance between potential mating partners was 3.0 ± 0.5 km. If the receptive and release phase lasted for five or seven days, mean number of pollen donors decreased by 13% and increased by 14%, respec-tively (S4 Fig).
Genetic differentiation of
F
.
insipida
at regional and biogeographic
spatial scales
At the regional scale, genetic differentiation among sampling sites located along the Panama Canal was low (Dest= 0.009 ± 0.006,FST= 0.006 ± 0.004) and did not increase with distance. The STRUCTURE analysis detected only one cluster in this entire area. In contrast, at the bio-geographic scale (Costa Rica to Peru) we found a strong linear correlation ofDestover linear Euclidian distance (adjusted R2= 0.962, p<0.001,Fig 4, correspondingFSTinTable 3). The most likely number of clusters of the corresponding STRUCTURE analysis wasK= 2 separat-ing the samples from Peru and Central America. However, the Evanno method has a strong bias to identifyK= 2 as the most likely number due to the low variance ofK= 1 [53]. Thus, we also assessed the second most likely number of clusters, which wasK= 5. In that case, the Table 2. Estimates of SGS based on theSpstatistics.Withb: slope of the regression with the correlation coefficientr2andF
(1)= kinship coefficient for the
first distance class (d<200–300 m).
Species Sampling location N F(1) b(Fordij<3 km) r2 Sp±2SE* P
F. insipida BCNM 190 0.006 -0.0034 0.001 0.0034±0.0017 0.0113
- only BCI 88 0.004 -0.0009 0.000 0.0009±0.0026 0.2334
- only shoreline 102 0.013 -0.0069 0.003 0.0070±0.0049 0.0029
PLR 155 0.019 -0.0053 0.002 0.0054±0.0052 <0.001
- only adults 67 0.020 -0.0048 0.002 0.0049±0.0046 0.020
- only saplings 73 0.014 -0.0037 0.001 0.0037±0.0074 0.055
F. citrifolia BCNM 62 0.032 -0.0128 0.017 0.0133±0.0083 <0.001
F. obtusifolia BCNM 59 0.097 -0.0281 0.034 0.0311±0.0228 <0.001
F. yoponensis BCI 37 0.014 -0.0082 0.005 0.0083±0.0124 0.032
*Standard errors (SE) are based on jackknifing
samples from Peru and Costa Rica clustered separately while individuals from Panama were jointly assigned to three clusters (S2 Fig).
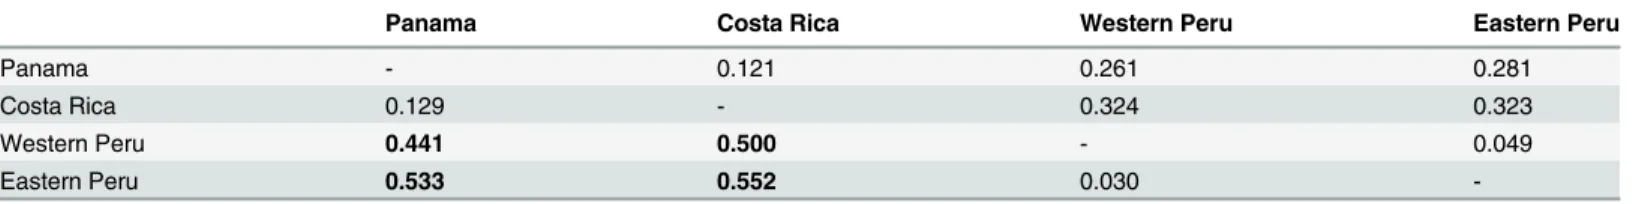
The phylogeographic analysis based on microsatellite size variation showed significant dif-ference betweenRSTand permutedRSTonly in comparisons between Central America (Costa Rica or Panama) and Peru (P<0.01) (Table 3). There was no significant contribution of allele size mutation to population differentiation within Central America or within Peru.
Discussion
We collected nuclear microsatellite data to estimate genetic structure at different spatial scales in the common free-standing figF.insipida. Significant genetic differentiation among Meso-american and Amazonian sites indicates that pollen dispersal is restricted over biogeographic scales. At the local scale we detected weak but significant SGS inF.insipidaas well as in three other sympatric fig species from both New World subgeneraPharmacosycea(free-standing figs) andUrostigmasectionAmericana(strangler figs). Our model results were consistent with previous genetic studies [7] that showed that pollen dispersal routinely exceeds the area within Fig 2. Average kinship over distance for the investigated fig species.Pairwise kinship is determined by Loiselle´s kinship coefficient (Fij) forF.citrifolia
(nind= 62, ncomp= 236),F.obtusifolia(nind= 59, ncomp= 214),F.insipida(nind= 190, ncomp= 1795) andF.yoponensis(nind= 37, ncomp= 133) Dotted lines
represent 95% confidence interval. Depending on the pairwise kinship, scales on the y axis vary among graphs. (nind= number of sampled individuals, ncomp
= number of pairwise comparisons per distance class).
which we estimated SGS. Thus, our results suggest that local scale SGS results from relatively limited seed dispersal in Neotropical figs. In the following, we explore key processes that influ-ence the formation of SGS in Neotropical figs and relate SGS at the local scale to patterns of geographic differentiation.
Figs exhibit the highest pollination distances known in insect-pollinated plants [3]. In Pan-ama, fig wasps often need to travel hundreds to thousands of meters to encounter a receptive conspecific host plant. Individual figs routinely receive pollen from multiple genetically distinct pollen sources that can be dozens of kilometers apart [7]. Asynchronous mating further reduces the frequency of nearest neighbor pollination. In accordance with this, we observed highHOand lowFISvalues in our study which indicate high levels of random mating. Our model results using data fromF.insipidaare consistent with Nason et al.´s [7] findings with stranglers: only very few pollen donors are routinely located among the nearest neighbors of a receptive fig tree: For 44% of the modeled trees 0–1 potential pollen donors were located within a radius of 500 m, while a much larger number of pollen donors was located beyond 1 km (84.5% of all potential fathers in our model), far exceeding the spatial scale of the fine scale SGS in our study. Our model likely underestimates the number of pollen donors at larger distances because it is restricted to the area of BCNM. As we do not integrate wind speed and direction, we probably overestimate the number of pollen donors at short distances. Nevertheless, our estimate demonstrates that close neighbor mating plays a minor role in pollen mediated gene flow and thus, is unlikely to generate local scale SGS. Our pollination model is likely to apply Fig 3. Simulation results of the pollen dispersal model.Results are based on simulations with a receptive and release phase of six days. Boxplots represent the number of trees that can act as potential pollen for each receptiveF.inspidatree at the given distance classes. Results are based on 10 runs.
broadly to Neotropical fig species, most of which occur at even lower densities thanF.insipida
yet have similar asynchronous flowering patterns.
While long distance pollen dispersal is a common feature in Neotropical figs, SGS patterns may vary predictably among NeotropicalFicusspecies for other reasons, including life history differences associated with fruit size, and differences in habitat requirements for seedling estab-lishment, both of which we explore in the following paragraphs. As any measure of SGS will only provide a temporally and spatially restricted snapshot, we also discuss the potential influ-ences of colonization history and fluctuations in population density on SGS of the studied fig populations.
Fig 4. Genetic differentiation amongF.insipidasampling sites located in Panama, Costa Rica and Peru.Genetic differentiation given as Jost´sDest
increases linearly with spatial distance as expected under IBD or IBB (adjusted R2= 0.962, p<0.001). As there was no population substructure among
Panamanian sampling sites, they are represented by one data point at short distance while the other data points are pairwise comparisons among Panama, Costa Rica, Western and Eastern Peru.
doi:10.1371/journal.pone.0133581.g004
Table 3. Pairwise measures of genetic differentiation betweenF.insipidapopulations. FST(above diagonal) andRST(below diagonal). IfRST>
per-mutedRST, it is indicative for the contribution of mutations to population differentiation (for p<0.05 after correction for multiple testing indicated by bold
numbers).
Panama Costa Rica Western Peru Eastern Peru
Panama - 0.121 0.261 0.281
Costa Rica 0.129 - 0.324 0.323
Western Peru 0.441 0.500 - 0.049
Eastern Peru 0.533 0.552 0.030
Regeneration ecology, colonization history and SGS
While fig species mostly occur at low densities, free-standing figs might occur—temporally and/ or locally restricted—at higher densities, especially in former disturbed areas and light gaps [26]. The intensity of SGS can depend on the degree to which large light gaps are colonized by seeds from multiple sources [54]. The relatively low SGS observed inF.insipidain our study, coupled to the fact that SGS is not significant even in saplings, suggests that light gaps are being seeded by multiple maternal sources. As free-standing figs are most dominant in early successional stages of forests, colonization history has to be considered as well. The northwestern part of BCI experienced a long history of agricultural use and the forest only began to regenerate about 150 years ago. Almost allF.insipidaandF.yoponensistrees on BCI are restricted to this secondary forest [26]. Most free-standingFicustrees established in early successional stages and appear to be the same age on BCI. As the forest matured, further recruitment was impeded by low light conditions under the canopy cover and, currently, saplingFicustrees are extremely rare in BCI ´s closed canopy forest [26,55]. Regular census data since 1973 has shown a drastic decline of both studied free-standing fig species on the island in recent years (Albrecht et al. unpublished data, [24]) indicating that the trees have reached the end of their natural life spans. Thus the absence of SGS inF.insipidaon BCI (S5 Fig) could be attributed to the fact that trees established almost simultaneously from multiple seed sources that were likely growing at the edge of the agricultural fields. Initial patterns of SGS would then be weakened by demographic thinning [56]. In contrast, seeds of strangler figs mostly establish in the canopies of other host trees, and they should encounter evenly scattered germination sites within intact forest. A relatively ran-dom distribution of fig trees at low density, such as is observed in the stranglers, should increase SGS because seed shadow overlap is expected to be relatively low [14]. We expect that future studies will find similar differences in the intensity of SGS between strangler and free-standing figs due to their fundamentally different requirements for seedling establishment.
Influence of frugivore size and dispersal on SGS
Our results of low but significant SGS are also consistent with those of Nazareno et al. [12] who studied SGS in populations ofF.citrifoliaandF.eximia. It is also interesting to note that despite the extraordinary pollen dispersal distances documented in figs, other tropical species that are pollinated by insects and dispersed by animals show similar levels of SGS based on the
Spstatistics as the figs from our study (compare [2,67]). We suggest that the observed SGS val-ues in our study are primarily shaped by differences in tree density, and the interplay between regeneration strategies, colonization history, and average seed dispersal distances. However, while SGS measured with theSpstatistics is generally considered robust across different sam-pling schemes [14], we recognize that SGS can also be influenced by population dynamics and idiosyncratic population histories [68] that may obscure more deterministic differences in SGS caused by life history.
Regional and phylogeographic genetic structure of
F
.
insipida
At the regional scale within the Panama Canal watershed we detected no population substruc-ture forF.insipidadespite the spatial limitations of seed dispersal that likely generated SGS at the local scale. This is consistent with prior estimates of breeding area based on pollen dispersal studies for strangler figs [7]. At the biogeographic scale, we found that populations were geneti-cally distinct and genetic differentiation increased with distance as predicted under conditions of isolation by distance (IBD) and/or isolation by geographic barriers (IBB) [69] (Table3). The geographic barriers separating our population samples from Costa Rica to Peru include the northern Andes, the dry Llanos region of northern South America, and various xeric and mon-tane barriers between the Panamanian and Costa Rican sites. While the summary statisticsFST,
RSTandDestonly permit apost hocinterpretation, the phylogeographic structure ofF.insipida detected between our Central and South American samples is consistent with the previously published cpDNA phylogeography [18] of the same species. Because the phylogeographic structure was stronger in the maternally transmitted cpDNA than in ITS, Honorio Coronado and colleagues [18] suggested that the geographic barriers associated with the northern Andes posed a greater barrier for seed than pollen dispersal. This pattern may have other explana-tions. The haploid, uniparentally transmitted chloroplast genome has a lowerNe(1/4 the Neof
nuclear markers) and genetic drift therefore plays a much stronger role in cpDNA markers. Chloroplast capture from congeneric species is also possible, and has been demonstrated in
Ficusand other tree taxa [70,71]. The absence of ITS variation between Panama and Amazo-nianFicus[18] is among the lowest levels of divergence found in lowland trees sampled on either side of the Andes [72,73,74,75] and is most similar to species that have relatively recently dispersed around the Andes [76]. This suggests fig seed dispersal and/or colonization ability (especially in drier habitats) has allowedF.insipida, and perhaps other fig species, to overcome the geographic barriers that have caused vicariance in many other tree species.
Conclusions
test the emerging pattern of greater gene flow in monoecious than in dioecious species (this study and [11,12,77]). Importantly, species-specific traits (e.g. requirements for seedling recruitment) as well as the behavior of both pollen and seed dispersal agents have to be consid-ered when predicting the spatial extent of gene flow in figs and other tree taxa.
Supporting Information
S1 Dataset. SSR raw data for all individuals. (XLSX)
S1 Fig.Ficussampling in the Barro Colorado Nature Monument, Panama (top rows) and along Pipeline Road (bottom row) for the assessment of SGS.Shown are all sampled individ-uals ofF.insipida,F.yoponensis,F.citrifoliaandF.obtusifolia.
(PNG)
S2 Fig. Assignment of samples from Panama (n = 429), Costa Rica (n = 27) and Peru (n = 27) to cluster with the Structure software.The most likely number of cluster wasK= 5 where samples from Peru and Costa Rica were assigned to separate clusters while samples from Panama were jointly assigned to three clusters. The graph was based on the run that had the highest Ln P(D) value withK = 5.
(PNG)
S3 Fig. Map of the BCNM with allF.insipidatrees mapped on BCI and the surrounding islands and peninsulas that were integrated in the pollen flow model (n = 342, all dots). Here, tree 54 (blue dot) is in its receptive phase and all trees highlighted in red release fig wasps at a given day. Blue circles around tree 54 indicate the distance classes (<500 m, 501–1.000 m, 1.001–4000 m).
(PNG)
S4 Fig. Number of trees that can act as potential pollen donors in the pollen dispersal model forF.inspida.Boxplots are based on 10 runs where the release and receptive phase last for five (A) and seven (B) days each.
(TIF)
S5 Fig. Average kinship over distance for theF.insipidaalong the shoreline of BCNM (nind= 102, ncomp= 515) and on BCI (nind= 88, ncomp= 478).Pairwise kinship is determined by Loiselle´s kinship coefficient (Fij). Dotted lines represent 95% confidence interval. Depend-ing on the spatial scale the x axes vary between graphs. (nind= number of sampled individuals,
ncomp= number of pairwise comparisons per distance class).
(TIF)
S6 Fig. Regression ofFijover ln(dij) for the four sampled species.Regression in based on all
pairwise comparisons within a radius of 3 km. Regression was performed in R using a linear model. Within each graph, r2, the regression slope b and p are indicated (number of pairwise comparisons for each species: Fcit = 962, Fins = 7764, Fobt = 761 and Fyop = 664).
(TIFF)
S1 Methods. Methods for chloroplast SSRs.With Table A: Allele length for the tested cpSSRs from Weising & Gardner (1999).
(DOCX)
S1 Table. Sampling sites ofF.inspidain Panama, Costa Rica and Peru with the number of samples per plot (n) and the spatial coordinates of thelocality.
(DOCX)
S2 Table. Characterization of the microsatellite markers forFicussamples collected in the Barro Colorado Nature Monument.For each marker, we provide the percentage of missing data, the number of alleles (Na), the expected heterozygosity (He) and the inbreeding
coeffi-cient (FIS).
(DOCX)
Acknowledgments
We thank J. Choo, A. Thompson, Na Wei and S. Abraham for support in the laboratory and A. Gomez and L.T. Montenegro for help in the field. We are grateful to O. Hardy for support when using SPAGeDi and to M. Heuertz and S.C. Gonzalez-Martinez for help with the data analysis. We thank M. Tschapka and M. Ayasse, and the anonymous reviewers that greatly helped to improve the manuscript.
Author Contributions
Conceived and designed the experiments: KH CWD EKVK. Performed the experiments: KH LA FCS RGV. Analyzed the data: KH FCS. Contributed reagents/materials/analysis tools: KH LA FCS RGV CWD. Wrote the paper: KH CWD EAH.
References
1. Bawa KS (1990) Plant-pollinator interactions in tropical rainforests. Annu Rev Ecol Syst 21: 399–422.
2. Dick CW, Hardy OJ, Jones FA, Petit RJ (2008) Spatial scales of pollen and seed-mediated gene flow in tropical rain forest trees. Tro Plant Biol 1: 20–33.
3. Ahmed S, Compton SG, Butlin RK, Gilmartin PM (2009) Wind-borne insects mediate directional pollen transfer between desert fig trees 160 kilometers apart. Proc Natl Acad Sci USA 106: 20342–20347. doi:10.1073/pnas.0902213106PMID:19910534
4. Herre EA, Jander KC, Machado CA (2008) Evolutionary ecology of figs and their associates: Recent progress and outstanding puzzles. Annu Rev Ecol Evol Syst 39: 439–458.
5. Machado CA, Robbins N, Gilbert MTP, Herre EA (2005) Critical review of host specificity and its coevo-lutionary implications in the fig/fig-wasp mutualism. Proc Natl Acad Sci USA 102: 6558–6565. PMID: 15851680
6. Jackson AP, Machado CA, Robbins N, Herre EA (2008) Multi-locus phylogenetic analysis of neotropi-cal figs does not support co-speciation with the pollinators: The importance of systematic sneotropi-cale in fig/ wasp cophylogenetic studies. Symbiosis 45: 57–72.
7. Nason JD, Herre EA, Hamrick JL (1998) The breeding structure of a tropical keystone plant resource. Nature 391: 685–687.
8. Janzen DH (1979) How to be a fig. Annu Rev Ecol Syst 10: 13–52.
9. Valdeyron G, Kjellberg F, Ibrahim M, Raymond M, Valizadeh M (1985) A one species—one population plant: how does the common fig escape genetic diversification? In: Jacquard P, Heim G, Antonovics J, editors. Genetic differentiation and dispersal in plants. Berlin: Springer Verlag. pp. 383–393.
10. Harrison RD, Rasplus JY (2006) Dispersal of fig pollinators in Asian tropical rain forests. J Trop Ecol 22: 631–639.
11. Dev SA, Kjellberg F, Hossaert-McKey M, Borges RM (2010) Fine-scale population genetic structure of two dioecious Indian keystone species,Ficus hispidaandFicus exasperata(Moraceae). Biotropica 43: 309–316.
12. Nazareno AG, Alzate-Marin AL, Pereira RAS (2013) Dioecy, more than monoecy, affects plant spatial genetic structure: the case study ofFicus. Eco Evol 3: 3495–3508.
14. Vekemans X, Hardy OJ (2004) New insights from fine-scale spatial genetic structure analyses in plant populations. Mol Ecol 13: 921–935. PMID:15012766
15. Banack SA, Horn MH, Gawlicka A (2002) Disperser- vs. establishment-limited distribution of a riparian fig tree (Ficus insipida) in a Costa Rican tropical rain forest. Biotropica 34: 232–243.
16. Yu H, Nason JD, Ge X, Zeng J (2010) Slatkin's Paradox: When direct observation and realized gene flow disagree. A case study inFicus. Mol Ecol 19: 4441–4453. doi:10.1111/j.1365-294X.2010.04777.x PMID:20840599
17. Chen Y, Jiang Z-X, Compton SG, Liu M, Chen X-Y (2011) Genetic diversity and differentiation of the extremely dwarfFicus tikouain Southwestern China. Biochem Syst Ecol 39: 441–448.
18. Honorio Coronado EN, Dexter KG, Poelchau MF, Hollingsworth PM, Phillips OL, Pennington RT (2014)
Ficus insipidasubsp.insipida(Moraceae) reveals the role of ecology in the phylogeography of wide-spread Neotropical rain forest tree species. J Biogeogr 41: 1697–1709. PMID:25821341
19. Berg CC (1989) Classification and distribution ofFicus. Experientia 45: 605–611.
20. Shanahan M, So S, Compton SG, Corlett R (2001) Fig-eating by vertebrate frugivores: a global review. Biol Rev 76: 529–572. PMID:11762492
21. Harrison RD (2005) Figs and the diversity of tropical rainforests. Bioscience 55: 1053–1064.
22. Cruaud A, Rønsted N, Chantarasuwan B, Chou LS, Clement WL, Couloux A, et al. (2012) An extreme case of plant-insect co-diversification: figs and fig-pollinating wasps. Syst Biol 61: 1029–1047. doi:10. 1093/sysbio/sys068PMID:22848088
23. Korine C, Kalko EKV, Herre EA (2000) Fruit characteristics and factors affecting fruit removal in a Pana-manian community of strangler figs. Oecologia 123: 560–568.
24. Morrison DW (1978) Foraging ecology and energetics of the frugivorous batArtibeus jamaicensis. Ecol-ogy 59: 716–723.
25. Windsor DM, Morrison DW, Estribi MA, de Leon B (1989) Phenology of fruit and leaf production by 'strangler' figs on Barro Colorado Island, Panamá. Experientia 45: 647–653.
26. Foster RB, Brokaw NVL (1982) Structure and history of the vegetation of Barro Colorado Island. In: Leigh EG Jr, Rand AS, Windsor DM, editors. The ecology of a tropical forest: Seasonal rhythms and long-term changes. Washington, D.C.: Smithsonian Institution Press. pp. 67–94.
27. Cavers S, Degen B, Caron H, Lemes MR, Margis R, Salgueiro F, et al. (2005) Optimal sampling strat-egy for estimation of spatial genetic structure in tree populations. Heredity 95: 281–289. PMID: 16030529
28. Doyle J, Doyle JL (1987) Genomic plant DNA preparation from fresh tissue—CTAB method. Phyto-chem Bull 19: 11–15.
29. Heer K, Machado CA, Himler AG, Herre EA, Kalko EKV, Dick CW (2012) Anonymous and EST-based Microsatellite DNA markers that transfer broadly across the fig tree genus (FicusL. Moraceae). Am J Bot 99: e330–e333 doi:10.3732/ajb.1200032PMID:22847539
30. Crozier YC, Jia XC, Yao JY, Field AR, Cook JM, Crozier RH (2007) Microsatellite primers forFicus racemosaandFicus rubiginosa. Mol Ecol Notes 7: 57–59.
31. Vignes H, Hossaert-Mckey M, Beaune D, Fevre D, Anstett MC, Borges RM, et al. (2006) Development and characterization of microsatellite markers for a monoeciousFicusspecies,Ficus insipida, and cross-species amplification among different sections ofFicus. Mol Ecol Notes 6: 792–795.
32. Schuelke M (2000) An economic method for the fluorescent labeling of PCR fragments. Nat Biotechnol 18: 233–234. PMID:10657137
33. Weir BS, Cockerham CC (1984) Estimating F-statistics for the analysis of population structure. Evolu-tion 38: 1358–1370.
34. Rousset F (2008) genepop’007: a complete re-implementation of the genepop software for Windows and Linux. Mol Ecol Res 8: 103–106.
35. Van Oosterhout C, Hutchinson WF, Wills DPM, Shipley P (2004) micro-checker: software for identifying and correcting genotyping errors in microsatellite data. Mol Ecol Notes 4: 535–538.
36. Loiselle BA, Sork VL, Nason J, Graham C (1995) Spatial genetic structure of a tropical understory shrub,Psychotria officinalis(Rubiaceae). Am J Bot 82: 1420–1425.
37. Hardy OJ, Vekemans X (2002) SPAGeDI: a versatile computer program to analyse spatial genetic structure at the individual or population levels. Mol Ecol Notes 2002: 618–620.
38. R Core Team (2014) R: A language and environment for statistical computing. R Foundation for Statisti-cal Computing, Vienna, Austria.URLhttp://www.R-project.org/.
40. Wright S (1943) Isolation by distance. Genetics 28: 114–137. PMID:17247074
41. Holsinger KE, Weir BS (2009) Genetics in geographically structured populations: Defining, estimating and interpreting FST. Nat Rev Genet 10: 639–650. doi:10.1038/nrg2611PMID:19687804
42. Peakall R, Smouse P (2012) GenAlEx 6.5: Genetic analysis in Excel. Population genetic software for teaching and research—an update. Bioinformatics 28: 2537–2539. PMID:22820204
43. Pritchard JK, Stephens M, Donnelly P (2000) Inference of population structure using multilocus geno-type data. Genetics 155: 945–959. PMID:10835412
44. Falush D, Stephens M, Pritchard JK (2007) Inference of population structure using multilocus genotype data: Dominant markers and null alleles. Mol Ecol Notes 7: 574–578. PMID:18784791
45. Evanno G, Regnaut S, Goudet J (2005) Detecting the number of clusters of individuals using the soft-ware STRUCTURE: A simulation study. Mol Ecol 14: 2611–2620. PMID:15969739
46. Rice WR (1989) Analyzing tables of statistical tests. Evolution: 223–225.
47. Milton K, Windsor DM, Morrison DW, Estribi MA (1982) Fruiting phenologies of two neotropicalFicus
species. Ecology 63: 752–762.
48. Milton K (1991) Leaf change and fruit production in six neotropical Moraceae species. J Ecol 79: 1–26.
49. Pebesma EJ, Bivand RS (2005) Classes and methods for spatial data in R. R News 5: 9–13.
50. Lemon J (2006) Plotrix: a package in the red light district of R. R news 6: 8–12.
51. Lewin-Koh NJ, Bivand R, Pebesma E, Archer E, Baddeley A, Bibiko H, et al. (2011) maptools: Tools for reading and handling spatial objects. R package version 0.8–10 URLhttp://CRAN.R-project.org/ package = maptools.
52. Graffelman J (2009) A guide to scatterplot and biplot calibration.
53. Campana MG, Hunt HV, Jones H, White J (2011) CorrSieve: software for summarizing and evaluating Structure output. Mol Ecol Res 11: 349–352.
54. Born Cl, Kjellberg F, Chevallier M-Hln, Vignes Hln, Dikangadissi J-T, Sanguié J, et al. (2008) Coloniza-tion processes and the maintenance of genetic diversity: insights from a pioneer rainforest tree, Aucou-mea klaineana. Proc Roy Soc B 275: 2171–2179.
55. Terborgh J, Flores N C, Mueller P, Davenport L (1997) Estimating the ages of successional stands of tropical trees from growth increments. J Trop Ecol 13: 833–856.
56. Pardini EA, Hamrick JL (2008) Inferring recruitment history from spatial genetic structure within popula-tions of the colonizing treeAlbizia julibrissin(Fabaceae). Mol Ecol 17: 2865–2879. doi: 10.1111/j.1365-294X.2008.03807.xPMID:18510586
57. Serio-Silva JC, Rico-Gray V (2002) Interacting effects of forest fragmentation and howler monkey forag-ing on germination and disperal of fig seeds. Oryx 36: 266–271.
58. Vanderhoff EN, Grafton B (2009) Behavior of tamarins, tanagers and manakins foraging in a strangler fig (Ficussp.) in Suriname, South America: implications for seed dispersal. Biota Neotropica 9: 419–423.
59. Heer K, Albrecht L, Kalko EKV (2010) Effects of ingestion by neotropical bats on germination parame-ters of native free-standing and strangler figs (Ficus sp., Moraceae) Oecologia 163: 425–436. doi:10. 1007/s00442-010-1600-xPMID:20354732
60. Morrison DW (1978) Influence of habitat on the foraging distances of the fruit bat,Artibeus jamaicensis. J Mammal 59: 622–624.
61. Thornton IWB, Compton SG, Wilson CN (1996) The role of animals in the colonization of the Krakatau Islands by fig trees (Ficusspecies). J Biogeogr 23: 577–592.
62. Morrison DW (1980) Foraging and day-roosting dynamics of canopy fruit bats in Panama. J Mammal 61: 22–29.
63. Laska M (1990) Food transit times and carbohydrate use in three phyllostomid bat species. Z Saeuge-tierkd 55: 49–54.
64. Giannini NP, Kalko EKV (2004) Trophic structure in a large assemblage of phyllostomid bats in Pan-ama. Oikos 105: 209–220.
65. Kalko EKV, Herre EA, Handley CO Jr. (1996) Relation of fig fruit characteristics to fruit-eating bats in the New and Old World tropics. J Biogeogr 23: 565–576.
66. Wendeln MC, Runkle JR, Kalko EKV (2000) Nutritional values of 14 fig species and bat feeding prefer-ences in Panama. Biotropica 32: 489–501.
68. Jump AS, Rico L, Coll M, Penuelas J (2012) Wide variation in spatial genetic structure between natural populations of the European beech (Fagus sylvatica) and its implications for SGS comparability. Hered-ity 108: 633–639. doi:10.1038/hdy.2012.1PMID:22354112
69. Guillot G, Leblois R, Coulon A, Frantz AC (2009) Statistical methods in spatial genetics. Mol Ecol 18: 4734–4756. doi:10.1111/j.1365-294X.2009.04410.xPMID:19878454
70. Renoult JP, Kjellberg F, Grout C, Santoni S, Khadari Bb (2009) Cyto-nuclear discordance in the phylog-eny of Ficus section Galoglychia and host shifts in plant-pollinator associations. BMC Evol Biol 9: 248. doi:10.1186/1471-2148-9-248PMID:19822002
71. Saeki I, Dick CW, Barnes BV, Murakami N (2011) Comparative phylogeography of red maple (Acer rubrumL.) and silver maple (Acer saccharinumL.): impacts of habitat specialization, hybridization and glacial history. J Biogeogr 38: 992–1005.
72. Scotti-Saintagne C, Dick CW, Caron H, Vendramin GG, Troispoux V, Sire P, et al. (2013) Amazon diversification and cross-Andean dispersal of the widespread Neotropical tree speciesJacaranda copaia(Bignoniaceae). J Biogeogr 40: 707–719.
73. Rymer PD, Dick CW, Vendramin GG, Buonamici A, Boshier D (2013) Recent phylogeographic struc-ture in a widespread ´weedy´Neotropical tree species,Cordia alliodora(Boraginaceae). J Biogeogr 40: 693–706.
74. Cavers S, Dick CW (2013) Phylogeography of Neotropical trees. J Biogeogr 40: 615–617.
75. Dick CW, Heuertz M (2008) The complex biogeographic history of a widespread tropical tree species. Evolution 62: 2760–2774. doi:10.1111/j.1558-5646.2008.00506.xPMID:18764917
76. Dick CW, Lewis SL, Maslin M, Bermingham E (2013) Neogene origins and implied warmth tolerance of Amazon tree species. Ecology and Evolution 3: 162–169.
77. Wang R, Ai B, Gao BQ, Yu S, Li YY, Chen XY (2009) Spatial genetic structure and restricted gene flow in a functionally dioecious fig,Ficus pumilaL. var.pumila(Moraceae). Popul Ecol 51: 307–315.


![Figs exhibit the highest pollination distances known in insect-pollinated plants [3]. In Pan- Pan-ama, fig wasps often need to travel hundreds to thousands of meters to encounter a receptive conspecific host plant](https://thumb-eu.123doks.com/thumbv2/123dok_br/18322792.349959/10.918.66.753.116.598/pollination-distances-pollinated-hundreds-thousands-encounter-receptive-conspecific.webp)