How Human Schematization and Systematic Errors Take Effect on
Sketch Map Formalizations
Master Thesis
by
Jia, Wang
Institute for Geoinformatics
University of Münster
Advisory Committee:
Angela Schwering, Research Assistant of Geoinformatics, University of Münster
Advisor
Werner Kuhn, Professor of Geoinformatics, University of Münster
Marco Painho, Professor of Geographic Information Science, Universidade Nova de Lisboa
Abstract
Sketch map is an important way to represent spatial information used in many geospatial reasoning tasks (Forbus, K., Usher, J., & Chapman, V. 2004). Compared with verbal or textual language, sketch map is a more interactive mode that more directly supports human spatial thinking and thus is a more natural way to reflect how people perceive properties of spatial objects and their spatial relations. One challenging application of sketch maps is called Spatial-Query-by-Sketch proposed by Egenhofer. Being a design of query language for geographic information systems (GISs), it allows a user to formulate a spatial query by drawing the desired spatial configuration with a pen on a touch-sensitive computer screen and get it translated into a symbolic representation to be processed against a geographic database (Egenhofer, M. 1997).
During the period of sketch map drawing, errors due to human spatial cognition in mind may occur. A ready example is as follows: distance judgments for route are judged longer when the route has many turns or landmarks or intersections (Tversky, B. 2002). Direction get straightened up in memory. When Parisians were asked to sketch maps of their city, the Seine was drawn as a curve, but straighter than it actually is (Milgram, S. and Jodelet, D. 1976). Similarly, buildings and streets with different shapes are often simply depicted as schematic figures like blobs and lines. These errors are neither random nor due solely to ignorance; rather they appear to be a consequence of ordinary perceptual and cognitive processes (Tversky, 2003). Therefore, when processing sketch map analysis and representing it in a formal way, like Egenhofer's analysis approach for Spatial-Query-by-Sketch, the resulting formalization must necessarily be wrong if it does not account for the fact that some spatial information is distorted or omitted by humans. Therefore, when sketch map analysis is processed and represented in a formal way same as Egenhofer’s analytical approach to Spatial-Query-by-Sketch, the resulting formalization is simply erroneous since it never takes into account the fact that some spatial information is distorted or neglected in human perceptions. Though Spatial-Query-by-Sketch overcomes the limitations of conventional spatial query language by taking into consideration those alternative interaction methods between users and data, it is still not always true that accuracy of its query results is reliable.
Acknowledgments
Technically, this thesis documents the study and research work I have completed in the Master Program in Geospatial Technologies1. On a personal note, as a foreign student new to Europe, the one year and a half study is an adventure of learning, friendship, maturation, and appreciation. All the people that have been part of this adventure deserve my gratitude.
Sincere thanks go to my supervisor Dr. Angela Schwering who guided me to the field of spatial cognition, encouraged me all the time, and helped to sharpen my research muscles and stay focussed on the present topic. I always obtained much valuable knowledge after discussions with her. Her advice, guidance, positive outlook and warm encouragement are invaluable.
My heartfelt thanks will also give to my other committee members, Prof. Dr. Werner Kuhn, Prof. Dr. Marco Painho and Dr. Pedro Cabral. Many thanks also to the staff from Universitat Jaume I and Insititue for Geoinformatics (IFGI). In addition, special thanks to all the experiment participants who are Jens Ortmann, Tanmoy Das, Rania Sabrah, Ledjo Seferkolli, Chunyuan Cai, Zhelu Ye, Song Li, Daniel Manso, Yikealo Hayelom, Massimiliano Livi, Denise Schlutow and Massimiliano Cecconi.
Thanks also go to my classmates and friends whom I met in Spain and Germany. It was the first time that I was so far away from home. Without your encouragements, support and friendship, I cannot imagine how helpless and bleak the life would be.
I will never forget to say thank you to the key Laboratory of Virtual Geographic Environment (VGE) so named by China Education commission and its director and my supervisor Prof. Dr. Guonian Lu. Thanks for his support and all the knowledge I earned during my 6-year study of GIS before 2007.
Table of Contents
LIST OF FIGURES...III LIST OF TABLES...V
1. INTRODUCTION...1
1.1.Scope and Problem Statement...1
1.2.Exploration and Modification...3
1.3.Intended Audience...4
1.4.Organization of Reminder of Thesis...4
2. RELATED WORK...5
2.1.Related Study from Psychology...5
2.2.Related Study from Egenhofer...6
2.3.Summary...8
3. EXPERIMENT AND ASSUMPTIONS...9
3.1.Experiment Preparation...9
3.2.Approach of Sketch Map Analysis...13
3.2.1.Curvature, Angle and Shape...14
3.2.2.Sketch Map Analysis from Egenhofer...15
3.3.Experiment Outcomes...18
3.3.1.General Overview...18
3.3.2.Curvature, Angle and Shape: Sketch Maps of Location I...21
3.3.3.Sketch Map Analysis from Egenhofer : Sketch Maps of Location I...22
3.3.4.Curvature, Angle and Shape: Sketch Maps of Location II...24
3.3.5.Sketch Map Analysis from Egenhofer : Sketch Maps of Location II...25
3.4.Discussion of Outcomes...28
4. MODIFICATION AND FORMALIZATION...33
4.1.Map Toolkits...33
4.2.Modifications of Cardinal Directions...36
4.2.1.Workflow of Modified Approach ...41
4.2.2.Formalization of Modified Approach...43
4.3.Summary...44
5. CONCLUSION AND FUTURE WORK...46
5.1.Summary...46
5.2.Major Result...46
5.3.Future Work...47
5.3.2.Assessment of Map Toolkits Design and Improvement...48
5.3.3.Detailed Analysis and Extensions of Modification and Formalization...48
REFERENCES...49
APPENDIX...51
List of Figures
Figure 1: Valid objects in a sketch map for analysis...2
Figure 2: The main work flow of this thesis...3
Figure 3: Eight distinct topological relations between two simple regions...6
Figure 4: Projection-based cardinal directions for extended spatial objects...7
Figure 5: Real maps of both locations: (a) overview of the scene from castle to IFGI1.0 and (b) overview of the scene from Mensa Aasee to IFGI 1.0...11
Figure 6: A sample map from PLUS to sport ground near lake Aa...12
Figure 7: Workflow of sketch analysis method...13
Figure 8: One example of cleaned map in ArcMap. (a) is the original sketch map and (b) is the corresponding cleaned map...14
Figure 9: Route information of curvature and angle in location I from castle to IFGI 1.0...15
Figure 10: Route information of curvature and angle in location I from Mensa Aasee to IFGI 1.0...15
Figure 11: A real map (a) of location I and the scene networks of (b) topological relations, (c) cardinal directions, and (d) detailed cardinal directions (only the relations for object A are shown)...16
Figure 12: A real map (a) of location II and the scene networks of (b) topological relations, (c) cardinal directions, and (d) detailed cardinal directions (only the relations for object A are shown)...17
Figure 13: Statistics of street information that participants depicted from castle to IFGI 1.0. (The numbers represent numbers of people who drew the street segments in their sketch maps)...21
Figure 14: An example illustrating differences of curvature, angle and shape between real map and sketch map.(a) is from real map and (b) is from sketch map...21
Figure 15: A sketch map (a) of location I and the scene networks of (b) topological relations, (c) cardinal directions, and (d) detailed cardinal directions (only the relations for object A are shown)...22
Figure 16: Statistics of street information that participants depicted from cafeteria to IFGI 1.0. (The numbers represent numbers of people who drew the street segments in their sketch maps.)...25
Figure 17: A sketch map (a) of location II and the scene networks of (b) topological relations and (c) cardinal directions (only the relations for object A are shown)...26
Figure 18: Modified sketch map with curved path and all other pictorial elements remain the same (The right map is the original one with straightened street “Hüffer-Str”)...29
Figure 19: The left one is with angle modified only and right one is with additional modifications (1,2,3,4 represent related edges which need to be modified )...30
Figure 21: One example of map toolkits...34
Figure 22: Two sets of half-planes and directions defined by half-planes...36
Figure 23: Possible positional relations as “above”, “at the same location” and “below” with respect to reference object B...37
Figure 24: Possible positional relations as “right”, “at the same location” and “left” with respect to reference object B...37
Figure 25: Build up a datum for qualitative metric measurement...38
Figure 26: Distances among object A, B, C are not the same as they are in the reality but people always sketch correct object orders...39
Figure 27: 1, 2a and 2b are street segments which will be reference objects for relative positional relationship calculation in (a) real map and (b) sketch map respectively...39
List of Tables
Table 1: Basic information of two locations with similar spatial scales...10
Table 2: Object participants drew from preliminary experiment...13
Table 3: Cardinal directions among all the objects of location I from the real map...17
Table 4: Cardinal directions among all the objects of location II from the real map...18
Table 5: Object classes from castle to IFGI 1.0...19
Table 6: Object classes from Mensa Aasee to IFGI 1.0...20
Table 7: Cardinal directions of location I from participant A. ...23
Table 8: Cardinal directions of location I from participant B...23
Table 9: Cardinal directions of location I from participant C...23
Table 10: Cardinal directions of location I from participant D...23
Table 11: Cardinal directions of location I from participant E...24
Table 12: Cardinal directions of location I from participant F...24
Table 13: Cardinal directions of location I from participant G...24
Table 14: Relative object positioning from a sketch map...26
Table 15: Relative object positioning from a sketch map of participant B...27
Table 16: Relative object positioning from a sketch map participant C...27
Table 17: Relative object positioning from a sketch map participant D...27
Table 18: Relative object positioning from a sketch map participant E...27
Table 19: Relative object positioning from a sketch map participant F...28
Table 20: Relative object positioning from a sketch map participant G...28
Table 21: Cardinal directions of modified sketch map of curvature...30
Table 22: Cardinal directions of modified sketch map of angle...31
Table 23: Cardinal directions of modified sketch map of shape...32
Table 24: Relative positional relations from real map with reference object 1...40
Table 25: Relative positional relations from sketch map with reference object 1...40
Table 26: Relative positional relations from sketch map with reference object 2a...40
Table 27: Relative positional relations from sketch map with reference object 2b...41
Chapter 1
Introduction
In order to extract useful information of objects properties and their spatial relationships from sketch maps, it is necessary to do the sketch analysis on the basis of internal sketch representations. Experiments in psychology and cartography show that topology is among the most critical information people refer to when they assess spatial relationships in geographic space, while metrical changes are frequently considered to be of less importance (Egenhofer, 1997). The sketch analysis approach by Egenhofer discussed in this thesis is based on such premises as topology matters, and metric refines (Egenhofer, M., Mark, D. 1995), so as to sustain the present study in this thesis. With participants being asked to draw specific spatial scenes, we investigate the existing computational model for sketch analysis from Egenhofer as well as the laws and theories in spatial cognition from psychology. The anticipated results of this study are: (1) an evaluation of the extent to which Egenhofer's approach can be applied to formalize sketch maps drawn by humans and; (2 ) the modification of Egenhofer's approach to account for schematization and systematic errors humans typically do while drawing sketch maps with their inner eyes.
1.1.Scope and Problem Statement
The challenge of sketch map analysis lies in the design of a computational model to describe the whole spatial scene on different levels of details and of successfully mapping them onto the reality, which means the information we get from this model is meaningful and applicable . A successful mapping requires a model to be flexible to maximize the applicable cases and, at the same time, minimize the influences of inevitable errors from human perceptions during their drawing. This thesis will evaluate and modify the model from Egenhofer of sketch map analysis. The writer will explore those influential factors from human schematization and systematic errors, and propose a modified formalization method of cardinal directions. Only static sketches are of concern in this research. Static sketches are line drawings on paper that reveal no information about the drawing sequence of lines. In this paper, only patch and region will be discussed and processed as valid elements. They are defined as follows:
● A patch is an element in a partition of space. The interiors of any two patches are disjointed.
● A region is a perceived object in a sketch. A region can be a single patch or the union of two or more connected patches.
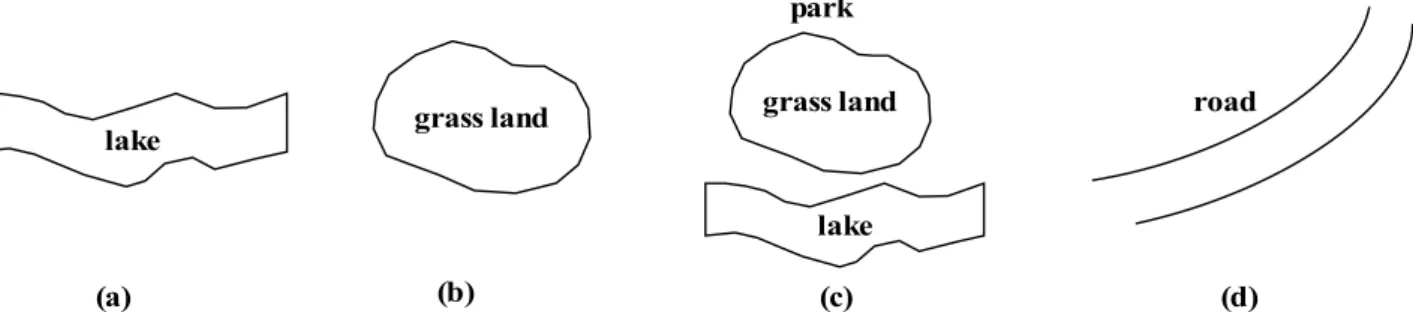
The study objects in this thesis are regions which represent features in the spatial scene. Spatial objects are always sketched according to their outlines or just simplified to schematic figures as blobs or lines. One patch would be a whole building or only part of the building, and patches are grouped into regions when they are perceived as the representation of one whole object. The groups can be either geographical or functional or conceptual depending on sketches and analysis requirement (Figure 1.1).
Figure 1.1: Valid objects in a sketch map for analysis. (a) and (b) are single patches representing geographic objects respectively. (c) is the grouping of patches (a) and (b) representing the region of a park. (d) are lines representing a road which are consider as valid.
A digital map provides an accurate snapshot of the real world and is easy to be interpreted. The same is not true in interpreting sketch maps which neglect details as objects, spatial and non-spatial properties and the most interesting part, spatial relations. Inevitable inaccuracies occur in human drawing and most of the errors are derived from human perceptions of the real world. They are cognitively natural and have a negative effect on sketch map representation. Traditional approaches without taking these errors into account will not bring forth satisfied feedbacks and thus interfere with such further sketch study as geospatial reasoning tasks.
1.2.Exploration and Modification
This thesis aims to explore how inaccuracy and errors people make when they draw sketch maps from their memories influence the accuracy of Egenhofer's approach to sketch map analysis, and then modify the existing approach and propose a new sketch map formalization. Sketch map analysis includes object properties and spatial relations among objects. The modification and formalization are mainly focused on spatial relations,which, in this thesis, are positional relations among spatial objects.
Approach. This thesis deals mainly with analysis of features of a paper sketch. In order to execute this task in a digital environment, sketches need to be digitized first as well as the maps of reality2 for comparisons. This process includes two steps: (1)scanning, and (2)cleaning. Scanning can be accomplished with a common scanner that fits the desired paper sketch. Typically, sketches are drawn with the same pen or pencil
for the entire sketching and, therefore, no distinction between colors is necessary (
Wuersch, M. 2003
). Unlike feature extraction from sketches which need to vectorizing and detect all the lines in the sketch, raster representation of sketch map as a binary image is kept unchanged in this thesis. It is assumed that the sketch only contains regions. The following step is to clean drawing errors as overshoots, undershoots and slivers. Due to the simplicity of sketches and research focus in this thesis, the detection of drawing errors and2 Maps that are digitalized from satellite images.
lake grass land
lake grass land
park
road
their corrections are manually operated.
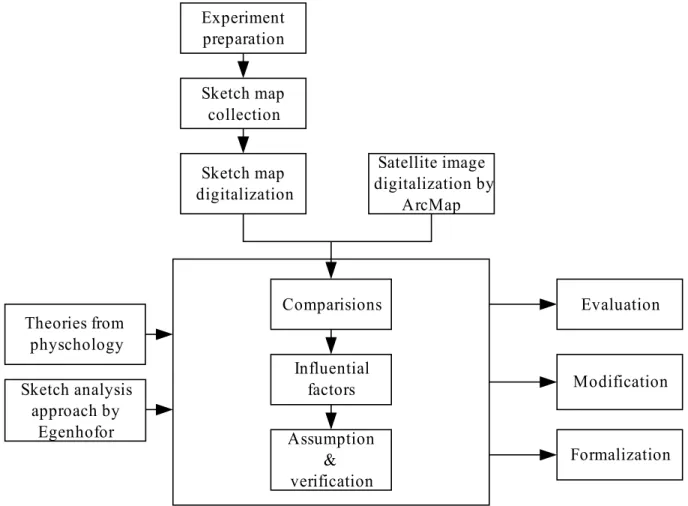
The following steps include: first, processing the comparisons between sketch map and map of reality and then listing the inaccuracy or errors people made. Second, Egenhofer's approach for sketch map analysis is applied to both maps. The outcomes of this step would be different spatial relations abstracted from sketch map and map of reality. Assumptions will be brought out on the basis of previous study findings to figure out how these inaccuracies and errors affect analysis accuracy in Egenhofer's, especially the accuracy in cardinal directions. In the end, modification and formalization are discussed on the basis of experiment outcomes from previous steps. The theories both from psychology and Egenhofer for sketch map representation and formalization are incorporated into the whole study. The main work flow in this thesis is illusrated as the following (Figure 1.2):
Figure 1.2: The main work flow of this thesis.
Hypothesis. It is quite common that people distort some spatial relations, or rather, what they draw indicates alternative topological relations that can not be obtained directly from sketches. As a result, among five types of spatial relations, we suppose only several of them are frequently effective when people are perceiving a map in their mind while others only take effect in specific situation or hardly appear or even are wrong.
Major Results. The major results of this thesis are listed as follows:
● Exploration of negative effects from human schematization and systematic errors on sketch map analysis
and formalization.
● Proposal of a modified approach to calculating positional relations and discussion of its applicability and
formalization.
1.3.Intended Audience
The intended audience of this thesis is those who have a research interest in cognition engineering, in building computational model for sketch representations. Software developers are also to be intended, since they may have huge interest in the design of methods for representing spatial relations from human sketches. This thesis may just well attract researchers of sketch-based interaction with computer and spatial query due to its relation to Spatial-Query-by-Sketch. A boarding audience including GIS professionals and geographers may also find this thesis helpful, because it aims to the future geographic information system, intelligent GISs.
1.4.Organization of Reminder of Thesis
The previous paragraphs make clear a motivation for the work throughout this study. A delineation is now entailed as to how the model and methods in the following chapters address the issues concerned. The remainder of this thesis is structured as follows:
Chapter 2
Related Work
Sketch map analysis is a board research topic involving psychology study of spatial cognition, sketch representation and machine intelligence. The most related work for this thesis is briefly reviewed here.
2.1.Related Study from Psychology
Within psychology, many researches like Tversky are focus on how do people think and communicate about the various spaces they inhabit and create. In sketch maps, people use space and spatial relations to represent abstract relations, temporal, quantitative, and preference, in stereotyped ways, suggesting that these mappings are cognitively natural. It has already been documented in psychology that, graphics as sketch maps reflect conceptions of reality, not reality. Consequently, it is inevitable that sketch maps omit information, they regularize, they use inconsistent scale and perspective, and they exaggerate, fantasize, and carry messages. These systematization of real world thereby produces errors. As below is a review of some documented errors people made in sketch maps.
Errors of Distance. Distance estimates in sketch maps are affected by irrelevant factors as hierarchical organizations, amount of information along the route and landmarks. For relative distance estimate in sketches, elements like buildings or water body are perceived as closer than those in different groups. In another situation, routes with many turns or intersections are always judged longer. Most remarkably, distance judgments are not necessarily symmetric. Distances to a landmark are judged shorter than distances from a landmark to an ordinary building.
Errors of Direction. Direction estimates are distorted as well in sketch maps. For example, people mentally rotate the directions of geographic entities around the axes created by themselves. Likewise, directions get straighted in memory. When people are asked to sketch a city map, curvatures are totally ignored or some routes may sketched as curves, but straighter than they actually are.
Other Notable Errors. There are other errors of spatial memory and judgment which are not systematic but appear frequently during human sketches. For example, people make errors of quantity, shape, size, and angles of intersections, as well as errors due to perspective.
As Tversky emphasized in her paper, all the sketched errors are not random or due to solely to ignorance; rather they appear to be a consequence of ordinary perceptual and cognitive processes. The nature of sketches make them useful tools for checking and conveying ideas and being served as an external display to facilitate inference and discovery while inevitable errors lead to negative effect if sketches are used for extracting exact configurations of the reality.
2.2.Related Study from Egenhofer
By the use of sketches, Egenhofer proposed a new method for spatial querying which is named as Spatial-Query-by-Sketch. It is the design of a query language for GISs and it allows a user to formulate a spatial query by drawing the desired configuration with a pen on a touch-sensitive computer screen and translate this sketch into a symbolic representation that can the processed against a geographic database (Egenhofer, M. 1997). Compared with traditional methods for spatial querying, using sketching for query is a more interactive way. Since sketching supports human spatial thinking directly, it is more clear than verbal spatial descriptions which are frequently ambiguous and may easily lead to misinterpretations when several users have to work together.
Symbolic representation is the key process of Spatial-Query-by-Sketch. It allows to abstract away details of the sketch which it emphasizes its salient parts. Using this method, sketch is represented internally as a semantic network of spatial objects and their binary spatial relations. Spatial-Query-by-Sketch is founded on a solid mathematical model of spatial relations and its relaxations. There are five types of spatial relations are of the most importance for capturing the essence of a spatial scene and thus are the core of Egenhofer's approach for sketch analysis. In the following is Egenhofer's approach for analyzing five types of spatial relations.
Coarse Topological Relations. This spatial relation is on the basis of a comprehensive model called 9-intersection. It is applied for the analysis of the binary topological relations between two objects of type area, line and point (Egenhofer, M. & Herring, J. 1990). It characterizes the topological relation between two point sets, A and B, by the set intersections of A's interior, boundary and exterior with the interior, boundary, and exterior of B, called the 9-intersection. For example, the coarse topological relations of two regions without holes in R2 have eight distinct relations which are called disjoint, meet, equal, overlap, inside, contains,
covers, and coveredBy (Figure 2.1).
Figure 2.1: Eight distinct topological relations between two simple regions. A B
A B A B A B A B B A B A A=B
Detailed Topological Relations. If further criteria are employed to evaluate the non-empty intersections, detailed topological relations can be applied to pairs of objects. In the case of detailed topological relations of two regions, the necessary invariants are component sequences, component dimensions, types of boundary-boundary component intersections, crossing directions, boundedness and component relationships. For example, detailed topological relations can be expressed by component invariant table for non-empty boundary-boundary sequences, which lists the sequence of boundary-boundary components and each component's dimension, type, crossing direction, boundedness, and complement relationship (Egenhofer, M. & Franzosa, R. 1991).
Metric Refinements. As Egenhofer wrote, “occasionally, topological per se is insufficient to characterize the essence of spatial relations”. To describe metrical details, measures about areas and lengths are applied as refinements of the topological properties and these measures are normalized values with respect to the areas or lengths of interiors and boundaries. As a result, these measures are scale-independent. Metric refinements are on the basis of non-empty intersections.
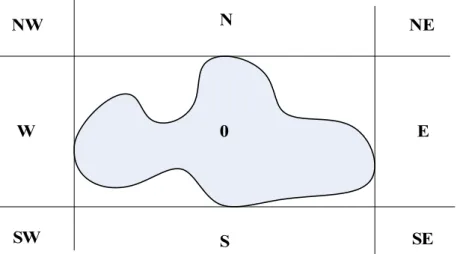
Coarse Cardinal Directions. Directions provide a basis for certain decisions about matching and similarity. For extended spatial objects as linear or areal features, Egenhofer proposed a new approach which adapt the projection-based method around the minimum bounding box of an object. Space around the bounding box is partitioned into nine regions for an areal object. These partitions are named north (N), northeast (NE), ease (E), southeast (SE), south (S), southwest (SW), west (W), northwest (NW), and at the same location (0). The positional relationships from an object to a target direction is described by recording the partitions into which at least some parts of the target object fall. (Figure 2.2) The experiments in this thesis are mainly focus on the analysis of cardinal directions among objects.
Figure 2.2: Projection-based cardinal directions for extended spatial objects.
Detailed Cardinal Directions. To provide more detail about directions among spatial objects, detailed cardinal directions are proposed by recording for each object that falls into more than one direction partition the percentage of the common intersection between a partition and the object. The range of each detailed cardinal directions x is 0<x<1.0. The sum of all percentages of an object with respect to the partitions of another object must be 1.0.
The five types spatial relations plus spatial objects form the scene network which is the basis for processing a 0
N NE
E
SE S
sketched query and for representing the query results in a prioritized order to the user. Because of the different levels of importance for capturing the semantics of a spatial scene, these five types of spatial relations are related to different query processing stages. Coarse topological relations are the key for pre-processing the sketched scene because by mapping the sketches relations onto 9-intersection model, we capture the most salient features of a sketch. Detailed topological relations capture complexity of topological relations so they are the key for analyzing the intentional complexity of the sketched relations. With the metrical refinements of the 9-intersection relations we formalize detailed geometric constraints about sketched spatial relations and cardinal directions are exploited for those queries in which the user explicitly states the importance of orientation relations or as a tie-breaker among sketched configurations with the same topology (Egenhofer, M. 1997). Finally detailed cardinal directions are used to rank the query results.
From above descriptions of related work from Egenhofer, we can conclude that the scene network including spatial objects and their spatial relations are the basis for Spatial-Query-by-Sketch. Moreover, five types of spatial relations capture the essence of spatial scenes people drew so they are the hard core in scene network for sketch interpretation and representation. Also these spatial relations are studied in this thesis as Egenhofer's approach for sketch map analysis.
2.3.Summary
In this chapter, two main achievements for a sketch map of a spatial scene are described: (1) What are the systematic and notable errors when people perceive a sketch map and (2) a symbolic representations of topological relationships proposed by Egenhofer for sketch analysis.
Chapter 3
Experiment and Assumptions
In this chapter, the present study explores the inaccuracy people made when they draw sketch maps of specified locations and analyzes these maps by comparing with the real two-dimensional maps. As the reflections of human conceptions of reality, sketch maps use inconsistent scale and perspective, and they omit some information, exaggerate, fantasize and carry messages. The experiment in this chapter is aimed at discovering human schematization and systematic errors which are stored in sketch maps and then apply sketch analysis approach from Egenhofer to sketch maps to figure out how these errors influence analysis accuracy .
3.1.Experiment Preparation
Drawing abilities are diverse among different participants and they may influence the goodness of spatial representations of the reality. As a consequence, it might happen that both two participants have almost the same cognitive maps of the same location but due to their drawing abilities, their final sketches may get completely different rankings on how well the map represent the real world. Moreover, a not well-drawn sketch map may increase the difficulties of recognition, analysis and formalization in the future. Consequently, a sample map is essential to show participants how a sketch map looks like so as to eliminate the adverse effect from participants drawing ability.
Likewise, the choice of spatial scale for sketches also has impact on the accuracy of final maps and the amount of information stored in sketches. Many spatial properties can not be described independently of scale. It is quite common that different geographic knowledge is captured from the same region but under different scales. Similar to geographic data with different scales, people draw maps with different levels of details according to the size of region. Only main streets but not all the street branches will be kept if people are asked to draw an overview of the whole city, whereas most of the street intersections will be depicted if the experiment instruction is describing the route from your home to the nearest supermarket.
Which pictorial elements are of the essence of a sample map? Which location scale is proper for the present study? In order to find out, an exploratory testing is held with 3 participants as an experiment preparation.
familiar with the provided locations. Data from all the participants were analyzed and reported below.
Locations. To find the most suitable locations for this thesis, three locations with different scales were chosen and participants were asked to draw them according to the given instructions. The first drawing task was describe a visitor the region around IFGI 2.0 which includes the bakery and segments of “Weseler-Str” and “Inselbogen”. The second one was the drawing task covering the region from IFGI 2.0 to Mensa Aasee. The third one was depicting the region from castle to IFGI 1.0. After checking sketch outcomes, the first two locations were discarded. The small region around IFGI 2.0 does not have enough spatial objects and is too simple to be investigated whereas the region from IFGI 2.0 to Mensa Aasee has too many spatial objects and complex route information which is too difficult for participants to draw. All the participants spent more than 40 minutes on drawing and one of them even took more than one hour to finish the task. Finally the location from castle to IFGI 1.0 was chosen since it has a proper area of location, a suitable length of route and a certain amount of objects which are both suitable for analysis and easy for depicting.
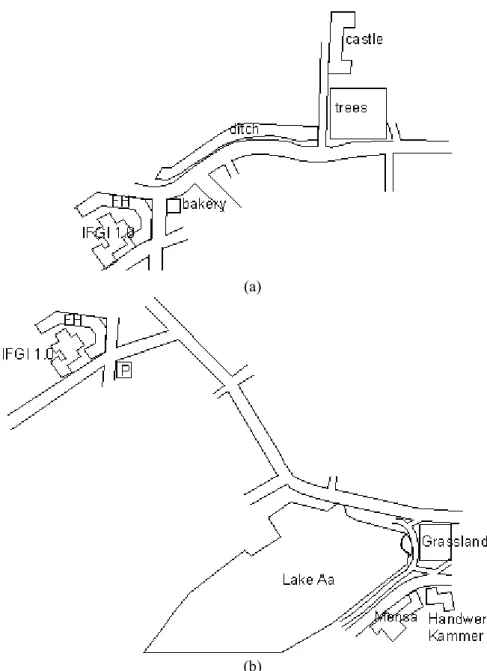
Location I from castle to IFGI 1.0 (see Figure 3.1) and Location II from Mensa Aasee to IFGI 1.0 (see Figure 3.2) with similar scales were chosen as testing regions and participants were asked to depict these regions following the given instructions. In current study, the spatial scales of locations and other basic information are described as below (Table 3.1). The data source of Figure 3.1 is from “City Plan” in website of city Muenster3.
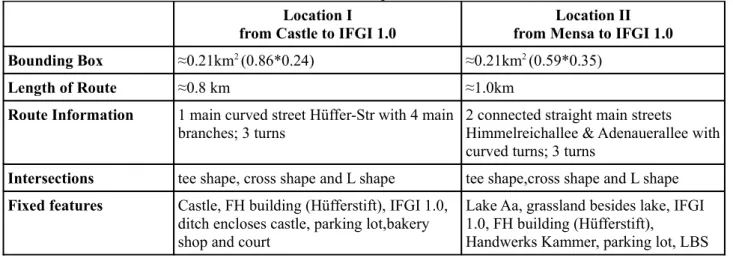
Table 3.1: Basic information of two locations with similar spatial scales.
Location I from Castle to IFGI 1.0
Location II from Mensa to IFGI 1.0
Bounding Box ≈0.21km2 (0.86*0.24) ≈0.21km2 (0.59*0.35)
Length of Route ≈0.8 km ≈1.0km
Route Information 1 main curved street Hüffer-Str with 4 main branches; 3 turns
2 connected straight main streets Himmelreichallee & Adenauerallee with curved turns; 3 turns
Intersections tee shape, cross shape and L shape tee shape,cross shape and L shape
Fixed features Castle, FH building (Hüfferstift), IFGI 1.0,
ditch encloses castle, parking lot,bakery shop and court
Lake Aa, grassland besides lake, IFGI 1.0, FH building (Hüfferstift), Handwerks Kammer, parking lot, LBS
(a)
(b)
Figure 3.1: Real maps of both locations: (a) overview of the scene from castle to IFGI1.0 and (b) overview of the scene from Mensa Aasee to IFGI 1.0.
Task Description of location I: Please draw a sketch map describing the spatial scene you see when you walk from castle to the IFGI 1.0 (Robert-Koch Str 26). Please depict the map with the most salient fixed features along the path you take and try to draw them as accurately as possible.
Materials: A piece of A4 paper, a black pen and a sample map (see Figure 3.2)
Task Description of location II: Please draw a sketch map describing the spatial scene you see when you walk from “Mensa Aasee” near lake Aa, cross over the green land with “Aasee Kugel” and finally arrive IFGI 1.0 (Robert-Koch Str 26). Try to depict the map with the most salient fixed features along the path you take and try to draw them as accurately as possible.
Materials: A piece of A4 paper, a black pen and a sample map(see Figure 3.2)
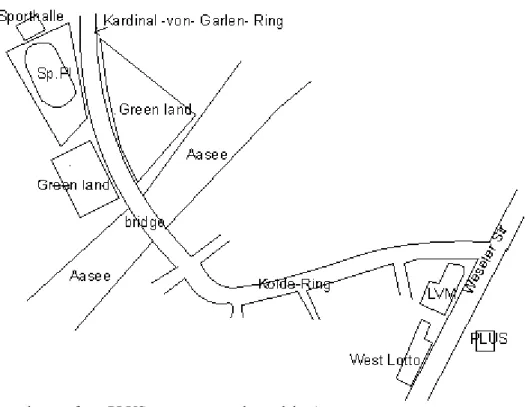
Figure 3.2: A sample map from PLUS to sport ground near lake Aa.
Table 3.2: Object participants drew from preliminary experiment.
Geographic features Non-geographic features
Ditch Other Castle IFGI 1.0 Bakery shop FH building Others
PA O X O O O O Bus stops
Botanic garden
PB O Trees O O O O Parking lot
PC O Green land O O O O Land Gericht
Bus stops (O-object sketched, X-object not sketched, PA, PB, PC represent participant A, B and C)
3.2.Approach of Sketch Map Analysis
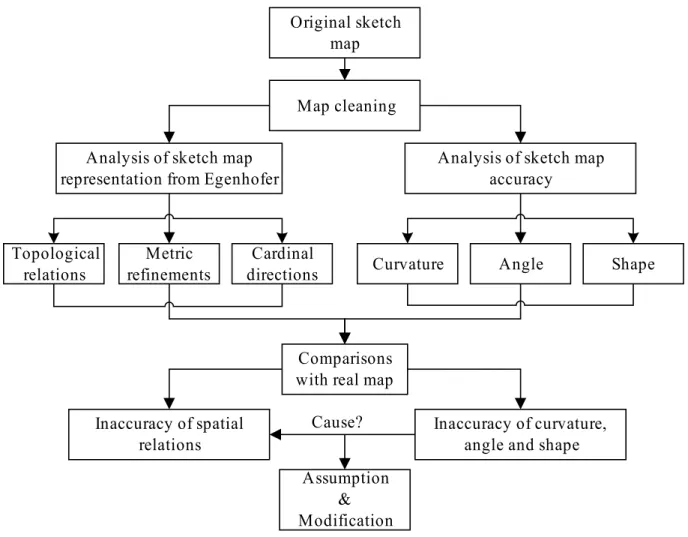
In this thesis, sketch map analysis is mainly focus on two aspects, one is on the map accuracy of curvature, angle and shape and the other is on topological, metric and cardinal directions by borrowing the idea from Egenhofer. The theoretical basis for the former has its root in psychology of spatial cognition. The work flow of sketch map analysis is describe here (Figure 3.3).
Figure 3.3: Workflow of sketch analysis method.
Map cleaning is using the tool from ArcMap to clean drawing errors such as overshoots, undershoots and silvers. The origin sketch map was imported to ArcMap as raster data and drawing tools were used to trace
Map cleaning
Analysis of sketch map accuracy
Inaccuracy of curvature, angle and shape Topological relations Metric refinements Cardinal directions
Inaccuracy of spatial relations Assumption & Modification Original sketch map Comparisons with real map Analysis of sketch map
representation from Egenhofer
Curvature Angle Shape
pictorial elements in original sketch maps and finally we got cleaned maps. In this paper, the sketch map analysis is based on the assumption that all the spatial or non-spatial information have already extracted and interpreted as given information. Figure 3.4 is one example of a cleaned sketch map.
(a) (b)
Figure 3.4: One example of cleaned map in ArcMap. (a) is the original sketch map and (b) is the corresponding cleaned map.
After cleaning the sketches, the next steps were the two main aspects of sketch map analysis. One was the measurement of sketch map accuracy from psychology and the other was focus on the accuracy of different spatial relations using Egenhofer's approach for sketch analysis. The detailed processes were discussed with real maps for both locations as below.
3.2.1.Curvature, Angle and Shape
The locations chosen for experiment were the mixture of route and region. In this thesis, the accuracy measurement was mainly focus on curvature, angle and shape of route and spatial objects.
Figure 3.5: Route information of curvature and angle in location I from castle to IFGI 1.0.
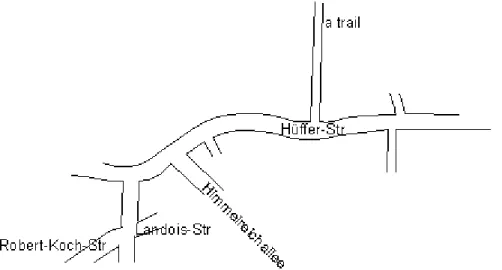
Location II. For location II, the main streets from student cafeteria (Mensa Aasee) to IFGI 1.0 are “Bismarck-Allee”, “Moderschnweg”, “Adenauer-Allee,” “Himmelreich-Allee”, “Landois-Str” and “Robert-Koch-Str” (Figure 3.6). The route from Mensa Aa to IFGI 1.0 is a twisty path that has in total 3 bends and connects with several other streets or small trails. Compared with the wavy street “Hüffer-Str”, streets in location II are more like polylines. Complex shapes of objects were also discovered in location II, such as lake Aa, IFGI 1.0 and FH building (see Figure 3.1b).
Figure 3.6: Route information of curvature and angle in location I from Mensa Aasee to IFGI 1.0.
3.2.2.Sketch Map Analysis from Egenhofer
coarse cardinal directions, and detailed cardinal directions. In the following, this approach was applied to map of the reality to explore the spatial relations among objects.
Location I. In location I, almost all the spatial objects are scattered buildings locating along “Hüffer-Str”. Therefore when mapping the sketched relations onto 9-intersection relations, we only got one topological relations of “disjoint”. Detailed topological relations and metric refinements which are based on non-empty intersections are not available to be calculated. Figure 3.7 is the analysis results of coarse topological relations, coarse cardinal directions and detailed cardinal directions for location I.
(a)
Figure 3.7: A real map (a) of location I and the scene networks of (b) topological relations, (c) cardinal directions, and (d) detailed cardinal directions (only the relations for object A are shown)
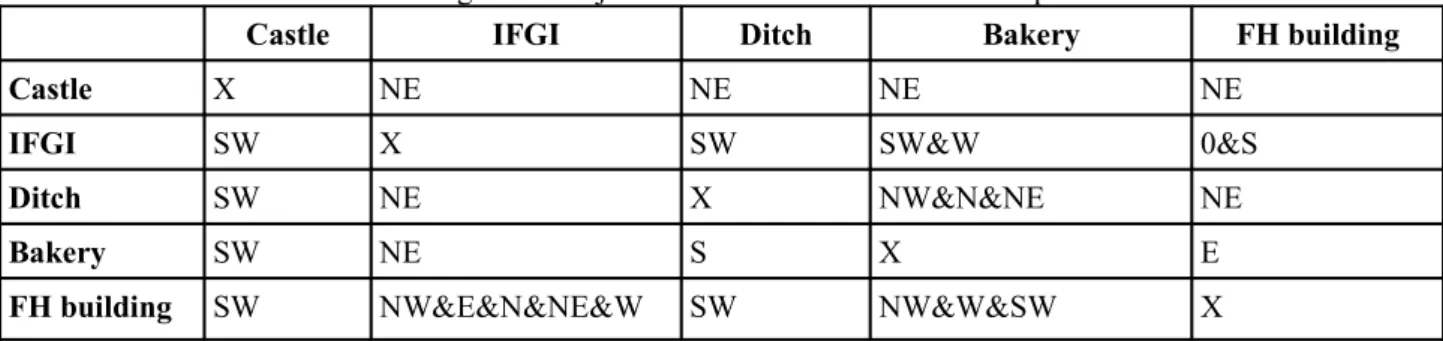
Figure 3.7 shows 5 areal objects, which received unique identifiers. These identifiers are used consistently throughout the scene network (A, B1, B2, C and D represent IFGI, FH building, bakery shop, castle and ditch respectively in location I). Figure 3.7b-d show subsets of the scene network, focusing on the spatial relations with respect to object A. Figure 3.7b depicts for object A the binary topological relations that were derived from the 9-intersection model. Figure 3.7c shows coarse cardinal directions and 3 objects fall completely into a single partition (B2, D, C), while B1 spans over 5 partitions. Details about the distribution over multiple partitions are captured in Figure 3.7d, recording by how much an object extends over multiple partitions. Table 3.3 is the outcome of cardinal directions among all objects.
A
B1
B2
D
C
disjoint disjoint disjoint disjointA
B1
B2
D
C
NE NE NE&E& W& NW&N NEA
B1
B2
D
C
E=0.54& NE=0.16& N=0.38& NW=0.1& W=0.02Table 3.3: Cardinal directions among all the objects of location I from the real map.
Castle IFGI Ditch Bakery FH building
Castle X NE NE NE NE
IFGI SW X SW SW&W 0&S
Ditch SW NE X NW&N&NE NE
Bakery SW NE S X E
FH building SW NW&E&N&NE&W SW NW&W&SW X
Location II. Similarly, the same situation was found in location II. Figure 3.8 is the analysis results of coarse topological relations, coarse cardinal directions and detailed cardinal directions for location II.
(a)
Figure 3.8: A real map (a) of location II and the scene networks of (b) topological relations, (c) cardinal directions, and (d) detailed cardinal directions (only the relations for object A are shown)
Figure 3.8 illustrate the use of approach from Egenhofer for the construction of a scene network. Figure 3.8a shows 5 areal objects, which received unique identifiers. These identifiers are used consistently throughout the scene network(A, B1, B2, C and D represent IFGI, Mensa, FH building, grassland and Lake Aa). Figure 3.8b-c show subsets of the scene network, focusing on the spatial relations with respect to object A. Figure 3.8b depicts for object A the binary topological relations that were derived from the 9-intersection model. Figure 3.8c shows coarse cardinal directions and 3 objects fall completely into a single partition (B1, C, D), while B2 spans over 5 partitions. Details about the distribution over multiple partitions are captured in Figure 3.8d, recording by how much an object extends over multiple partitions. Table 3.4 is the outcome of cardinal
A
D
B1
B2
C
disjoint disjoint disjoint disjointA
D
B1
B2
C
0&E& N& NE SE
SE SE
(b) topological relations (c) cardinal directions
A
D
B1
B2
C
E=0.54& NE=0.16& N=0.38& NW=0.1& W=0.02 SE SE SEdirections among all objects.
Table 3.4: Cardinal directions among all the objects of location II from the real map.
Mensa Aasee Lake Aa IFGI Grassland FH building
Mensa Aasee X 0 SE SW SE
Lake Aa N&NW&W&SW&NE X SE NW&W&SW SE
IFGI NW NW X NW 0&S
Grassland NE E SE X SE
FH building NW NW W&N&NE&E&NW NW X
3.3.Experiment Outcomes
Formal experiment was based on the exploratory test with 7 more participants. All the sketch maps were analyzed later to explore how human schematization and systematic errors take effect on map formalizations.
3.3.1.General Overview
The introductions, sample map and areas described in exploratory testing were adopted. 10 participants (4 female, 6 male, average age of 27.5) participated in the experiment for the sketching task. They were recruited among the people working and studying at the Institute for Geoinformatics. All of them are familiar with the areas need to be drawn. Though all of them are with GI4 experience, it doesn't mean that they have a specifically well understanding of sketching spatial scene or have better spatial intelligence and good at spatial reasoning. The demand of terminology such as feature, spatial and non-spatial object or sketch map for this group of people was not necessary.
Each participants were provided with a piece of blank paper with A4 format, a black pen and one more paper with task descriptions and a sample map in English. They were not allowed to get help from real maps as Google Map or Google Earth. The average time for completing two maps was around 30 minutes.
Of all 20 sketch maps for both locations only 14 are included in the following analysis. 6 were discarded because their sketch maps were too simple to be analyzed which means there was only 2 or 3 objects depicted and even the most salient objects were totally ignored. For example, one sketch map depicting location I only contains castle and IFGI as the start and ending points and one more street connecting them. In current study, a certain amount of objects were of vitally requirement. Either the descriptions of routes and landmarks or the analysis of topology, metric and cardinal relations in the following study need enough objects, at least the salient ones.
Table 3.3 and Table 3.4 provide the results of objects people sketched on their maps. The most common
objects
people drew for location I were castle, IFGI 1.0, FH building (or Hüfferstift), bakery shop (or oneparticipant named it as Cafe) and ditch. And the most drew objects from cafeteria (or Mensa Aasee) to IFGI 1.0 were cafeteria, IFGI 1.0, lake Aa, grassland with “Aasee Kugel” and FH building (or Hüfferstift). The
criteria for “most common” objects was that among 10 participants, there were no less than 50% of the people drew such objects.
Table 3.5: Object classes5
from castle to IFGI 1.0.
Geographic features Non-geographic features
Ditch Other Castle IFGI Bakery shop FH building Others
PA O X O O O O Bus stops
Botanic garden
PB O Trees O O O O Parking lot
PC O Grassland O O O O Court
Bus stops
PD O Trees O O O O Uni building
PE O X O O O O Uni building
PF X X O O X X X
PG O O O O O Courts
Botanic garden Cemetery Residential areas Swimming pool
PH X X O O X O Park
House besides Gravestones shop
PI O O O O O Court
Botanic garden Copy shop Swimming pool
Square in front of castle with promenade
PJ O Trees O O O O Parking lot
(O-object sketched, X-object not sketched)
Table 3.6: Object classes from Mensa Aasee to IFGI 1.0.
Geographic features Non-geographic features
Lake Aa Grassland with “Aasee Kugel”
Cafeteria (Mensa Aasee)
IFGI LBS FH building Cemetery Others
PA O O O O X X X X
PB O O O O O O X Sculpture
River Aa Promenade
PC O O O O O O X Music school
Studentenwerk Promenade Uni building Bar close to Aasee
PD O O O O X O O Uni building
PE O O O O O O X Uni building
PF O X O O X X X X
PG O O O O O O O HWK
Music school Swimming pool Uni building Pub
Promenade
PH O O O O X O X Park
LVM
Gravestones shop
PI O O O O X O O Parking lot
PJ O O O O X O X Bakery
3.3.2.Curvature, Angle and Shape: Sketch Maps of Location I
The main streets from castle to IFGI 1.0 is “Hüffer-Str” of west-east trend with its intersections with street “Himmelreich-Allee”, “Robert-Koch-Straße” and a trail behind castle. All the participants drew these three streets because they are main streets or close to salient landmarks (Figure 3.9). For other street segments, one small branch was totally ignored and others were only sketched by a few people.
Figure 3.9: Statistics of street information that participants depicted from castle to IFGI 1.0. (The numbers represent numbers of people who drew the street segments in their sketch maps)
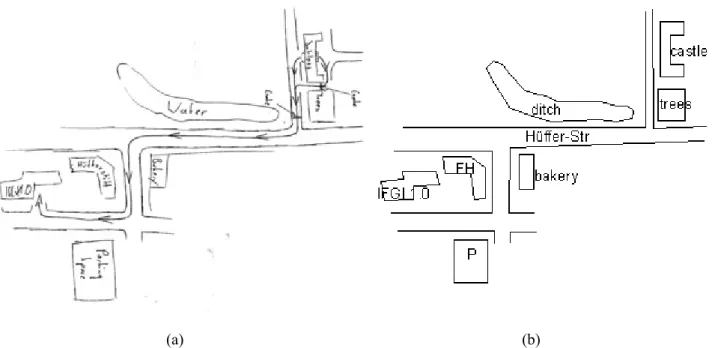
Route information was not only omitted but also simplified and distorted. For example, directions got straighted in memory so all the streets were sketched straightly although they are curved in the reality. Likewise, all the angles of turns were simplified to 90 degree. Besides, all the shapes of objects were simplified but not the exact or even similar shapes as they are in the reality. Figure 3.10 is a comparison of one sketch map and its corresponding real map.
(a) (b)
Figure 3.10: An example illustrating differences of curvature, angle and shape between real map and sketch map. (a) is from real map and (b) is from sketch map.
building. Secondly, information is simplified and distorted as well. In the above example sketch map, “Hüffer-Str” is a straight street and oriented horizontally although it has two main bends in the reality. Likewise, all the angles of turns were drew as 90 degrees even in reality they are just 30 degree, eg., the turn in “Robert-Koch-Str”.
3.3.3.Sketch Map Analysis from Egenhofer : Sketch Maps of Location I
Figure 3.13 illustrate one example of the use of five types of spatial relations for the construction of a scene network. The sketch (Figure 3.11a) from one experiment participant shows six areal objects, which received unique identifiers. These identifiers are used consistently throughout the scene network.(A, B1, B2, C and D represent IFGI, FH building, bakery shop, castle and ditch respectively in location I) Figure 3.11b-d show subsets of the scene network, focusing on the spatial relations with respect to object A. Figure 3.11b depicts for object A the binary topological relations that were derived from the 9-intersection model. Figure 3.11c shows coarse cardinal directions and 3 objects fall completely into a single partition (C, D), while B1 and B2 span over two partitions. Details about the distribution over multiple partitions are captured in Figure 3.11d, recording by how much an object extends over multiple partitions. Since all the objects are disjoint with each other so in our case, there are no calculations of non-empty intersections for detailed topological relations and metric refinements.
(a)
Figure 3.11: A sketch map (a) of location I and the scene networks of (b) topological relations, (c) cardinal directions, and (d) detailed cardinal directions (only the relations for object A are shown)
Data treatment: All the participants drew correct topological relations. Calculations of Cardinal directions were processed among the most common drew spatial objects, in this case, which were IFGI 1.0, ditch, castle, bakery shop and FH building. Among 10 sketch maps, 3 of them were discarded because they did not have enough objects to be analyzed. The number of correctly sketched cardinal directions of the rest 7
A
B1
B2
D
C
disjoint disjoint disjoint disjointA
B1
B2
D
C
NE&E NEN E& E NE
A
B1
B2
D
C
E=0.59& NE=0.41 E=0.46& NE=0.54participants was 14, 14, 13, 13, 12, 8, 12 respectively. And the average accuracy rate of cardinal directions was 61%. The following tables are results from all participants and italic and bold fonts represent the different cardinal directions people sketched.
Table 3.7: Cardinal directions of location I from participant A. (the same participant whose sketch map was analyzed as an example in Figure 3.11)
Name Coarse cardinal directions Inaccuracy
PA
Castle IFGI Ditch Bakery FH building
6
Castle X NE E&NE NE NE
IFGI SW X SW W&SW W
Ditch SW&W NE X NW&N&NE NE
Bakery SW NE&E S X E
FH building SW NE&E SW W&SW X
Table 3.8: Cardinal directions of location I from participant B.
Name Coarse cardinal directions Inaccuracy
PB
Castle IFGI Ditch Bakery FH building
6
Castle X NE E&NE NE NE
IFGI SW X SW W&SW W
Ditch SW&W NE X NW&N&NE NE
Bakery SW NE&E S X E
FH building SW NE&E SW W&SW X
Table 3.9: Cardinal directions of location I from participant C.
Name Coarse cardinal directions Inaccuracy
PC
Castle IFGI Ditch Bakery FH building
7
Castle X NE E&NE NE NE
IFGI SW X SW SW S&SE
Ditch W&SW NE X NW&N&NE NE
Bakery SW NE S X NE
FH building SW NW&N SW SW X
Table 3.10: Cardinal directions of location I from participant D.
Name Coarse cardinal directions Inaccuracy
PD
Castle IFGI Ditch Bakery FH building
7
Castle X NE E&NE NE NE
IFGI SW X SW SW S&SE
Ditch W&SW NE X NW&N&NE NE
Bakery SW NE S X NE
Table 3.11: Cardinal directions of location I from participant E.
Name Coarse cardinal directions Inaccuracy
PE
Castle IFGI Ditch Bakery FH building
8
Castle X NE E NE NE
IFGI SW X SW SW NE
Ditch W NE X N&NE NE
Bakery SW NE S X W
FH building SW E&NE SW SW X
Table 3.12: Cardinal directions of location I from participant F.
Name Coarse cardinal directions Inaccuracy
PF
Castle IFGI Ditch Bakery FH building
12
Castle X NE N NE NE
IFGI SW X SW W&NW W
Ditch S&SE&S W
NE X NE E
Bakery SW E&SE SW X E&SE
FH building SW NE&N SW&W W&NW X
Table 3.13: Cardinal directions of location I from participant G.
Name Coarse cardinal directions Inaccuracy
PG
Castle IFGI Ditch Bakery FH building
8
Castle X NE NE&E NE NE
IFGI SW X SW SW SW
Ditch W NE X N&NE&NW NE&N
Bakery SW NE S X E
FH building SW NE SW&S SW&W X
From the resulting tables, most of the errors were related to the ditch, IFGI and FH building. After going back to the sketch maps themselves, the systematic errors of spatial memory and judgment which have been documented in psychology were found and other errors like shape which is due to perspective. For example, compared with other objects, the area of ditch was underestimated; participants showed a strong tendency to straighten the streets; all the angles of route intersection were drawn as 90 degree and some participants simplified shapes of IFGI, FH building and castle to rectangles.
3.3.4.Curvature, Angle and Shape: Sketch Maps of Location II
which connect with the walking route were drawn by 5 and 4 participants respectively. Additionally, there were 4 participants depicted the promenade on their sketch maps and considered it as the green region containing several alleys. Figure 3.12 represents the analytical results of route information from sketch maps.
Figure 3.12: Statistics of street information that participants depicted from cafeteria to IFGI 1.0. (The numbers represent numbers of people who drew the street segments in their sketch maps.)
3.3.5.Sketch Map Analysis from Egenhofer : Sketch Maps of Location II
(a)
Figure 3.13: A sketch map (a) of location II and the scene networks of (b) topological relations and (c) cardinal directions (only the relations for object A are shown)
Data treatment: No participants making mistakes of topological relations. Calculations of cardinal directions were processed among the most common drew spatial objects, in this case, which were student cafeteria, IFGI 1.0, lake Aa, grassland with “Aasee Kugel” and FH building. Among 10 sketch maps, 3 of them were discarded because they did not have enough objects to be analyzed. The number of correctly sketched cardinal directions from the rest 17 participants was 15, 11, 11, 11, 14, 10, 12 respectively. The average accuracy rate of cardinal directions was 60%. The following tables are results from all participants and italic and bold fonts represent the different cardinal directions people sketched.
Table 3.14: Relative object positioning from a sketch map (the same participant whose sketch map was analyzed as an example in Figure 3.13).
Name Coarse cardinal directions Inaccuracy
PA
Mensa Aasee IFGI Grassland FH building
5
Mensa X S SE SW SE
Aasee N&NE&NW X SE W&NW SE
IFGI NW NW X NW W
Grassland NE E SE X SE
FH building NW NW E NW X
A D B1 B2 C disjoint disjoint disjoint disjoint A D B1 B2 C E SE SE SE
Table 3.15: Relative object positioning from a sketch map of participant B.
Name Coarse cardinal directions Inaccuracy
PB
Mensa Aasee IFGI Grassland FH building
10
Mensa X S SE SW SE
Aasee NW&N&NE X SW&S&SE W SW&S&SE
IFGI NW N X NW 0&W&SW&S
Grassland NE NE&E SE X SE
FH building NW N E&N&NE NW X
Table 3.16: Relative object positioning from a sketch map participant C.
Name Coarse cardinal directions Inaccuracy
PC
Mensa Aasee IFGI Grassland FH building
10
Mensa X S SE SW SE
Aasee NW&N&NE X SW&S&SE W SW&S&SE
IFGI NW N X NW 0&W&SW&S
Grassland NE NE&E SE X SE
FH building NW N E&N&NE NW X
Table 3.17: Relative object positioning from a sketch map participant D.
Name Coarse cardinal directions Inaccuracy
PD
Mensa Aasee IFGI Grassland FH building
9
Mensa X S SE SW SE
Aasee NW&N&NE X S&SE W SW&S&SE
IFGI NW N X NW W
Grassland NE E SE X SE
FH building NW N E NW X
Table 3.18: Relative object positioning from a sketch map participant E.
Name Coarse cardinal directions Inaccuracy
PE
Mensa Aasee IFGI Grassland FH building
6
Mensa X S&SE SE SW SE
Aasee N&NW X SE W SE
IFGI NW NW X NW SW
Grassland NE E&NE SE X SE
Table 3.19: Relative object positioning from a sketch map participant F.
Name Coarse cardinal directions Inaccuracy
PF
Mensa Aasee IFGI Grassland FH building
10
Mensa X S SE SW SE
Aasee NW&N&NE X S&SE W SE&S&SW
IFGI NW N X NW W&SW
Grassland NE E&NE SE X SE
FH building NW N E&NE NW X
Table 3.20: Relative object positioning from a sketch map participant G.
Name Coarse cardinal directions Inaccuracy
PG
Mensa Aasee IFGI Grassland FH building
8
Mensa X S SE SW SE
Aasee N&NE X SE&E W SE
IFGI NW W&NW X NW S&0&W&SW
Grassland NE E E&SE X SE
FH building NW NW N&NE&E NW X
From the resulting tables, most of the errors were related to Lake Aa, FH building and IFGI. People made errors of shapes, relative areas and angularity of these objects. Inparticipant's sketches (Figure 3.10),instead of drawing the exact or approximate shapes of IFGI , FH building and lake Aa, people simplified them into rectangles or oblongs or ellipses. In addition, the directions of the main roads got straightened in sketch maps which change the relative positional relations between objects nearby.
3.4.Discussion of Outcomes
In order to figure out relationships between inaccuracy or errors participants made and the accuracy of calculations for spatial relations, especially cardinal directions, one assumption was raised as below. Here we focus on how documented errors, especially distortions or simplification on shapes, curvatures and angle, influence cardinal directions. We assumed that these three errors mainly cause the mistakes in cardinal directions. The method for the assumption-proof is changing the pictorial elements from assumption and their related elements and keep all other sketch elements the same as the original. Then cardinal directions will be calculated on modified sketch map again and the correlation of accuracy of cardinal directions and pictorial elements will be built. The experiment was based on Location I and only one participant's sketch map was analyzed as below.
participant's perception, ditch is along with the segment of street “Hüffer Str”. As the reflection of participant's perception, in sketch map, the ditch extends along with the street “Hüffer-Str” and changes its trend at the intersection near FH building. Therefore, the outline of ditch had to be modified as an associated element with path curvature. Likewise, the shape of building FH building was modified to make its edges along with the street as participant perceived (Figure 3.14).
Figure 3.14: Modified sketch map with curved path and all other pictorial elements remain the same (The right map is the original one with straightened street “Hüffer-Str”)
The same approach for cardinal directions applied to the modified map. All other pairs of cardinal directions remained unchanged, only pairs of relations including ditch or FH building were computed here. Compared with Table 3.3, the resulting tables (Table 3.21) shows that the map with modified elements of curved path and its related objects corrects 3 errors (bold and italic fonts) of cardinal directions from original map and make the sketches more accurate. As a consequence, it is reasonable to conclude that the accuracy of path curvature and the shape of its related path- extent objects influence the accuracy of cardinal directions. If coefficient r is imported to indicates the degree of linear relationship or correspondence between these elements, the following equation represents the fact that to some extend, accuracy of path curvature and the shape of its related path- extent objects account for the accuracy of cardinal directions.
(Equation 3.1)
In this equation:
Y is the value of cardinal directions accuracy
X1 is a function with two variants Cuv and Shp. Cuv is the accuracy of path curvature and Shp represents the shape of path-extent objects.
r1 describes the degree of relationship between Y and X1 . In this case r1>0 which means positive correlation of X1 to Y.
Table 3.21: Cardinal directions of modified sketch map of curvature.
Cardinal directions relative to all other spatial objects
Castle IFGI Parking lot Bakery
FH building SW NE&E N&NW SW&W&NW
Ditch SW NE NE N
Cardinal directions relative to FH and ditch
FH building Ditch
Castle NE NE
IGFI W SW
Ditch NE X
Parking lot S SW
Bakery E S
FH building X SW
Angle. To verify this assumption, participant sketch map was modified as the following picture: angels of intersections were depicted as they look like in the reality while all other pictorial elements were keep unchanged (Figure 3.15). However, it was impossible to both keep the correct path angles and the original relative positional relations at the same time. From participant's mind, edges with mark numbers of IFGI and FH building are all paralleled with their adjacent street segments. To keep the same relative positional relations with modified paths, the integral parcel (to keep the relative positional directions between objects inside parcel unchanged) of IFGI and FH building needed to rotate anticlockwise until edge 1 paralleled with the adjacent street “Robert-Koch-Str” and then do the translation to make sure that the distance to adjacent streets were unchanged. Bakery and parking lot were rotated in the same way to make their positions with relative to modified streets the same as original map. Moreover, the shape of FH building was modified to make edge 3 and edge 4 being parallel with adjacent streets.
Figure 3.15: The left one is with angle modified only and right one is with additional modifications (1, 2, 3, 4 represent related edges which need to be modified ).
cardinal directions from original map and make the sketches more accurate. Considering the outcome of assumption 1, correctness of angles is one main influence for map goodness but not the leading cause for map errors.
Table 3.22: Cardinal directions of modified sketch map of angle.
Cardinal directions relative to other objects
Castle IFGI Bakery Parking lot
IFGI SW X SW&W NW
FH building SW E&NE SW&W&NW N&NE
Cardinal directions relative to FH and IFGI
IFGI FH building
Castle NE NE
IGFI X SW&W
Ditch NE NE
Parking lot SE S
Bakery NE E
FH building E+NE X
Equation 3.1 can be modified as the following:
(Equation 3.2)
In this equation:
X2 is a function with two variants Ang and Shp. Ang is the accuracy of path angles and Shp represents the shape of path-extent objects.
r2 describes the degree of relationship between Y and X2. In this case, r1>r2>0 which means the correlations of X2 to Y is positive but the degree is not as strong as X1.
Figure 3.16: The left one is the modified map only with shapes changed and the right one is modified map with both shapes and its related elements as curvature and angle changed at the same time.
The outcome of cardinal directions for modified sketch map corrected 5 errors from the original one( bold and italic characters in Table 3.23). Similarly, the original equation can be further adjusted to equation 3.3 as the following:
(Equation 3.3) In the equation:
Shp represents the shapes needed to be corrected; Cuv and Ang represent the path curvature and intersection-angle which are adjacent to the objects whose shapes need modification.
r3 describes the degree of relationship between Y and X3 . In this case r3>r1>r2>0 which means the positive correlation of X3 to Y and moreover, among all three influential factors, X3 has the most strongest correlation with Y.
Table 3.23: Cardinal directions of modified sketch map of shape.
Castle IFGI Ditch Parking lot Bakery FH building
Castle X NE NE NE NE NE
IFGI SW X SW NW SW&W 0&W&SW
Ditch SW NE X NE NW&N&NE NE
Parking lot SW SE SW X SW S
Bakery SW E&NE S NE X E
FH building SW E&N&NE SW N&NW NW&W&SW X