REMOTE VISUALIZATION AND NAVIGATION OF 3D MODELS OF ARCHEOLOGICAL
SITES
M. Callieri, M. Dellepiane, R. Scopigno
Visual Computing Lab, ISTI-CNR, Via G. Moruzzi 1, 56124 Pisa (PI), Italy Web: http://vcg.isti.cnr.it/ Contact:surname@isti.cnr.it
ABSTRACT:
The remote visualization and navigation of 3D data directly inside the web browser is becoming a viable option, due to the recent efforts in standardizing the components for 3D rendering on the web platform. Nevertheless, handling complex models may be a challenge, especially when a more generic solution is needed to handle different cases. In particular, archeological and architectural models are usually hard to handle, since their navigation can be managed in several ways, and a completely free navigation may be misleading and not realistic. In this paper we present a solution for the remote navigation of these dataset in a WebGL component. The navigation has two possible modes: the ”bird’s eye” mode, where the user is able to see the model from above, and the ”first person” mode, where the user can move inside the structure. The two modalities are linked by a point of interest, that helps the user to control the navigation in an intuitive fashion. Since the terrain may not be flat, and the architecture may be complex, it’s necessary to handle these issues, possibly without implementing complex mesh-based collision mechanisms. Hence, a complete navigation is obtained by storing the height and collision information in an image, which provides a very simple source of data. Moreover, the same image-based approach can be used to store additional information that could enhance the navigation experience. The method has been tested in two complex test cases, showing that a simple yet powerful interaction can be obtained with limited pre-processing of data.
1. INTRODUCTION
The remote visualization (via Web) of complex geometry has become feasible only in the last couple of years. The WebGL framework allowed to overcome the proprietary plugins issue, and three-dimensional content is slowly becoming a usual type of content for web pages.
The issues about the visualization of 3D models are related not only to the necessity to handle complex data, but also to the in-teraction with them. Navigating 3D environments is not trivial, due to both the nature of data and the fact that most of the users are not used to that. This is especially true when dealing with 3D models of complex environment (terrains with buildings and ruins, often found in the archeological field); even more when 3D models come from sampling technologies (3D scanning or 3D-from-photo), which produce high-resolution, unstructured tri-angulated models. What is the best way to interact with them? A completely free navigation may be hard to handle, while ex-tremely constrained approaches may limit their potentials. While it is possible to borrow ideas from the entertainment world (i.e. videogames industry), the best solution would be to find a flex-ible, lightweight system needing only a small amount of pre-processing.
This paper presents a method for the navigation of complex arch-elogical 3D environments, especially tailored for web visualiza-tion. The main contributions include:
• An intuitive navigation paradigm which includes two pos-sible modes: thebird’s eyeview, where the user can ex-plore the model from top; and thefirst personmode, where the user can walk inside the environment in a walk-through fashion. The two modes are linked by the presence of apoint of interest, which helps the user in the navigation from top, and permits an intuitive passage between the two modes.
• An image-based encoding of the constraints for navigation. Each image channel contains the data needed for realistic interaction (i.e. height from ground, collision), without the
need of the presence of proxy 3D models or similar. More-over, the other channels of the image can encode also other information which can be used for the navigation (i.e. lo-cation or invisible hotspots). The image can be generated with a semi-automatic approach starting from the geometry, or by hand with the usual image processing tools.
The approach is especially suited to archeological environments made by one or more ”levels”, but it could be adapted to other en-vironments. It was tested on two cases: an entire insula in Pompei acquired with terrestrial laser scanners (where location informa-tion was used to integrate the 3D model with existing documen-tation, linked through a website) and a medieval village whose model was acquired with UAV. In both cases, a very intuitive nav-igation was obtained without the need of complex pre-processing operations.
2. RELATED WORK
Remote visualization of complex architectural environments deals with several general issues. The main ones are the integration of three-dimensional contents on the web, and the navigation of complex environments. While a comprehensive overview of all the related approaches goes well beyond the scope of the paper, we provide an overview of the state of the art in the following subsections.
2.1 3D and the Web
Some research effots were devoted to define a common data for-mat (Raggett, 1995, Don Brutzmann, 2007), but 3D scene visu-alization was still delegated to external software components. Only an initiative by the Khronos Group (Khronos Group, 2009a), the creation of WebGL standard (Khronos Group, 2009c), was able to generate a remarkable change. WebGL is a mapping of OpenGL|ES 2.0 specifications (Khronos Group, 2009b) in Java-Script. Direct access to the graphics hardware by the web browsers allows to fully exploit the potentials of rendering (Evans et al., 2014).
Following this standard, several actions were made to provide a sort of interface between the low-level OpenGL commands and the data visualization and navigation. We can see two different directions of research: the first one is more dedicated to a declar-ative approach, based on the concept of scenegraph. Two ex-amples of declarative programming solutions are X3DOM (Behr et al., 2009) and XML3D (Sons et al., 2010). In alternative to the declarative approach, several other actions went in the di-rection of an imperative approach, where a more direct inter-action is possible. Several libraries have been developed (most of them based on Javascript as a basic language), ranging from scene-graph-based interfaces, such as Scene.js (Kay, 2009) and GLGE (Brunt, 2010), to more programmer-friendly paradigms, such as SpiderGL (Di Benedetto et al., 2010), WebGLU (DeLillo, 2009), and Three.js (Dirksen, 2013). Several examples of integra-tion of 3D data on the web are appearing now. Among the prac-tical issues that have to be solved to provide usable tools, there are the necessity to integrate the models with other types of data (Jankowski and Decker, 2012, Callieri et al., 2013), but also the need for methods to handle the visualization of single complex objects (Behr et al., 2012, Callieri et al., 2013). The Smithsonian X3D explorer (http://3d.si.edu) is an alternative example where 3D models are associated to additional content, but the structure and flexibility of the proposed system are not known.
2.2 Camera control in Computer Graphics
The issue of 3D camera control is well known in the context of Computer Graphics. Please refer to the work of Christie (Christie et al., 2008) for a comprehensive overview.
The main solution developed to interactively observe and inspect a 3D model is the virtual trackball (Chen et al., 1988, Bell, 1988, Shoemake, 1992, Henriksen et al., 2004), that allows 3D rotations with just 2 Degrees of Freedom input devices, such as the mouse. This interaction works very well when the aim is to rotate around an object, but it tends to fail when the environment is more com-plex. For example, when the user needs to explore the inside of an object, or when its shape cannot be approximated to a sphere, this approach usually fails.
On the other side, a totally free navigation may be difficult to implement, and it could lead to alost-in-spaceeffect, where the user is not able to find the orientation in the context of a scene. Moreover, there are important object-related issues that should be taken into account (i.e. in an architectural environment, the user does not want go below the ground).
Solutions have been proposed to constrain and guide the trackball paradigm (Fitzmaurice et al., 2008, Hachet et al., 2008), but in the case of more complex environments (i.e. the architectural ones) other methods have been implemented. They could be based on a preliminary analysis of the scene to calculate pre-defined paths (Andujar et al., 2004), or constraining the camera with force-fields to avoid collisions (Wan et al., 2001, McCrae et al., 2009). Another possible solution is to select a set of possible points of view, and constrain the navigation to these points, which can be connected by the means of pre-computed paths (Hanson and Wernert, 1997). The choice of the points of view describing a complex environment is a very complex task (Scott et al., 2003),
and authoring is usually necessary (Burtnyk et al., 2002, Burtnyk et al., 2006).
Following this approach, image-based techniques have been used to remove limitations on scene complexity and rendering quality for interactive applications. Please refer to the recent work by Di Benedetto (Di Benedetto et al., 2014) and its bibliography for a comprehensive overview. Nevertheless, the aim of our work was to provide a solution supporting the free navigation of the model, trying to define implicit constrains and taking advantage of the strong points of different navigation paradigms.
3. EFFICIENT RENDERING
The first problem related to the visualization scheme was to ren-der effectively the complex 3D model representing the area of interest. As we stated in the introduction, we are focusing to-wards the visualization of complex 3D models of archeologi-cal/historical areas, created by sampling the real environment (by 3D scanning or 3D-from-photos). These models are not a ”sim-ple” terrain, that can be easily managed using 2.5D methods, or well known terrain-specific level-of-detail approaches, but re-quire a full 3D management. Additionally, we have to work with extremely complex 3D models, made of millions of triangles.
While not the main contribution of this work, it is nevertheless necessary to present the solution which we have used in order to stream these dataset over the net and render them inside a web browser.
3.1 WebGL and SpiderGL
Our visualization framework is based on WebGL (Khronos Group, 2009c), a component of HTML5. Thanks to this, the 3D con-tent works natively inside the browser, without the need of plug-ins on most modern browsers (Firefox, Chrome and Internet Ex-plorer) on all platforms. WebGL provides direct access to the GPU of the PC, enabling a programmer to write extremely op-timized low-level code, as one would do in standard software programming. However, since WebGL is very low-level, its di-rect use is not really common, and many developers use support libraries, able to provide higher level functionalities, data struc-tures and helper functions. To this aim, we decided to use Spi-derGL (Di Benedetto et al., 2010), a JavaScript support library oriented to Computer Graphics programming.
Using these components we built a simple, yet flexible frame-work for the creation of 3D presentation of high-res models on the web. Using a declarative-like approach, it is possible to de-fine a simple scene. The framework takes care of asynchronous data loading, event management, rendering and animation. All the components of the scene (3D models, trackball, camera) are configurable and extensible, making it possible to create simple visualization webpages with ease, but at the same time, when a more complex visualization is needed, it is possible to fully exploit the modular/configurable capabilities of the framework. This is what we have done in this work: by tweaking the behav-ior of the renderer and of the navigation/interaction components, we were able to create a specialized visualization webpage.
3.2 The Multiresolution engine
Displaying high resolution models on a web browser is not just a matter of optimizing the rendering speed, but it also involves considering the loading time and network traffic caused by trans-ferring a considerable amount of data over the network. Loading a high-resolution model as a whole through the web requires to transfer a single chunk of data in the order of tens, if not hun-dreds, of megabytes: this causes a lot of band usage, and the user has to wait for the transmission to end before seeing any visual result.
Multiresolution techniques provide the solution for both render-ing and data transfer. These schemes generally split the geometry in smaller chunks; for each chunk, multiple levels of detail are available. Transmission ison demand, requiring only to load and render the portions of the model strictly needed for the genera-tion of the current view. While this approach is key to be able to render very large models at an interactive frame rate, it is also helpful to optimize the data transfer over the network, since the geometry will be divided in small chunks and only transferred when needed. The model is immediately available for the user to browse it, even though at a low resolution, and it is constantly improving its appearance as new data are progressively loaded. On the other hand, since refinement is driven by view-dependent criteria (observer position, orientation and distance from the 3D model sections), only the data really needed for the required nav-igation are transferred to the remote user.
Figure 1: The multiresoluton Engine. On left: the patches used , smaller and more detailed near the camera, larger and at a lower-resolution farther away. Middle: when rendering, the geometry appear as a continous surface. On right: the multiresolution eas-ily manage the whole 27 million triangles model of the Pompeii Insula.
We implemented one of those multiresolution scheme, Nexus (Cignoni et al., 2005) (http://vcg.isti.cnr.it/nexus/), on top of the SpiderGL library (Di Benedetto et al., 2010), obtaining very good performances. In the two examples shown in this paper, we are dealing with high-resolution 3D models: the Pompeii insula is more than 27 millions triangles (Figure 1), while the San Sil-vestro Hill is around 22 millions (Figure 7). Both datasets are displayed at interactive rate, with almost immediate startup at the page loading, and the progressive refinement provides good visual results even on slower networks. This makes possible a quick, seamless exploration of the entire dataset, and supports instant jumping from one part of the area to another.
4. NAVIGATION
As we stated, navigation is the most important component of the visualization. Our aim was to implement a navigation simple to use, but able to fully explore mixed ground-buildings 3D dataset like the Pompeii insula or the San Silvestro Hill.
Instead of trying to implement a single all-purpose navigation method, which would result in an extremely complex interface, we decided to implement two different but complementary navi-gation methods: a ”bird’s eye” view, to explore the dataset from
above, and a ”first-person” view to explore the area in a more im-mersive way. In this way, each navigation mode is easier to use and more specialized but, by combining both navigation meth-ods, it is possible to fully explore the 3D dataset with greater flexibility.
Figure 2: The visualization webpage interface. On left: the 3D view, in bird’s eye view mode, with the current point of interest shown by the 3D locator. On top right: the current area and room name, tracked using the location channel of the map. On middle right: the minimap, graphically showing the current position. On bottom right: the current position of the user, expressed in this specific case as relative coordinates with respect to a local origin defined in a GIS tool
4.1 Bird’s eye mode
Bird’s eye view mode mimics flying above the environment or, with a more precise metaphore, looking from above at a maquette of the area. The user viewpoint hovers the area, looking down at specific details (see Figure 2).
This is, however, not a completely unbound navigation (like in the free-camera paradigm), but is similar to what is available in applications such as Google Earth. Basically, the camera al-ways refers to apoint of interest, located on the ground of the environment. The user may move this point, panning across the map, and change the camera orientation (vertical tilting, orbit-ing, and zooming). We did not consider the use of a completely free camera because it is really difficult to be controlled by non-experts (especially in a web browser environment), without pro-viding a significative increase of flexibility. Even considering its constrains, this navigation mode enables the user to easily reach every portion of the environment. This is especially true in the Pompeii dataset, but also in most of the archeological sites: since most of the roofs are missing, it is possible to see almost all of the walls and details of the structure.
Thepoint of interestis shown on the 3D view with a locator (a simple 3D model, visible in Figure 2); this helps the user in hav-ing a clear feedback on its position inside the area. The locator is nearly human-size, to better understand the scale of the area, and show at its base the cardinal points (the red arrow points towards north).
to cope with these irregularities. We will explain this point in Section 4.4.1. No collision is necessary in this navigation mode, since it would impose unnecessary constrains in user movement, making the navigation of the whole area more difficult.
Bird’s eye view is the starting navigation mode of the visualiza-tion webpage. The user may, at any time, switch to the first-person view (see next Section). While switching to first first-person view, location and orientation are preserved, i.e. the point of in-terest of the bird’s eye will become the location of the first-person camera, and the view direction of the bird’s eye will be the same of the one used by the first-person (see Figure 3). In this way, it is much easier to go back and forth between views, allowing for a seamless exploration of the dataset. The same correspondence will be preserved when switching back from first-person to bird’s eye.
Figure 3: Switching from bird’s eye to first-person preserves the user position and orientation, as it is visible in these images.
4.2 First person mode
Even if, in an environment like Pompeii, with most of the ceilings missing, the bird’s view is more or less sufficient to explore the entire map, it is sometimes useful/necessary to ”jump into” the 3D model, to explore the environment like it would be done in person.
The first-person view mode lets the user moves around the en-vironment at ground level (the camera is at a human-compatible height). Our implementation follows the same mechanism used in many similar tools: the first-person lets the user look in all di-rection (using the mouse) and move around on the ground (using the mouse or the WASD keys, generally used in videogames).
Similarly to the bird’s eye mode, also in the first-person mode it is necessary to follow the ground geometry when moving around. There is, however, an additional constrain often found in sim-ilar navigation modes: the collision with walls and other ge-ometries. Implementing these features for a first-person view is always complex, given the unstructured nature of the kind of 3D models we are using, generated from 3D scanning. In most videogames or interactive visualization, the 3D model used comes from manual modeling; it has a lower resolution and, more impor-tant, it is highly structured (walls and floors are explicitly marked, and often a collision mesh is also manually created). This helps a lot the navigation, but it is not easily obtainable when dealing with this kind of 3D models.
For the terrain-height following, we have used the method de-scribed in Section 4.4.1 , while in Section 4.4.2 we explain the method used for managing walls collision.
4.3 Minimap
In order to simplify the exploration, we also added a mini-map to the visualization page (see Figure 2). The minimap has two purposes: to give an immediate feedback on the current position,
thus avoiding users to ”get lost” while zooming or when in first-person view, but also to have a way to instantly jump to another position.
The position of the point of interest is shown using a crosshair drawn over the image, dynamically updated at every user move-ment. Conversely, when the user clicks on a point on the min-imap, the point of interest is instantly moved to that location. Both these actions exploit the fact that there is a perfect match of the area covered by the 3D dataset, the minimap and the one covered by the data map (see next section). Locations are passed between these three elements using relative coordinates (0.0-1.0), to gather independence from image resolution.
4.4 The ”Navigation Image” encoding
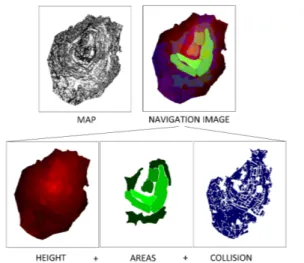
As we stated in the previous section, in order to provide a easy-to-use navigation, it is necessary to implement some mechanism able to follow the terrain height and to manage collisions. Addi-tionally, tracking the user position is another need often present in this kind of visualization. In all cases, it all boils down to knowing, for a given position in the dataset area, a specific infor-mation: which is the terrain height in this point? Is there a wall in this point, or is it free-ground? In which room/zone is this point?.
The idea is to have all these location-dependent information stored in a single, easy-to-access structure; knowing the location of the user (the point-of-interest for the bird’s eye, and the viewer po-sition in first-person), it is easy to retrieve the location-specific data, and have the visualization page react accordingly. We chose to store all the data in an image file, where each channel encodes a specific information. PNG format is used, given its lossless com-pression. An example of such image is shown in Figure 4. This ”Navigation Image” is read at the page loading; then, it is drawn on a hidden canvas and read back in memory in an array. At this point, the pixels are directly addressable by Javascript code. This structure is accessed using relative coordinates, thus ensuring in-dependency from the image resolution, and an easier mapping between coordinates.
4.4.1 Red channel - Terrain Height Most of the 3D datasets built using sampled data have a high-res non-flat terrain; mov-ing across this terrain requires then to alter the camera height to follow the geometry of the ground. This is generally obtained by creating a low-res collision ground, which is then tested as the user moves. Given that this lower-res collider is generally smooth, encoding its height in a map is not a problem, and makes much easier its use. The red channel of our map is used to store the base height of the terrain, i.e. a smoothed height-field rep-resenting the ground without the walls and other occluders. By using this map, the camera always follows the terrain when mov-ing in the bird’s eye and first-person view. The height map is smoothed to avoid useless camera shaking, and the walls and small colliders are not included, to have the camera follow the ”real” ground level. Its use is straightforward: every time the XY position of the user changes, its Z coordinate is modified accord-ing to the value encoded in this map.
user is in first-person view; every time the user XY position has to be updated, the map is checked: if the new XY position would cause a collision, the motion is culled at the wall, preventing the collision. Bird’s eye view does not use the collision map, since it may be useful for the user to place its point of interest anywhere in the map and, beside this, ignoring the walls and unsurmount-able terrain does allow a quicker exploration of the map. The collision map is, however, used in bird’s eye view when clicking on the minimap: if the user has asked do go in an ”impossible” position, its position is snapped to the closest ”safe” position. The same mechanism is used when the view mode is switched from bird’s eye to first-person: if the point of interest is currently in-side a wall, the user is moved to the closest open ground, to avoid having the user being trapped.
4.4.3 Green channel - Location A situation often occurring in this kind of datasets is the need to determine the exact location of the user, not just in terms of absolute XY coordinates on the map (which we already have), but in terms of areas, sub-areas, rooms, or any other semantical subdivision of the map. Again, this information is easily encoded in an image map. The green channel of our map is used to determine the position of the user point of interest. Each pixel simply stores the ID of the area; the 255 available values are enough to encode the areas for most datasets.
Every time the user position changes, the ID of the pixel under the user XY position is fetched and used to access a JSON (Java-Script Object Notation, an open standard for representing simple data) structure with all the information on the areas: a globally accessible variable is updated and a call-back function is called when the ID changes, in order for the webpage to react accord-ingly.
Figure 4: The visualization webpage interface. On left: the 3D view, currently in bird’s eye view mode, with the point of interest shown by the 3D locator. On top right: the current area and room name, tracked using the location channel of the map. On middle right: the minimap, graphically showing the current position. On bottom right: the current position of the user, expressed in this specific case as relative coordinates with respect to a local origin defined in a GIS tool
4.4.4 Other channels and encoding Since we are using PNG, it is possible to also have an Alpha channel; at the moment, it is not used. It may contain additional IDs of areas (if more than 255 areas have to be encoded); or could be used in conjunc-tion with the red height channel, to have more resoluconjunc-tion on the vertical axis, when dealing with a steeper terrain; or to encode any other location-based data. The assignment of the channels is completely arbitrary, and may be easily altered to cope with
spe-cific characteristics of the dataset. It is also possible, if running out of space, to add another image map, adding three/four more channels.
While there are other ways to encode the same type of informa-tion, this access strategy exploits already existing and highly op-timized mechanisms of the browser. Additionally, given the data contained in the channels, it behave very well when compressed. The most valid alternative would be to keep all this data in a vec-torial format; this would surely work, but with a limited impact on the size of the data (depending, for example, on how complex the geometry of the walls is), and, more importantly, it would require a much more complex authoring and editing.
Considering the Pompeii dataset, the PNG image used is only 500kb in size, for a 1142 x 980 resolution, with a physical size of each pixel around 10cm, more than enough to provide an accu-rate management for terrain height, walls collision and location tracking.
4.4.5 Authoring navigation images From the start, we wanted a method for managing the aforementioned features (ground height, wall collision, area detection) which was simple both when using it in realtimeandwhen creating the data needed for its use.
The height channel may be easily created from the 3D model: a simple color-coded (Z value to red value) orthographic rendering from above (or below) is enough to generate this channel. Then, to have a more continuous height, it is possible to smooth the ren-dered image, it is easier and have better results than starting from a smoothed geometry. We stated that it is better to not consider, in the height map, the walls and other non-terrain geometries. These areas may be manually found and eliminated in the 3D model or in the rendered image (and then smoothly filled). It is also pos-sible to use, on the 3D model, some heuristics to automatically select walls and similar geometries, and then cut them. This au-tomatic approach is viable and time saving; in the cases where the detection is not really accurate, a small manual intervention would help obtaining a good result in a shorter time, with respect to the completely manual approach.
The collision channel is slightly more complex. While it is an op-tion to manually mark all the walls and colliders using an image-editing software, this may be time consuming. The same heuris-tics mentioned for the height channel may also be applied to find the walls for the collision channel. Also in this case, the result of this automatic detection may be further refined with a limited manual intervention, resulting in a much cleaner result. This is the procedure used to generate the collision maps shown in Fig-ure 4 and FigFig-ure 5.
Both of these maps (height and collision), can also be created from GIS raster or vector data: this method is easy and time-effective, making it possible to exploit existing data.
Unfortunately, for most applications, the ”location” channel will necessarily should be created manually, since there is not a straight-forward way to automatically subdivide a 3D model in an archeological-sensible way. However, creating this image from an existing GIS vector/raster layer is a viable (and recommended) option.
and, on the other hand, from the current point of interest, go back to the existing website, directly accessing the section related to the current 3D location.
This is indeed possible, thanks to the parametric nature of the visualization page. In order to open the visualization page, the Query Stringmechanism can be used. It is possible to specify completely the position and view parameters; for example, the following url query string opens the visualization with the point of interest located at 36.0 meters East, 12.6 meters North, with camera looking at 45 degree with respect to north direction, 60 degree azimuthal angle, zoom level 2.0:
http://aaa.com/pompeii3D.html?StartNS =36.0&StartEW=12.6&StartPhi=45.0&
StartTheta=60.0&StartZoom=2.0
It is also possible to ask the webpage to go to one of the ”ar-eas” or ”rooms” defined in the JSON structure mentioned in sec-tion 4.4.3. This structure contains a list of areas/subareas, each one with an associated ID, name, description, and URL (see next paragraph) and parameters for setting point of interest and view direction to frame it. By passing the name of the desired area to the URL of the 3D visualization webpage, the page will open by framing the desired area, fetching the appropriate parameters in this JSON structure. The following url query string opens the visualization with the point of interest location and camera ori-entation stored in the JSON entry for the ”house of Torello di Bronzo”:
http://aaa.com/pompeii3D.html? StartRoom=1.7_house_torello
Going in the other direction is also easy. Since at all times, the webpage knows where the user point of interest is located, in ab-solute coordinates or at area/room level (thanks to the location map), it is possible to open back the existing website at the de-sired section. This can be implemented by using the same JSON structure just mentioned: the URL stored in each area/room is used for this specific purpose.
5. RESULTS
The proposed rendering and navigation method was applied on two real datasets, in order to test the usability and the possible uses of the image map encoding. The first one represented a nearly planar but slightly sloped, complex architectural structure, while the second one represented a less planar, irregularly urban-ized medieval borough on top of an hill.
5.1 The Pompei Insula V.1
The first test case was the model of the Insula V.1 of Pompei. This wide area (1330 square meters), was acquired in the context of a project coordinated by the Swedish Archeological School (Dell Unto et al., 2013) using phase shift laser scanners. The acquisition campaigns and the subsequent processing generated several complete models of the insula at different resolutions. The model (which was composed by 27M triangles, with a res-olution of around 3cm) was also referenced w.r.t. the reference system of the archeologists.
The original map of the insula was used as the minimap, while
the height and collision were created in a semi-automatic fash-ion. The walls were removed from the 3D model, using an auto-matic selection function of MeshLab, and the collision map was obtained by producing a snapshot of a blue colored model from the same point of view as the minimap (see Figure 5,right).
The height map was obtained through filling the missing
por-Figure 5: The height and collision maps for the Pompei example
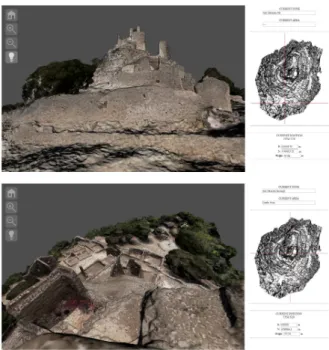
tions of the geometry via Poisson reconstruction, and encoding the height from the ground in the red channel using a per-vertex color function of MeshLab tool (see Figure 5,left). Some exam-ples of the navigation of the Pompei dataset are shown in Figures 2 and 3. In this case, the green channel of the image map was used to link the 3D model to an already existing website that con-tained the documentation (text and images) for each single room of the Insula. By encoding in the green channel the Id of each room, it was possible to access directly from the navigation con-text the corresponding page on the Pompei Project website. Figure 6 shows an example of the link between the position of the focus point and the corresponding data sheet on the website. A possible future extension of this system would be a perfect inte-gration with the website, where the user could jump in and out of the two websites in an integrated fashion.
Figure 6: Linking the navigation with a data sheets website.
5.2 San Silvestro village
The model of the village can be extremely valuable for several aspects, and the possibility to freely navigate a three-dimensional model gives the chance to overcome its peculiar placement on top of an hill. The final 3D model (with color) was made of 22M tri-angles, with a resolution of nearly one point every 5 cm. As in the previous example, the model was scaled to real mea-sures, and geo-referenced using the documentation provided by the park authorities. Then, it was processed to be used with multi-resolution visualization. The mini map (see Figure 4,top-left) for navigation was obtained through a non photo-realistic rendering of the model from top. The complete image map can be seen in Figure 4 with all the channels encoded: the height on the red channel, the location on the green one, and the collision in the blue one.
The height channel was obtained in an automatic fashion by
Figure 7: Two snapshots of bird’s eye navigation of San Silvestro model
encoding the color w.r.t. the height from the ground using a per-vertex color function of MeshLab tool, and generating a snapshot from the top view. The collision channel was obtained in a semi automatic fashion, by first removing the vertical walls from the geometry, and then modifying by hand the blue colored remain-ing geometry. In this case, the collision surface was less easy to define, due to the presence in the model of architectural remains, rock and vegetation. The location channel was easily produced by hand starting from the minimap. It defines the different (i.e. residential, industrial, church) areas of the village.
Figure 7 shows two points of view that can be reached using the bird’s eye modality: it’s easy to get a view from the top, but also to explore portions of the village. On the top right of each snapshot, the peculiar area associated to the focus point is shown. Moreover, the UTC coordinates are available (bottom right).
Figure 8 shows two points of view that can be reached with first person navigation: one that can re-create a real visit (the one from the ground), the other providing a point of view not available to visitors (it is currently not possible to climb on top of the tower). The test on this model shows that it is possible to prepare a dataset where the ground is not planar, with only a minimal intervention in the creation of the image maps, and providing an extremely flexible yet intuitive navigation.
Figure 8: Two snapshot of first person navigation of San Silvestro model. Top: on top of the tower. Bottom: from the industrial area outside the village.
6. CONCLUSIONS AND FUTURE WORK
This paper presented a solution for the navigation of 3D envi-ronments on which the usual trackball paradigm for navigation cannot be applied. The system integrates two different visualiza-tion modalities (linked by the concept of ”point of interest”), that could account for different needs in the exploration of a complex architecture.
Moreover, the important information needed to ensure a realistic experience are stored in a image map, that could be used also to store additional information (i.e. the location of the current point of interest). The image map can be produced with a limited effort by the user, and it’s easily integrated in the navigation environ-ment.
The main limitations of the current approach are: the need for data that are not organized on different levels (although the nav-igation could ”switch” from one layer to another when needed), the use of bird’s eye view when the model has roofs (although this could be overcome by using ad-hoc visualization, like x-ray-like shaders), and the necessity to produce the image map ”by hand” (although the procedure is quite straightforward and could be au-tomatized, for example using a MeshLab script).
Nevertheless, the system could be directly applied to a number of possible test cases in the field of Cultural Heritage, from arche-ological excavation to city navigation, or even for the exploration of artifacts with small detail (like engraving or small decorations). Regarding future improvements of the system, three possible di-rections of work can be outlined: the implementation of simple interaction functionalities (measurement, sections, simple anno-tation), the creation of authoring tools to help in preparing new scenes, and a better integration with existing web visualization systems.
ACKNOWLEDGEMENTS
Scuola Archeologica Svedese, and Andrea Berton, for their sup-port.
REFERENCES
ACT, n.d. Microsoft ActiveX Controls.
http://msdn.microsoft.com/en-us/library/aa751968(VS.85).aspx.
Andujar, C., Vazquez, P. and Fairen, M., 2004. Way-finder: guided tours through complex walkthrough models. Computer Graphics Forum 23(3), pp. 499–508.
Behr, J., Eschler, P., Jung, Y. and Z¨ollner, M., 2009. X3dom: a dom-based html5/x3d integration model. In: Proceedings of the 14th International Conference on 3D Web Technology, Web3D ’09, ACM, New York, NY, USA, pp. 127–135.
Behr, J., Jung, Y., Franke, T. and Sturm, T., 2012. Using images and explicit binary container for efficient and incremental deliv-ery of declarative 3d scenes on the web. In: Proceedings of the 17th International Conference on 3D Web Technology, Web3D ’12, ACM, New York, NY, USA, pp. 17–25.
Bell, G., 1988. Bell’s trackball. Written as part of the “flip” demo to demonstrate the Silicon Graphics (now SGI) hardware.
Brunt, P., 2010. GLGE: WebGL for the lazy. http://www.glge.org/.
Burtnyk, N., Khan, A., Fitzmaurice, G. and Kurtenbach, G., 2006. Showmotion: camera motion based 3d design review. Pro-ceedings of the 2006 symposium on Interactive 3D graphics and games pp. 167–174.
Burtnyk, N., Khan, A., Fitzmaurice, G., Balakrishnan, R. and Kurtenbach, G., 2002. StyleCam: Interactive Stylized 3D Navi-gation using Integrated Spatial & Temporal Controls. Vol. 4Num-ber 2, ACM, pp. 101–110.
Callieri, M., Leoni, C., Dellepiane, M. and Scopigno, R., 2013. Artworks narrating a story: a modular framework for the inte-grated presentation of three-dimensional and textual contents. In: Web3D, 18th International Conference on 3D Web Technology.
Chen, M., Mountford, S. J. and Sellen, A., 1988. A study in in-teractive 3-d rotation using 2-d control devices. In: Proceedings of the 15th annual conference on Computer graphics and inter-active techniques, SIGGRAPH ’88, ACM, New York, NY, USA, pp. 121–129.
Christie, M., Olivier, P. and Normand, J.-M., 2008. Camera control in computer graphics. Computer Graphics Forum 27(8), pp. 2197–2218.
Cignoni, P., Ganovelli, F., Gobbetti, E., Marton, F., Ponchio, F. and Scopigno, R., 2005. Batched multi triangulation. In: Proceedings IEEE Visualization, IEEE Computer Society Press, Conference held in Minneapolis, MI, USA, pp. 207–214.
DeLillo, B., 2009. WebGLU: A utility library for working with WebGL . http://webglu.sourceforge.org/.
Dell Unto, N., Ferdani, D., Leander, A.-M., Dellepiane, M., Cal-lieri, M. and Lindgren, S., 2013. Digital reconstruction and visu-alization in archaeology case-study drawn from the work of the swedish pompeii project. In: Digital Heritage 2013 International Conference, IEEE, pp. 621–628.
Di Benedetto, M., Ganovelli, F., balsa Rodriguez, m., Jaspe Vil-lanueva, A., Gobbetti, E. and Scopigno, R., 2014. exploremaps: Efficient construction and ubiquitous exploration of panoramic view graphcs of complex 3d environments. In: Computer Graph-ics Forum, 33(2), 2014. Proc. EurographGraph-ics 2014, To appear.
Di Benedetto, M., Ponchio, F., Ganovelli, F. and Scopigno, R., 2010. Spidergl: a javascript 3d graphics library for next-generation www. In: Proceedings of the 15th International Con-ference on Web 3D Technology, Web3D ’10, ACM, New York, NY, USA, pp. 165–174.
Dirksen, J. (ed.), 2013. Learning Three.js: The JavaScript 3D Library for WebGL. Packt Publishing.
Don Brutzmann, L. D., 2007. X3D: Extensible 3D Graphics for Web Authors. Morgan Kaufmann.
Evans, A., Romeo, M., Bahrehmand, A., Agenjo, J. and Blat, J., 2014. 3d graphics on the web: A survey. Computers & Graphics 41(0), pp. 43 – 61.
Fitzmaurice, G., Matejka, J., Mordatch, I., Khan, A. and Kurten-bach, G., 2008. Safe 3d navigation. In: Proceedings of the 2008 symposium on Interactive 3D graphics and games, I3D ’08, ACM, New York, NY, USA, pp. 7–15.
Hachet, M., Decle, F., Knodel, S. and Guitton, P., 2008. Navid-get for easy 3d camera positioning from 2d inputs. In: 3D User Interfaces, 2008. 3DUI 2008. IEEE Symposium on, pp. 83 –89.
Hanson, A. J. and Wernert, E. A., 1997. Constrained 3d navi-gation with 2d controllers. In: Proceedings of the 8th conference on Visualization ’97, VIS ’97, IEEE Computer Society Press, Los Alamitos, CA, USA, pp. 175–ff.
Henriksen, K., Sporring, J. and Hornbæk, K., 2004. Virtual track-balls revisited. IEEE Transactions on Visualization and Computer Graphics 10(2), pp. 206–216.
Jankowski, J. and Decker, S., 2012. A dual-mode user interface for accessing 3d content on the world wide web. In: Proceedings of the 21st international conference on World Wide Web, WWW ’12, ACM, New York, NY, USA, pp. 1047–1056.
Kay, L., 2009. SceneJS. http://www.scenejs.com.
Khronos Group, 2009a. Khronos: Open Standards for Media Authoring and Acceleration.
Khronos Group, 2009b. OpenGL ES - The Standard for Embed-ded Accelerated 3D Graphics.
Khronos Group, 2009c. WebGL - OpenGL ES 2.0 for the Web.
McCrae, J., Mordatch, I., Glueck, M. and Khan, A., 2009. Mul-tiscale 3d navigation. In: Proceedings of the 2009 symposium on Interactive 3D graphics and games, I3D ’09, ACM, New York, NY, USA, pp. 7–14.
Raggett, D., 1995. Extending WWW to support platform inde-pendent virtual reality. Technical Report.
Scott, W. R., Roth, G. and Rivest, J.-F., 2003. View planning for automated three-dimensional object reconstruction and inspec-tion. ACM Comput. Surv. 35(1), pp. 64–96.
Shoemake, K., 1992. Arcball: a user interface for specifying three-dimensional orientation using a mouse. In: Proceedings of the conference on Graphics interface ’92, Morgan Kaufmann Publishers Inc., San Francisco, CA, USA, pp. 151–156.
Sons, K., Klein, F., Rubinstein, D., Byelozyorov, S. and Slusallek, P., 2010. Xml3d: Interactive 3d graphics for the web. In: Proceedings of the 15th International Conference on Web 3D Technology, Web3D ’10, ACM, New York, NY, USA, pp. 175– 184.