Submitted 19 August 2015 Accepted 6 November 2015 Published10 December 2015
Corresponding author
Yosi Wibowo,
yosi.wibowo@postgrad.curtin.edu.au
Academic editor
Bob Patton
Additional Information and Declarations can be found on page 15
DOI10.7717/peerj.1449
Copyright
2015 Wibowo et al.
Distributed under
Creative Commons CC-BY 4.0
OPEN ACCESS
An evaluation of community
pharmacy-based services for type 2
diabetes in an Indonesian setting: patient
survey
Yosi Wibowo1,2, Richard Parsons2, Bruce Sunderland2and
Jeffery Hughes2
1Centre for Medicines Information and Pharmaceutical Care (CMIPC), Faculty of Pharmacy, University of Surabaya, Surabaya, East Java, Indonesia
2School of Pharmacy, Faculty of Health Sciences, Curtin University, Perth, Western Australia, Australia
ABSTRACT
Background.Diabetes is an emerging chronic disease in developing countries. Its management in developing countries is mainly hospital/clinic based. The increasing diabetes burden in developing countries provides opportunities for community pharmacists to deliver a range of services. Since the management of diabetes requires the patient’s own involvement, it is important to gain their views in order to develop pharmacy-based diabetes services. Studies on diabetes patients’ views have been limited to developed countries.
Objectives.To investigate, within a developing country setting (Indonesia), current use of pharmacy services by type 2 diabetes patients, and to evaluate their views regarding community pharmacists’ roles, and the characteristics that influence their views.
Methods.A questionnaire survey was conducted within 10 purposefully selected community pharmacies in Surabaya, Indonesia. Each pharmacy recruited approximately 20 patients seeking antidiabetic medications. Usage of pharmacy services was identified using binary responses (‘yes’/‘no’) and views on pharmacists’ roles were rated using Likert scales; an open-ended question was used to identify patient perceived priority roles. Logistic regression models were used to determine characteristics associated with patients’ views.
Results.A total of 196 pharmacy patients with type 2 diabetes responded (58.3% response rate). Most patients used community pharmacies for dispensing (100%) and education on how to use medications (79.6%). There were mixed views towards pharmacists providing services beyond dispensing. The highest priorities identified were from the ‘patient education’ domain: education on medications (i.e., directions for use (64.5%), storage (26.6%), common/important adverse effects (25.5%)); and the ‘monitoring’ domain: monitoring medication compliance (37.3%). Patients with higher incomes or who were working were less supportive of these expanded services, whereas patients who previously used a service, those with risk factors for complications or having poor/unknown glycaemic control were more supportive.
pharmacies report limited monitoring of blood glucose levels and poor glycaemic control, which indicates an opportunity for greater pharmacist involvement. Yet for this to occur, patients’ limited expectations of pharmacists roles will need to be broadened. Characteristics influencing these views should inform the development of pharmacy-based diabetes services in the environment of the burgeoning burden of diabetes.
Subjects Diabetes and Endocrinology, Evidence Based Medicine, Health Policy
Keywords Pharmacy services, Indonesia, Community pharmacy, Diabetes, Patient views
INTRODUCTION
Indonesia is a major developing country with a population of 237.6 million (International Diabetes Federation , 2013), and is among the top 10 countries in the world according to the number of people with diabetes (Fowler, 2008). In 2013, it was estimated that 8.5 million people in Indonesia were living with diabetes, and this number is expected to increase to 14.1 million by 2035 (Fowler, 2008). Diabetes in Indonesia is currently managed in hospital outpatient or clinic settings (Soewondo et al., 2010;Soewondo, Ferrario & Tahapary, 2013). An increased number of people with diabetes will require more community-based care, providing an opportunity for community pharmacists to deliver a range of diabetes services. While the 2012 Indonesia Health Profile reported a total of 17,613 pharmacies (mainly community-based) (Kementrian Kesehatan Republik Indonesia, 2013), Indonesian community pharmacies currently have limited roles within Government insurance plans, providing services mainly to the private sector (Wang et al., 2009).
To increase the uptake of pharmacy-based services amongst diabetes patients in Indone-sia, it is important to understand the perspectives of diabetes patients on pharmacy-based services that would assist with their care. This is especially so since diabetes is a chronic disease that requires daily care in the hands of patients (Abduelkarem et al., 2003a). Several studies have been conducted to investigate diabetes patient views regarding aspects of community pharmacists’ roles; however, these have thus far been limited to developed countries, such as the UK and the USA (Abduelkarem et al., 2003a;Weitzman et al., 2009; Brown & Green, 2000;Hermansen-Kobulnicky & Worley, 2008;Twigg et al., 2013). Two previous small studies conducted in community pharmacies in Indonesia, although not specific to diabetes patients, have found that general patients had positive perceptions of pharmacy services, providing facilitation for pharmacists to develop their professional roles (Handayani & Raharni, Gitawati, 2009;Abdullah, Andrajati & Supardi, 2010). This present study aimed to investigate, within an Indonesian setting, the current use of community pharmacy services by patients with type 2 diabetes, and to evaluate their views on the potential roles of community pharmacists, and the characteristics that influence their views. The results of the study should inform the Government, professional bodies, and practitioners on the development of pharmacy-based diabetes services in a developing country setting (Indonesia).
METHODS
This study was approved by the Human Research Ethics Committee of Curtin University (PH-09-11) andIkatan Apoteker Indonesia—IAI (Indonesian Pharmacists Association) (001/SK/BPD-IAI/SURABAYA/2010).
Setting and sample recruitment
The aims of the study included the estimation of the prevalence of service usage and patient views. A sample size of 200 was defined which if broadly representative of the population of pharmacy patients with type 2 diabetes in Surabaya, the 95% confidence intervals for the true prevalence estimates would be within 7% of the figures obtained from the sample (based on a prevalence estimate of 50%). For the analysis of characteristics associated with respondents’ views, a sample of 200 would be expected to be adequate to identify any independent variables exhibiting a moderate to small effect size (with power=80%,
α=0.05) (Tabachnick & LS Fidell, 2007).
with a diagnosis of type 2 diabetes for which they were receiving oral antidiabetic medications. Patients were recruited as they were seeking oral antidiabetic medications at these pharmacies, and their written consent was obtained.
Data collection
Questionnaire development
The survey questionnaire consisted of four sections: (A) patient demographics, (B) services for type 2 diabetes patients—use of services and views on pharmacists’ roles, (C) diabetes profile, and (D) monitoring profile. The questionnaire cover page contained information about the study and a consent form. Section B of the questionnaire contained a list of services for type 2 diabetes patients that was drafted based on a generic model generated from the literature (Perkumpulan Endokrinologi Indonesia, 2011;Power et al., 2006;Diabetes Australia, 2012;American Diabetes Association, 2013;Department of Health Western Australia, 2008). A binary choice question was used to capture patient usage of each service (‘yes’/’no’), and a 6-point Likert scale was used to reflect patient views on pharmacists’ roles (1=definitely no, 6=definitely yes). This was followed by an open-ended question to explore patient priorities regarding their views of pharmacist roles:‘In your opinion, what are the five most important services that should be provided at pharmacies to assist you with your diabetes?’The questionnaire was face and content validated by a panel of seven academics, two board members of the IAI, two Indonesian community pharmacists and two diabetes patients. Their feedback, where appropriate, was incorporated into the questionnaire.
The questionnaire (English version) then went through a translation process to an Indonesian version: (i) forward translation to Bahasa Indonesia by one of the investi-gators whose first language is Bahasa Indonesia; (ii) back-translation to English by an independent English first-language translator; and (iii) the back-translation was compared to the original version by two of the investigators whose first language was English. The forward-translation questionnaire was piloted by 10 type 2 diabetes patients. This resulted in minor changes to the final questionnaire. To assess reliability, the questionnaire was distributed on two occasions separated by a two-week interval. Responses to the Likert scales were grouped (ratings of 1–4, and ratings of 5–6) to ensure that Kappa was able to be calculated; the resulting Kappa scores for diabetes services (Section B) ranged from 0.412 to 1.000, which were classified as ‘acceptable’ to ‘excellent’ levels of test–retest reliability (Landis & Koch, 1977).
Questionnaire administration
Table 1 Patient recruitment data from 10 community pharmacies.
Pharmacy code Geographical area Socio-economic level Average number
of diabetes patients per month
Number of questionnaires distributed
Number of useable questionnaires returned
Pharmacy 1 East Surabaya 2 150 40 21
Pharmacy 2 Central Surabaya 1 200 28 18
Pharmacy 3 East Surabaya 3 70 35 20
Pharmacy 4 West Surabaya 4 100 32 19
Pharmacy 5 South Surabaya 3 140 37 20
Pharmacy 6 Central Surabaya 2 100 30 20
Pharmacy 7 South Surabaya 4 100 36 20
Pharmacy 8 North Surabaya 1 240 31 19
Pharmacy 9 West Surabaya 3 120 40 20
Pharmacy 10 North Surabaya 2 100 27 19
Total 336 196
the questionnaire was placed in a sealed envelope by the respondent and submitted to the pharmacist/pharmacy staff. The completed questionnaires as well as the remaining unused questionnaires were then handed to the investigators by the agreed deadline.
Data analysis
Descriptive statistics were used to summarise the patient characteristics: demographics (Section A), diabetes profile (Section C), and monitoring profile (Section D). SPSS version 19.0 was used to perform the analysis.
In relation to diabetes services (Section B), frequencies were calculated for binary responses (‘yes’/’no’) related to the patient usage of services and for responses from Likert scales related to the extent of patient agreement regarding pharmacists’ roles. Moreover, content analysis was used for responses from the open-ended question to explore patient views on the five priority services that should be provided at the pharmacies. An initial coding frame structure was established from the generic model generated from the literature. The responses were coded (if new codes emerged, they were added to the thematic codes in the coding frame), and frequencies were calculated for each code (Rose, Spinks & Canhoto, 2015).
for an overarching or ‘composite’ role, the arithmetic average of the Likert responses for the component roles was calculated and then converted to a binary variable in a manner similar to that used for the individual roles (scores of 5 or more were taken to indicate strong support, otherwise ambivalence or low support). Taking the simple average of the component roles implicitly gives equal weight to each of the roles within a composite. It would have been preferable to use Factor Analysis to identify if some of the component roles were more important than others, but the sample size was considered too small for this refinement. It is generally recommended that sample sizes of 300 or more should be used to obtain stable factor loadings (Tabachnick & LS Fidell, 2007). Patient characteristics included as independent variables were gender, age, education, employment, income, health insurance cover, diabetes organisation membership, duration of diabetes (time since diagnosis), risk factors for complications, complications and diabetes (glycaemic) control. The models also included an independent variable indicating patients’ previous use of the service (binary responses: ‘yes’/’no’). For dependent variables which were ‘composite’ (for example ‘medication education’), the binary responses indicating previous use of each component service were treated as numeric (zero for ‘No’, one for ‘Yes’), and their mean was calculated and used in the model as an independent variable to show the degree of previous use of the composite service. A mean value close to 1 indicated that most components of the composite role had been used, while a lower value indicated less use. A backward elimination strategy was used to identify all the variables which significantly contributed to each model. Through this approach all independent variables were included initially, and then the least significant variable was dropped (one at a time) until the
p-value associated with each of the variables remaining in the model was less than 0.05.
RESULTS
Sample recruitment
This study included 10 community pharmacies as sampling points after approaching 11 community pharmacies in Surabaya. One pharmacy refused, as the employee pharmacist was planning to resign and they were in the process of recruiting a new one. From the final 10 pharmacies, a total of 336 questionnaires were distributed and 204 were returned; however, eight patients reported the use of insulin at the beginning of their therapies and were deemed to have type 1 diabetes, leaving a sample size of 196 (a response rate of 58.3%) (Table 1).
Characteristics of pharmacy patients with type 2 diabetes
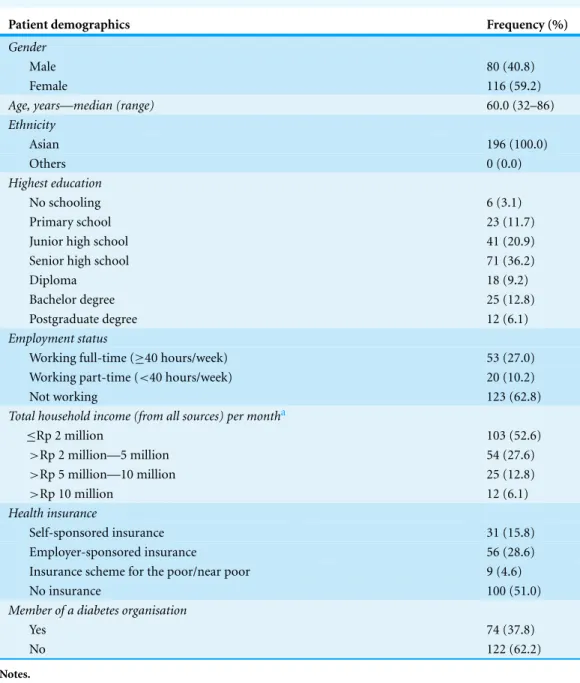
The demographic information of participating patients (Section A) is summarised in
Table 2. Approximately 60% of respondents were female and half of respondents were aged 60 years or older. Approximately half of the respondents did not have health insurance plans.
Table 2 Demographic data of patient respondents (N=196).
Patient demographics Frequency (%)
Gender
Male 80 (40.8)
Female 116 (59.2)
Age, years—median (range) 60.0 (32–86)
Ethnicity
Asian 196 (100.0)
Others 0 (0.0)
Highest education
No schooling 6 (3.1)
Primary school 23 (11.7)
Junior high school 41 (20.9)
Senior high school 71 (36.2)
Diploma 18 (9.2)
Bachelor degree 25 (12.8)
Postgraduate degree 12 (6.1)
Employment status
Working full-time (≥40 hours/week) 53 (27.0)
Working part-time (<40 hours/week) 20 (10.2)
Not working 123 (62.8)
Total household income (from all sources) per montha
≤Rp 2 million 103 (52.6)
>Rp 2 million—5 million 54 (27.6)
>Rp 5 million—10 million 25 (12.8)
>Rp 10 million 12 (6.1)
Health insurance
Self-sponsored insurance 31 (15.8)
Employer-sponsored insurance 56 (28.6)
Insurance scheme for the poor/near poor 9 (4.6)
No insurance 100 (51.0)
Member of a diabetes organisation
Yes 74 (37.8)
No 122 (62.2)
Notes.
Abbreviations:Rp, Indonesian rupiah.
a2 missing responses.
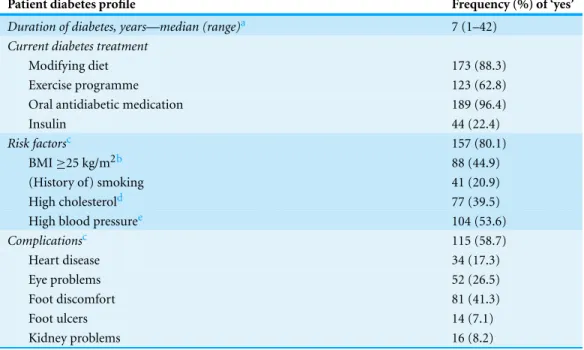
and diet modifications. It is important to note that this variable did not measure whether the doctor made the medication/diet/exercise recommendations, but rather whether the patient remembered and/or reported it. Almost 60% of the respondents reported having at least one diabetes-related complication, and most of the patients reported having at least one risk factor for complications.
Table 3 Self-reported diabetes and health profile of patient respondents (N=196).
Patient diabetes profile Frequency (%) of ‘yes’
Duration of diabetes, years—median (range)a 7 (1–42)
Current diabetes treatment
Modifying diet 173 (88.3)
Exercise programme 123 (62.8)
Oral antidiabetic medication 189 (96.4)
Insulin 44 (22.4)
Risk factorsc 157 (80.1)
BMI≥25 kg/m2b 88 (44.9)
(History of) smoking 41 (20.9)
High cholesterold 77 (39.5)
High blood pressuree 104 (53.6)
Complicationsc 115 (58.7)
Heart disease 34 (17.3)
Eye problems 52 (26.5)
Foot discomfort 81 (41.3)
Foot ulcers 14 (7.1)
Kidney problems 16 (8.2)
Notes.
aSome missing responses.
bBMI, body mass index = weight (kg) divided by height2(m2); some missing responses. cRespondents responded ‘yes’ for at least one complication/risk factor.
dRespondents responded ‘yes’, either for“Do you have high cholesterol?” or “Do you take medications to treat your high
cholesterol?”, or for both.
eRespondents responded ‘yes’, either for“Do you have high blood pressure?” or “Do you take medications to treat your high
blood pressure?”,or for both.
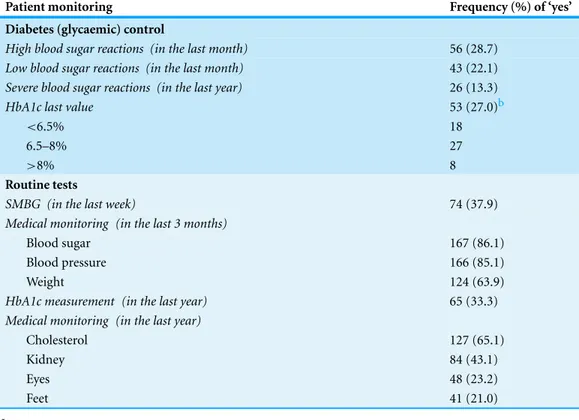
(glycaemic) control, variables related to the symptoms of hypo/hyperglycaemia and HbA1c values were combined to indicate: fair-good control (i.e., no symptoms and HbA1c ≤8.0%); poor control (i.e., presence of symptoms and/or HbA1c>8.0%); and unknown (i.e., symptoms ‘none/don’t know’ and/or HbA1c values ‘none/don’t know’). Using this derived variable, most respondents were perceived to have either poor diabetes control (45.9%) or unknown diabetes control (42.3%).
Patients’ use of pharmacy services and their views on pharmacist roles
Responses describing patient usage of pharmacy services are summarised inTable 5. In addition to the traditional role of dispensing (‘treatment administration’), the most frequent services received were ‘patient education’ about medications, particularly directions for use (79.6%) and special precautions to follow (71.9%).
Table 4 Self-reported monitoring profile of patient respondents (N=195).a
Patient monitoring Frequency (%) of ‘yes’
Diabetes (glycaemic) control
High blood sugar reactions (in the last month) 56 (28.7)
Low blood sugar reactions (in the last month) 43 (22.1)
Severe blood sugar reactions (in the last year) 26 (13.3)
HbA1c last value 53 (27.0)b
<6.5% 18
6.5–8% 27
>8% 8
Routine tests
SMBG (in the last week) 74 (37.9)
Medical monitoring (in the last 3 months)
Blood sugar 167 (86.1)
Blood pressure 166 (85.1)
Weight 124 (63.9)
HbA1c measurement (in the last year) 65 (33.3)
Medical monitoring (in the last year)
Cholesterol 127 (65.1)
Kidney 84 (43.1)
Eyes 48 (23.2)
Feet 41 (21.0)
Notes.
Abbreviations::SMBG, self-monitoring of blood glucose; HbA1c, glycosylated haemoglobin.
a1 missing response.
bNumber of respondents reported their HbA1c last value.
medication storage and adverse effects, SMBG, prevention of complications, need for regular monitoring, and foot care. In addition, patients expected pharmacists to provide more monitoring services than those currently provided.
In terms of the priority roles of pharmacists, patients’ responses can be seen inTable 6. The top five services perceived by patients as priorities (in addition to pharmacists’ traditional roles of dispensing being already provided) were from the ‘patient edu-cation’ domain—education related to medications (i.e., directions for use (64.5%), common/important adverse effects (25.5%), storage requirements (26.6%)) and the ‘monitoring’ domain—monitoring compliance with medications (37.3%). No new ser-vices were raised, beyond those already listed in the questionnaire, from this open-ended question, suggesting that from the respondents’ perspective the range of services that should be provided by community pharmacies described inTable 5was complete.
Characteristics associated with patients’ views on pharmacist roles
Table 5 Patients’ use of community pharmacy services and their views on pharmacists’ roles (N=
196).
Services Being used
N(%)
Being viewed as
pharmacist rolesa
N(%)
Treatment administration
Prepare medications 196 (100) 195 (100)
Provide labels with instructions for use 196 (100) 195 (100) Patient education
Disease process 93 (47.4) 120 (61.5)
Treatment targets 79 (40.3) 115 (59.0)
Antidiabetic medications:
Directions for use 156 (79.6) 160 (82.1)
Use of insulin devicesb 27 (61.4) 142 (72.7)
Storage requirements 93 (47.4) 144 (73.9)
Special precautions to follow 141 (71.9) 155 (79.5)
Common/important adverse effects 87 (44.4) 139 (71.3)
Exercise 66 (33.7) 96 (49.2)
Diet 84 (42.9) 101 (51.8)
SMBG 63 (32.1) 107 (54.9)
Prevention/treatment of acute complications 67 (34.2) 126 (64.6) Prevention/treatment of chronic complications 45 (23.0) 116 (59.5)
Need for regular medical monitoring 48 (24.5) 97 (49.8)
Foot self-care 35 (17.9) 95 (48.7)
Smoking cessationc 12 (29.3) 72 (36.7)
Monitoring
Monitor compliance with:
Antidiabetic medications 100 (51.0) 127 (65.1)
Exercise plan 62 (31.6) 102 (52.3)
Diet plan 78 (39.8) 109 (55.9)
Plan for prevention/treatment of chronic complications
44 (22.4) 92 (47.2)
Scheduled medical monitoring 38 (19.4) 96 (49.3)
Monitor treatment outcomes:
Check records on SMBG 58 (29.6) 101 (51.8)
Carry out blood glucose tests 58 (29.6) 113 (58.0)
Measure BMI 40 (20.4) 89 (45.6)
Measure blood pressure 55 (28.1) 103 (52.8)
Check results on patient laboratory tests 51 (26.0) 98 (50.3)
Monitor for adverse effects 63 (32.1) 110 (56.4)
Review
Refer patients if necessary 69 (35.2) 110 (56.5)
Notes.
Abbreviations:SMBG, self-monitoring of blood glucose; BMI, body mass index.
a1 missing response.
bThe percentage was calculated for patients currently/previously taking insulin (N=44).
Table 6 Patients’ open-ended views on priority roles of pharmacists in diabetes care(N=169).a
Priority servicesb Number of responses (%)
Treatment administration
Prepare medications 35 (20.7)
Provide labels with instructions for use 66 (39.1)
Patient education
Disease process 27 (16.0)
Antidiabetic medications:
Directions for use 109 (64.5)
Use of insulin devices 15 (8.9)
Storage requirements 45 (26.6)
Special precautions to follow 37 (18.9)
Common/important adverse effects 50 (25.5)
Exercise 27 (13.8)
Diet 33 (16.8)
Prevention/treatment of acute complications 27 (16.0)
Prevention/treatment of chronic complications 20 (11.8)
Monitoring
Monitor compliance with:
Antidiabetic medications 63 (37.3)
Monitor treatment outcomes:
Carry out blood glucose tests 30 (17.8)
Measure blood pressure 25 (14.8)
Monitor for adverse effects 23 (13.6)
Others (not a specific service)
Provide a complete range of medications 12 (7.1)
Information about medications 16 (9.5)
Notes.
Responses to an open-ended question:“In your opinion, what are the five most important services that should be provided at pharmacies to assist you with your diabetes?”
aFrom a total 196 respondents, there were 26 missing responses and 1 invalid response, giving a totalN=169. bServices selected by more than 10 respondents.
Patient experience (previous use) with a service was strongly associated with their views that the service should be provided by pharmacists (Odds Ratios (ORs) 4.4–11.3). Patients with poor/unknown glycaemic control or those who had risk factors for complications were more supportive of pharmacists providing some monitoring services (ORs 2.3–10.2). On the other hand, patients with higher incomes or those who were working were less supportive towards pharmacists providing some education and monitoring services (ORs 0.2–0.5).
DISCUSSION
Table 7 Odds ratios and 95% confidence intervals of significant characteristics associated with support for ‘patient education’ and ‘monitoring’ by pharmacists.
Patient education by pharmacists Monitoring by pharmacists
N Medicationsa Exercise Diet All educationb Compliance Treatment outcomes Adverse drug
reaction
Perform clinical testingsd
Check test resultse
Income
Low 105 Reference Reference Reference Reference Reference Reference
Moderate 54 NS 0.4 (0.17–0.90) NS NS NS NS
High 37 0.3 (0.10–0.72) 0.3 (0.10–0.80) 0.3 (0.12–0.61) 0.3 (0.10–0.68) 0.3 (0.10–0.72) 0.2 (0.09–0.53)
Employment
Not working 123 Reference Reference Reference Reference Reference
Working 73 0.3 (0.15–0.83) 0.5 (0.24–0.94) 0.4 (0.21–0.88) 0.5 (0.24–0.97) 0.3 (0.15–0.74)
Risk factors
No 39 Reference
Yes 157 3.4 (1.46–8.03)
Diabetes (glycaemic) controlf
Good/fair 23 Reference Reference Reference
Poor 90 NS 4.9 (1.20–20.55) 3.2 (1.05–9.97)
Unknown 83 2.3 (1.22–4.51) 10.2 (2.44–42.95) 4.3 (1.36–13.57)
Previous use of the service
No g Reference Reference Reference Reference Reference Reference Reference Reference
Yes 4.5 (1.79–11.53) 10.3 (4.6–23.15) 4.4 (2.30–8.30) 4.5 (1.60–12.51) 5.2 (1.79–11.52) 13.6 (5.21–35.51) 11.3 (4.51–28.13) 6.3 (2.82–13.90)
Notes.
aA composite variable—education related to antidiabetic medications: directions for use, use of insulin devices (calculated only from those currently/previously taking insulin), storage, special precautions
and common/important adverse effects; a mean rating≥5 was used.
bA composite variable—all education: disease process, treatment targets, antidiabetic medications, exercise, diet, self-monitoring of blood glucose, prevention/treatment of acute complications,
preven-tion/treatment of chronic complications, need for regular monitoring, foot self-care and smoking cessation (calculated only from those currently, or had a history of, smoking); a mean rating≥5 was used.
cA composite variable—monitoring compliance with: antidiabetic medications, exercise and diet plan, plan for prevention/treatment of complications and scheduled medical monitoring; a mean rating
≥5 was used.
dA composite variable—perform clinical testings (measuring blood glucose, blood pressure and BMI); a mean rating≥5 was used. e
A composite variable – check test results (patient self-monitoring records and laboratory data); a mean rating≥5 was used. fDiabetes (glycaemic) control is a composite variable of hyper/hypoglycaemia symptoms and HbA1c values.
g
Numbers differ for each endpoint (service).
Wibo
w
o
et
al.
(2015),
P
eerJ
,
DOI
with a population study of type 2 diabetes patients in Indonesia which reported that 67.9% of type 2 diabetes patients had not achieved good glycaemic control (HbA1c<7.0%), and approximately 60% of the patients had complications and/or risk factors for complications (i.e., dyslipidaemia and/or hypertension) (Soewondo et al., 2010).
Moreover, this study reported that follow-up care tended to be inadequate, with only about one-third of respondents reporting annual HbA1c monitoring and eye or foot examinations. Supporting this finding, the Patient and Health Provider Survey in Indonesia (2012) indicated that the majority of patients had not received foot or eye examinations within the past year, only 30% had had their HbA1c checked and many had expressed a wish to see health care providers more often (Novo Nordisk, 2013). It was suggested that this poor quality of care and patient outcomes might relate to the lack of awareness of, accessibility to and affordability of diabetes care for this patient group (Novo Nordisk, 2013). Together with the findings of this study, it provides a basis for community pharmacists to provide a range of services.
Patients’ use of pharmacy services and their views on pharmacist roles
This study indicated little involvement of Indonesian community pharmacies in the care of patients with type 2 diabetes. Respondents mostly utilised pharmacists for their supply role (dispensing). A previous Indonesian study has confirmed the limited services provided to general pharmacy patients (Handayani & Raharni, Gitawati, 2009).
Amongst non-supply roles, many respondents chose roles closely related to dispensing as the priority roles of pharmacists, i.e., education related to medications, and monitoring compliance with medications. Similar findings were evident from some international studies involved diabetes patients (Abduelkarem et al., 2003a;Weitzman et al., 2009;Brown & Green, 2000;Hermansen-Kobulnicky & Worley, 2008;Twigg et al., 2013). Two qualitative studies indicated that patients identified the primary expertise of the community phar-macist as medicines supply, and there were mixed perceptions of community pharphar-macists’ roles extending to advising on prescription medicines, providing disease-related/health advice or providing monitoring services (using clinical testing devices) (Twigg et al., 2013; Gidman & Cowley, 2013).
It is interesting that the responses to the open-ended question that patients perceived that services related to dispensing and patient education were those that should be provided to type 2 diabetes patients from community pharmacies (Table 6). All of those they considered should be provided had been included in the options that could be provided (Table 5). This also indicated that patients did not have additional requirements for services not identified initially for this study.
Characteristics associated with patients’ views on pharmacist roles
increased perceptions of pharmacists’ ability to assist them after receiving pharmacy-based services (Fera et al., 2008;Garrett & Martin, 2003;Hughes, 2006;Abduelkarem & Sackville, 2009;Hales et al., 2010). It should be emphasised that most patients in this study (at that time) received limited services from community pharmacies, thus they might not be aware of what pharmacists should and could do.
The implementation ofJaminan Kesehatan Nasional—JKN (National Health Coverage) in 2014 provides the best opportunity to optimise the use of Indonesian community phar-macies. It is important for the Government and IAI to establish an agreement on the basic services that should be available in community pharmacies. While the current payment under the scheme includes a very low prescription fee (Kementrian Kesehatan Republik Indonesia, 2014), the IAI should negotiate adequate remuneration for pharmacists to provide the services, thus enabling community pharmacies to remain viable.
In addition to patients’ past experiences, patients who were working and/or had higher incomes were generally less supportive of some of the proposed education or monitoring services (ORs≤0.5). This might be because these groups of patients were likely to be younger (mean age 63.7 years for non-workers versus 54.0 years for workers,p<0.0001; and mean age 60.4 years for income≤Rp 5 million versus 58.6 years for income>Rp 5 million,p=0.358). Two previous studies have reported that older patients, or those living with diabetes for a long time, were more supportive of pharmacists’ contributions (Twigg et al., 2013;Ibrahim, Al Tukmagi & Wayyes, 2013). It has been suggested that elderly people are one of the groups whose need for additional advice on medications and other related services has been demonstrated (Cartwright & Smith, 1988).
Notably, patients who had risk factors for complications and/or had poor/unknown glycaemic control were much more supportive of pharmacists monitoring treatment outcomes or adverse drug reactions (ORs≥2.3). Such patients might reflect those with lower health status, representing a target group who might be more motivated and responsive to pharmacists’ involvement. It has been suggested that patients who benefit most from pharmacist-led education/coaching and disease state management services include those with poor glycaemic control and multiple comorbidities (Sisson & Kuhn, 2009). It is evident that overall treatment outcomes in this patient cohort are concerning and expanding the community pharmacy role into patient management needs to be investigated.
Limitations
the findings. However, the pharmacies covered a wide range of settings (geographic and socioeconomic), so that no particular background group of patients would be excluded; and achieved a sound response rate of approximately 60%. The characteristics of the respondents in this study were comparable to those of a population study involving all type 2 diabetes patients visiting 18 medical centres across Indonesia between November 2008 and February 2009 (N=1,785) with respect to age (60 yearsversus59 years, respectively), gender (female 59.2%versus55.2%, respectively), and duration of diabetes (7 years
versus8 years, respectively) (Soewondo et al., 2010). Hence, although the sample is not randomly selected and the risk of response bias might limit the generalisation, the views of participants give some insight into the diabetes services used or desired at community pharmacies in Surabaya.
CONCLUSIONS
Community pharmacies in Surabaya, Indonesia in this study are mainly utilised for their basic services of dispensing. Many type 2 diabetes patients in these pharmacies reported limited monitoring of blood glucose and poor glycaemic control; in addition, their follow-up care and health outcomes were generally poor. These findings indicate a need and opportunities for community pharmacists to provide a range of services for patients with diabetes. Hence, strategies should be developed to broaden current pharmacy patients’ limited views of pharmacists’ roles which are mainly perceived as extensions to the supply roles. It is evident that patients support the provision of services once they have been pro-vided. Patient characteristics that influence these views provide a target group for imple-mentation of a pharmacy-based diabetes service that should be evaluated. This can provide a partial solution in the environment of a burgeoning burden of diabetes in Indonesia.
ACKNOWLEDGEMENTS
We thank all the participants who took part in the survey as well asIkatan Apoteker Indonesia—IAI (Indonesian Pharmacists Association) and staff from the Centre of Medicines Information and Pharmaceutical Care (CMIPC), Pharmacy Faculty, University of Surabaya, for their technical support in making this study possible.
ADDITIONAL INFORMATION AND DECLARATIONS
Funding
This study formed part of a doctoral thesis funded by an AusAID scholarship, which is a part of Australia’s education assistance to Indonesia. The funders had no role in study design, data collection and analysis, decision to publish, or preparation of the manuscript.
Grant Disclosures
The following grant information was disclosed by the authors: AusAID scholarship.
Competing Interests
Author Contributions
• Yosi Wibowo conceived and designed the experiments, performed the experiments, analyzed the data, contributed reagents/materials/analysis tools, wrote the paper, prepared figures and/or tables.
• Richard Parsons analyzed the data, contributed reagents/materials/analysis tools, prepared figures and/or tables, reviewed drafts of the paper.
• Bruce Sunderland and Jeffery Hughes conceived and designed the experiments, reviewed drafts of the paper.
Human Ethics
The following information was supplied relating to ethical approvals (i.e., approving body and any reference numbers):
This study was approved by the Human Research Ethics Committee of Curtin University (PH-09-11) andIkatan Apoteker Indonesia–IAI(Indonesian Pharmacists Association) (001/SK/BPD-IAI/SURABAYA/2010).
Data Availability
The following information was supplied regarding data : Raw data can be found in theSupplemental Information.
Supplemental Information
Supplemental information for this article can be found online athttp://dx.doi.org/ 10.7717/peerj.1449#supplemental-information.
REFERENCES
Abduelkarem A, Sackville M. 2009.Changes of some health indicators in patients with type 2 diabetes: a prospective study in three community pharmacies in Sharjah, United Arab Emirates.
Libyan Journal of Medicine4(1):31–36DOI 10.4176/080918.
Abduelkarem A, Sackville M, Morgan R, Hildreth A. 2003a.An assessment of the level of type 2 diabetes patients’ satisfaction with community pharmacists’ services.Pharmaceutical Journal
270(7242):446–449.
Abduelkarem A, Sackville M, Morgan R, Sackville M, Hildreth A. 2003b.Views and practices of community pharmacists regarding services for people with type 2 diabetes.International Journal
of Pharmacy Practice11(3):161–168DOI 10.1211/0022357021990.
Abdullah N, Andrajati R, Supardi S. 2010.Pengetahuan, sikap dan kebutuhan pengunjung apotek terhadap informasi obat di kota Depok (Pharmacy customers’ knowledge, attitude and needs of drug information in the city of Depok).Buletin Penelitian Sistem Kesehatan13(4):344–352.
American Diabetes Association. 2013.Standards of medical care in diabetes—2013.Diabetes Care
36(Suppl 1):S11–S66DOI 10.2337/dc13-S011.
Brown C, Green A. 2000.Expectations of patients with diabetes for pharmaceutical care services in community pharmacy settings.Journal of Social and Administrative Pharmacy17:219–223.
Department of Health Western Australia. 2008.Diabetes model of care. Perth: Department of Health Western Australia.Available athttp://www.healthnetworks.health.wa.gov.au/modelsofcare/ docs/Diabetes Model of Care.pdf(accessed 20 June 2012).
Diabetes Australia. 2012.Diabetes management in general practice: guidelines for type 2 diabetes
2012/13. Canberra: Diabetes Australia Limited.
Douglas E, Power A, Hudson S. 2007.Pharmaceutical care of the patient with diabetes mellitus: pharmacsts’ priorities for services and educational needs in Scotland.International Journal of
Pharmacy Practice15(1):47–52DOI 10.1211/ijpp.15.1.0008.
Fera T, Bluml B, Ellis W, Schaller C, Garrett D. 2008.The diabetes ten city challenge: interim clinical and humanistic outcomes of a multisite community pharmacy diabetes care program.
Journal of the American Pharmaceutical Association48(2):181–190
DOI 10.1331/JAPhA.2008.07166.
Fowler M. 2008.Microvascular and macrovascular complications of diabetes.Clinical Diabetes
26(2):77–82DOI 10.2337/diaclin.26.2.77.
Garrett D, Martin L. 2003.The Ashville project: participants’ perceptions of factors contributing to the success of a patient self management diabetes program.Journal of the American
Pharmaceutical Association43(2):185–190DOI 10.1331/108658003321480722.
Gidman W, Cowley J. 2013.A qualitative exploration of opinions on the community pharmacists’ role amongst the general public in Scotland.International Journal of Pharmacy Practice
21(5):288–296DOI 10.1111/ijpp.12008.
Hales J, Alderdice A, Staniford T, Manser J. 2010.Evaluation of the diabetes pilot program. Adelaide: Australian Government Department of Health and Ageing.
Handayani R, Raharni, Gitawati R. 2009.Persepsi konsumen apotek terhadap pelayanan apotek di tiga kota di Indonesia (pharmacy customers’perceptions regarding pharmacy services in the three cities in Indonesia).Makara Kesehatan13(1):22–26.
Hermansen-Kobulnicky C, Worley M. 2008.Exploring the patient perspective regarding com-munity pharmacists’ educational roles in diabetes medication and blood glucose management.
International Journal of Pharmacy Practice16(2):81–90DOI 10.1211/ijpp.16.2.0005.
Hughes J. 2006.Final report: customised education programs for patients with diabetes mellitus—use
of structured questionnaires and education modules (DMEP study). Perth: Curtin University of
Technology.
Ibrahim I, Al Tukmagi H, Wayyes A. 2013. Attitudes of Iraqi society towards the role of community pharmacists.Innovations in Pharmacy4(2):1–10.
International Diabetes Federation (IDF). 2013.IDF diabetes Atlas. 6th edition. Brussels: IDF.
Available athttp://www.idf.org/sites/default/files/EN 6E Atlas Full 0.pdf(accessed 15 May 2015).
Kementrian Kesehatan Republik Indonesia (KemenkesRI). 2006.Keputusan Menteri Kesehatan nomor 1027/MENKES/SK/IX/2004: standar layanan kefarmasian di apotek (Ministry of Health Decree number1027/MENKES/SK/IX/2004: standards for pharmaceutical care in community
pharmacies). Jakarta: KemenkesRI.
Kementrian Kesehatan Republik Indonesia (KemenkesRI). 2013.Indonesia health profile 2012. Jakarta: KemenkesRI.Available athttp://depkes.go.id/downloads/Profil%20Kesehatan 2012% 20(4%20Sept%202013).pdf(accessed 15 May 2015).
Kementrian Kesehatan Republik Indonesia (KemenkesRI). 2014. Surat Edaran nomor HK/MENKES/31/2014: pelaksanaan standar tarif pelayanan kesehatan pada fasilitas kesehatan tingkat pertama dan fasilitas kesehatan tingkat lanjutan dalam penyelenggaraan program jaminan kesehatan (Operational standards for remuneration of primary and secondary/tertiary
Kjome R, Sandberg S, Gran˚as A. 2008.Diabetes care in Norwegian pharmacies: a descriptive study.Pharmacy World & Science30(2):191–198DOI 10.1007/s11096-007-9164-5.
Landis J, Koch G. 1977.The measurement of observer agreement for categorical data.Biometrics
33(1):159–174DOI 10.2307/2529310.
Novo Nordisk. 2013.Where economics and health meet: changing diabetes in Indonesia: the blueprint for change programme.Available athttps://www.novonordisk.com/content/dam/ Denmark/HQ/Sustainability/documents/blueprint-changing-diabetes-in-indonesia.pdf(accessed 11 May 2015).
Nugroho M. 2010.Analisis pengelompokan dan pemetaan kecamatan sebagai dasar program untuk mengatasi masalah-masalah sosial-ekonomi di Kota Surabaya (Analysis of distric mapping systemto manage socio-economic issues in Surabaya). Dissertation, Surabaya: Institut Sepuluh Nopember.
Perkumpulan Endokrinologi Indonesia (PERKENI). 2011. Konsensus pengendalian dan pencegahan diabetes mellitus tipe 2 di Indonesia 2011 (The 2011 consensus for the management
and prevention of type 2 diabetes mellitus in Indonesia). Jakarta: PERKENI.Available athttp://
www.perkeni.org/(accessed 17 May 2015).
Plake K, Chesnut R, Odorzynski M. 2007.Barriers to community pharmacists’ provision of diabetes care services in Iowa.Journal of Pharmacy Technology23(6):327–338
DOI 10.1177/875512250702300602.
Power A, Douglas E, Mc Gregor A, Hudson S. 2006.Professional development of pharmaceutical care in type 2 diabetes mellitus: a multidisciplinary conceptual model.International Journal of
Pharmacy Practice14(4):289–299DOI 10.1211/ijpp.14.4.0010.
Rose S, Spinks N, Canhoto AI. 2015.Management research: applying the principles. London: Routledge.
Simpson S, Haggarty S, Johnson J, Schindel T, Ross T, Lewanczuk R. 2009.Survey of pharmacist activities and attitudes in diabetes management.Canadian Pharmacists Journal142(3):127–134
DOI 10.3821/1913-701X-142.3.128.
Sisson E, Kuhn C. 2009.Pharmacist roles in the management of patients with type 2 diabetes.
Journal of the American Pharmaceutical Association49(Suppl 1):S41–S45
DOI 10.1331/JAPhA.2009.09075.
Soewondo P, Ferrario A, Tahapary D. 2013.Challenges in diabetes management in Indonesia: a literature review.Globalization and Health9(1):63DOI 10.1186/1744-8603-9-63.
Soewondo P, Soegondo S, Suastika K, Pranoto A, Soeatmadji D, Tjokroprawiro A. 2010.The DiabCare Asia 2008 study—outcomes on control and complications of type 2 diabetic patients in Indonesia.Medical Journal of Indonesia19(4):235–244DOI 10.13181/mji.v19i4.412.
Storimans J. 2005.Pharmaceutical care in diabetes: quantifying and evaluating community pharmacy’s support to patients performing blood glucose self-monitoring. Dissertation, Uthrecht University, The Netherlands.
Tabachnick B, Fidell LS. 2007.Using multivariate statistics. 5th edition. Boston: Pearson Education Inc.
Timmer J, De Smet P, Schuling J, Tromp T, De Jong-van den Berg L. 1999.Patient education to users of oral hypoglycaemic agents: the perspective of Dutch community pharmacists.Pharmacy
World Science21(5):200–204DOI 10.1023/A:1008721003906.
Twigg M, Poland F, Bhattacharya D, Desborough J, Wright D. 2013.The current and future roles of community pharmacists: views and experiences of patients with type 2 diabetes.Research in
Wang H, McEuen M, Mize L, Cisek C, Barraclough A. 2009.Private sector in Indonesia: a desk
review. Bethesda: Health Systems 20/20 project, Abt Associates Inc.Available athttp://pdf.usaid.
gov/pdf docs/Pnadx714.pdf(accessed 9 May 2015).
Weitzman A, McDowell K, Elswick B, Blommel M. 2009.Patient perceptions of pharmacists’ role in diabetes: results of an Operation Diabetes initiative.Journal of the American Pharmaceutical
Association49(6):716–717DOI 10.1331/JAPhA.2009.09130.
Wibowo Y, Parsons R, Hughes J, Sunderland B. 2015.Evaluation of community pharmacy-based services for type 2 diabetes in an Indonesian setting: pharmacist survey.International Journal of
Clinical Pharmacy37(5):873–882DOI 10.1007/s11096-015-0135-y.
Younis W, Campbell S, Slack M. 2001.Pharmacists’ attitudes toward diabetes and their involvement in diabetes education. The Annals of Pharmacotherapy 35(7):841–845