MicroRNAs Discriminate Familial from Sporadic
Non-BRCA1/2 Breast Carcinoma Arising in Patients
#
35 Years
Elen Pereira Bastos1*, Helena Brentani , Fatima Solange Pasini , Aderbal Ruy T. Silva , Cesar Henrique2 1 2
Torres , Renato David Puga , Eloisa Helena Ribeiro Olivieri , Amanda Rusiska Piovezani , Carlos 2
Ariane Machado-Lima ,
5 Dirce Maria Carraro , Maria Mitzi Brentani1
1Oncology and Radiology Department, Laboratory of Medical Investigation 24 (LIM 24), University of Sao Paulo, Medical School, Sa˜o Paulo, Brazil,2Laboratory of Clinical Pathology – Laboratory of Medical Investigation 23 (LIM 23), Institute and Department of Psychiatry, University of Sao Paulo, Medical School, Sa˜o Paulo, Brazil,
˜ o Paulo, Brazil,
˜ 5Mathematics and Statistics Institute, University of Sao Paulo, Sa˜o Paulo, Brazil, 6 School of Arts, Sciences and Humanities, University of Sao Paulo,
Abstract
The influence of genetic factors may contribute to the poor prognosis of breast cancer (BC) at a very young age. However BRCA1/2mutations could not explain the majority of cases arising in these patients. MicroRNAs (miRs) have been implicated in biological processes associated with BC. Therefore, we investigated differences in miRs expression between tumors from young patients (#35 years) with sporadic or familial history and non-carriers of BRCA1/2 mutations. Thirty-six young Brazilian patients were divided into 2 groups: sporadic (NF-BC) or familial breast cancer (F-BC). Most of the samples were classified as luminal A and B and the frequency of subtypes did not differ between familial or sporadic cases. Using real time qPCR and discriminant function analysis, we identified 9 miRs whose expression levels rather than miR identity can discriminate between both patient groups. Candidate predicted targets were determined by combining results from miRWalk algorithms with mRNA expression profiles (n = 91 differently expressed genes). MiR/mRNA integrated analysis identified 91 candidate genes showing positive or negative correlation to at least 1 of the 9 miRs. Co-expression analysis of these genes with 9 miRs indicated that 49 differentially co-expressed miR-gene interactions changes in F-BC tumors as compared to those of NF-BC tumors. Out of 49, 17 (34.6%) of predicted miR-gene interactions showed an inverse correlation suggesting that miRs act as post-transcriptional regulators, whereas 14 (28.6%) miR-gene pairs tended to be co-expressed in the same direction indicating that the effects exerted by these miRs pointed to a complex level of target regulation. The remaining 18 pairs were not predicted by our criteria suggesting involvement of other regulators. MiR–mRNA co-expression analysis allowed us to identify changes in the miR-mRNA regulation that were able to distinguish tumors from familial and sporadic young BC patients non-carriers of BRCA mutations.
Citation:Bastos EP, Brentani H, Pasini FS, Silva ART, Torres CH, et al. (2014) MicroRNAs Discriminate Familial from Sporadic Non-BRCA1/2 Breast Carcinoma Arising in Patients#35 Years. PLoS ONE 9(7): e101656. doi:10.1371/journal.pone.0101656
Editor:Sonia Rocha, University of Dundee, United Kingdom
ReceivedFebruary 4, 2014;AcceptedJune 10, 2014;PublishedJuly 9, 2014
Copyright:ß2014 Bastos et al. This is an open-access article distributed under the terms of the Creative Commons Attribution License, which permits unrestricted use, distribution, and reproduction in any medium, provided the original author and source are credited.
Funding:This study was funded by FAPESP (2009/10088-7) and CNPq. The funders had no role in study design, data collection and analysis, decision to publish, or preparation of the manuscript.
Competing Interests:The authors have declared that no competing interests exist. * Email: elenbastos@hotmail.com
Introduction
Breast Cancer (BC) in patients below the age of 35 years is uncommon, occurring in only 2%–10% of the cases. However, this frequency may differ among different ethnic groups [1–6].
Despite intense treatment, the prognosis in young BC patients, particularly in black women, is worse than that in their older counterparts [2,5,7,8]. This fact has been partially attributed to the high frequency of unfavorable tumor characteristics [9–12].
The influence of genetic factors may contribute to the poor prognosis, but familial history of cancer explains only 10%–37% of the cases, of which 10%–25% were attributable to BRCA1/2
mutations, which are currently known as the 2 major BC predisposing genes [13,14]. In sporadic cases, this frequency is still smaller, ranging from 3%–10% [15].
Anders and coworkers [9] have suggested that BC in young woman is a unique biological entity. Other studies have shown that its aggressive nature may be explained by the high frequency
of aggressive intrinsic BC subtypes and grades, both of which were correlated with age [16,17]. However, a recent gene expression profiling meta-analysis proposed that BC at young age appears to be biologically distinct beyond subtype distribution [18].
We recently reported a study of 54 young Brazilian patients (# 35 years). Of these, 29% presented a familial cancer history and specifically, 37.5% were carriers of germ line mutation in the
BRCA1/2genes, which was displayed by only 8.6% of the tumors from non-familial BC cases. In addition, gene expression profiling appropriately discriminated tumors according to the presence/ absence ofBRCA1/2 germ line mutations [19]. However, gene expression profile differences between familial and sporadic early onset BC patients who were not carriers ofBRCA1/2mutations were not found.
An additional improvement of gene signatures could be found from the examination of microRNAs (miRs), which have recently emerged as important players in BC development, progression, and metastasis [20,21]. MiRs are a class of small non-coding
PLOS ONE | www.plosone.org 1 July 2014 | Volume 9 | Issue 7 | e101656
Alberto de Braganca Pereira ,
Laboratory of Genomics and Molecular Biology, Research Center (CIPE), A.C. Camargo Cancer Center, Sa
3 Clinical Research Center - Hospital Israelita Albert Einstein- HIAE, Sao Paulo, Brazil, 4
˜ ˜
˜ ˜
Sao Paulo, Brazil˜
6
¸
6 4
RNAs that post transcriptionally regulate the expression of protein-coding genes opening a new area of marker research complementary to the transcriptional gene signature. Differentially expressed miRs were identified according to different BC molecular subtypes [22], metastasis, and overall survival [23,24]. However, little is still known about the involvement of miRs in the molecular mechanisms underlying the aggressiveness of BC in young women. An association between miR-146a phenotype and tumor age-of-onset in BRCA1/2-negative familial BC cases has been reported [25,26]. In addition, a recent study highlighted that non-BRCA1/2 hereditary BC may be sub-classified using specific miR signatures [27]. Recently, Estal and coworkers suggested that the miR expression profile may facilitate the identification of sporadic BC carrying genetic/epigenetic changes in BRCA genes [28]. Our specific aims in the current study were (A) to identify a miR expression signature that could discriminate between familial and sporadic BC in young patients (#35 years) who are non-carriers of BRCA1/2 mutations; and (B) to identify candidate target-genes related with the differentially expressed miRs.
Materials and Methods
Patients
Tumor samples were collected, processed and provided by A. C. Camargo Biobank (Sa˜o Paulo, SP, Brazil) from breast cancer patients aged thirty five years or less, undergoing surgery, after genetic counseling and signature of an informed consent form. This study was approved by the Ethical Board for Research Project Analysis (CEP) of the A. C. Camargo Cancer Center (research protocol 1656/12) and was conducted in accordance to the Helsinki Declaration.
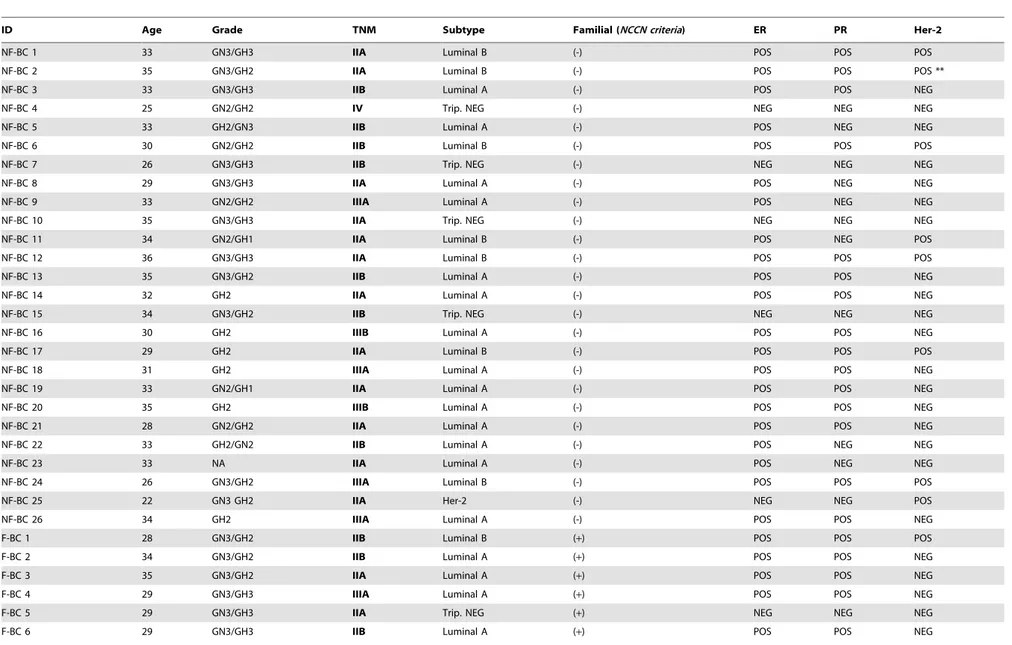
The BRCA1/2 status was determined in DNA extracted from peripheral blood samples, and patients with relevant mutations were excluded from subsequent analyses. Thirty-six patients who were not carriers ofBRCA1/2, TP53, orCHEK2mutations were considered for analysis in the present study and segregated into 2 groups: familial breast cancer (F-BC) (n = 10) and sporadic breast cancer [non-familial (NF-BC)] (n = 26), according to National Comprehensive Cancer Network(NCCN) guidelines updated in 2011. The thirty-six patients included in the present study were also present in a previous report of our group [19]. InTable 1, we have reported the clinical descriptors of all these patients, including pathological features of the tumor specimens obtained from them, e.g., histological type, disease staging (TNM) at diagnosis, and histological grade. Estrogen receptor (ER), proges-terone receptor (PR), and Her-2 status were determined by immunohistochemistry. Only tumor samples with distinct nuclear immunostaining in$10% of the cells were recorded as ER or PR-positive. Her-2 status was considered positive if the membrane staining reaction was defined as 3+. In unsure cases (2+), fluorescence in situ hybridization (FISH) was additionally per-formed. Tumors were further classified as luminal A or B, Her-2-rich, and triple negative. The classification of BC subtypes was determined by proxies of the molecular subtypes following the model proposed by Carey and coworkers [29] in which luminal A indicated ER+
, and/or PR+
and HER-22; subtype luminal B exhibited ER+, and/or PR+and HER-2+; Her-2-rich presented Her-2 over expressed or amplified and absent ER/PR and subtype triple negative indicated ER2, PR2, HER-22.
Total RNA and DNA isolation
Frozen tumor tissue (approximately 30 mg) was homogenized with Precellys 24 equipment (Carlsbad, California, USA). The supernatant was used to purify total RNA with the RNeasy Mini
kit (Qiagen, Venlo, the Netherlands) according to the manufac-turer’s protocol. RNA quality and concentration were assessed using a ND-1000 NanoDrop (Thermo Scientific, Wilmington, Delaware, USA) and the integrity was determined using an Agilent Bioanalyzer 2100 (Agilent Technologies, Palo Alto, California, USA). The DNA extractions from peripheral blood methodology as well as the sequencing reaction and mutation analyses were described in a recent publication of our group [19].
MicroRNA expression profiling
A global profiling of miR expression in these 36 tumor samples was performed using the TaqMan Low Density Array Human microRNA assay panel A (TLDA, Life Technologies). The array panel A contains 377homo sapiensmiRs and 7 endogenous controls (ribosomal RNAs) for a total of 384 probes. Reverse transcription was performed with the RT-miRs kit and the pre-amplification with the pre-amplification kit (Life Technologies) from 350 ng of total RNA using the manufacturer’s protocols. Real time PCR (RT-PCR) was performed according to the 7900 HT Real Time PCR Systems protocol using 26Universal PCR Master Mix, no AmpErase UNG (Life Technologies).
The expression value, measured as cycle threshold (CT), of each miRs was obtained using SDS 1.2 software (Life Technologies: TaqMan OpenArray Real-Time PCR Plates). MiRs presenting expression levels below the detection limit (.38) in more than 60% of the samples were excluded from analyses. To calculate the expression of miRs for each tumor sample, the delta CT method was used and normalization was performed with the RNU48 endogenous control assay (CT of miR - CT of RNU48). The differences in miRs expression levels (fold change) were calculated from the ratio of mean 22DCTof a tumor sample from F-BC group relative to the mean 22DCTof NF-BC tumors samples [30]. The normalization between samples was performed bylimma library R version 2.13[31].
Statistical comparisons of miRs expression between F-BC and NF-BC were performed using Significance Analysis of Microarrays
(SAM) test with adjusted FDR (0%) by MeV program (Multi Experiment Viewerv.4.5).
Messenger-RNA expression profiling
All 36 tumors from F-BC and NF-BC patients were included in the messenger RNA (mRNA) expression analyses. The mRNA expression profiling was performed with one-color labeled cDNAs from 500 ng of total RNA and was reverse-transcribed into double-stranded cDNA with the MMLV reverse transcriptase enzyme and primed with the oligo-dT-T7 polymerase promoter sequence. The Cy3-labeled cDNA was then transcribedin vitroby T7 RNA polymerase. The quantity and efficiency of the labeled amplified Cy3-cDNA were determined with a NanoDrop ND-1000 (Thermo Scientific, Wilmington, Delaware, USA). Labeled cDNAs were hybridized to the Agilent B4X44K G4112F whole human genome oligoarray (Agilent, Santa Clara, USA). All microarray raw data have been deposited in the GEO public database (http://www.ncbi.nlm.nih.gov/geo), a MIAME compli-ant database, under accession number GSE37126. Table S1 shows corresponding array slide numbers to the sample ID used in the present study. Gene expression profiling was performed with a permuted student’s T-test (MEV, TM4 software) using the MeV
program (Multi Experiment Viewerv.4.5) [32,33]. Discriminant analyses
Table 1.Patient and sample characteristics.
ID Age Grade TNM Subtype Familial (NCCN criteria) ER PR Her-2
NF-BC 1 33 GN3/GH3 IIA Luminal B (-) POS POS POS
NF-BC 2 35 GN3/GH2 IIA Luminal B (-) POS POS POS **
NF-BC 3 33 GN3/GH3 IIB Luminal A (-) POS POS NEG
NF-BC 4 25 GN2/GH2 IV Trip. NEG (-) NEG NEG NEG
NF-BC 5 33 GH2/GN3 IIB Luminal A (-) POS NEG NEG
NF-BC 6 30 GN2/GH2 IIB Luminal B (-) POS POS POS
NF-BC 7 26 GN3/GH3 IIB Trip. NEG (-) NEG NEG NEG
NF-BC 8 29 GN3/GH3 IIA Luminal A (-) POS NEG NEG
NF-BC 9 33 GN2/GH2 IIIA Luminal A (-) POS NEG NEG
NF-BC 10 35 GN3/GH3 IIA Trip. NEG (-) NEG NEG NEG
NF-BC 11 34 GN2/GH1 IIA Luminal B (-) POS NEG POS
NF-BC 12 36 GN3/GH3 IIA Luminal B (-) POS POS POS
NF-BC 13 35 GN3/GH2 IIB Luminal A (-) POS POS NEG
NF-BC 14 32 GH2 IIA Luminal A (-) POS POS NEG
NF-BC 15 34 GN3/GH2 IIB Trip. NEG (-) NEG NEG NEG
NF-BC 16 30 GH2 IIIB Luminal A (-) POS POS NEG
NF-BC 17 29 GH2 IIA Luminal B (-) POS POS POS
NF-BC 18 31 GH2 IIIA Luminal A (-) POS POS NEG
NF-BC 19 33 GN2/GH1 IIA Luminal A (-) POS POS NEG
NF-BC 20 35 GH2 IIIB Luminal A (-) POS POS NEG
NF-BC 21 28 GN2/GH2 IIA Luminal A (-) POS POS NEG
NF-BC 22 33 GH2/GN2 IIB Luminal A (-) POS NEG NEG
NF-BC 23 33 NA IIA Luminal A (-) POS NEG NEG
NF-BC 24 26 GN3/GH2 IIIA Luminal B (-) POS POS POS
NF-BC 25 22 GN3 GH2 IIA Her-2 (-) NEG NEG POS
NF-BC 26 34 GH2 IIIA Luminal A (-) POS POS NEG
F-BC 1 28 GN3/GH2 IIB Luminal B (+) POS POS POS
F-BC 2 34 GN3/GH2 IIB Luminal A (+) POS POS NEG
F-BC 3 35 GN3/GH2 IIA Luminal A (+) POS POS NEG
F-BC 4 29 GN3/GH3 IIIA Luminal A (+) POS POS NEG
F-BC 5 29 GN3/GH3 IIA Trip. NEG (+) NEG NEG NEG
F-BC 6 29 GN3/GH3 IIB Luminal A (+) POS POS NEG
MicroRNA
Expression
in
Early
Onset
Breast
Cancer
PLOS
ONE
|
www.ploson
e.org
3
July
2014
|
Volume
9
|
Issue
7
|
was performed and the proportion of samples classified on each group was recalculated.
Targets prediction and selection of candidates
Putative targets were inferred for each miR using the miRWalk prediction program database algorithms which extract predictions from TargetScan, Diana microT 4.0, Miranda, RN22 and Pictar (http://www.umm.uni-heidelberg.de/apps/zmf/mirwalk/index.html). The final miR-target prediction results were a combination of the queries. Targeting criteria were as follows (a) near-perfect complementarity in the 7–8 nt region close to 59-end of the miR (seed sequence) with the 39-UTR region of target sequence; (b) conserved target sequence sites between species; (c) strong thermodynamic stability of miR–mRNA duplex; (d) complemen-tarity between multiple sites; (e) existence of a central non-matched region (loop).
The final selection of target candidates was established by combining genes predicted by the miRWalk data base and also exhibiting differential expression from the microarray experiment profile.
Co-expression analyses
We performed a co-expression analysis based on a method analogous to that previously described [35]. First, differentially expressed miRs and mRNAs between F-BC and NF-BC BC groups were selected and then, the co-expression correlation between each miR–mRNA interaction was calculated separately for each group using the Pearson correlation coefficient (PCC). Then, co-expression matrixes between differentially expressed genes and miRs were constructed for the F-BC and NF-BC groups. Second, to determine alterations in the co-expression pattern between the 2 groups, the absolute value of the difference of correlations in these PCCs was calculated. To determine whether the deviation in correlation between the 2 groups was significant, we randomly reassigned the patients to one of the groups and repeated the analysis. This was performed 100,000 times to calculate the random distribution. Real PCC differences for miR-RNA pairs between patient groups were compared to the random distribution to generate p values.
Validation of miRs and targets
MiRs validation was performed by reverse transcription (RT) and quantitative PCR (qPCR) with individual TaqMan Assays from Life Technologies. From 10 ng of total RNA we synthesized cDNA using TaqMan RT reaction components following manufacture’s protocol (Life Technologies), and qPCR was performed in duplicates and accordantly to the 7900 HT Real Time PCR Systems protocol using 26Universal PCR Master Mix, no Amp Erase UNG (Life Technology).
For mRNA-target validation the RT was performed with Super Script III – First Strand Synthesis Super Mix (Invitrogen Life Technologies) using random hexamer primers (0.05mg/mL) and total RNA (1 ug). The cDNA samples (2 ng) were subjected to qPCR assays in triplicate using SYBR Green methodology with Power SYBR Green PCR Master Mix (Applied Biosystems, Life Technologies), followed by 7900 Real Time (Life Technologies). Gene-specific primers were designed using the Primer 3 software (http://frodo.wi.mit.edu/primer3/) to generate a PCR product in the 39portion, spanning the translated region of the target mRNA. Sequences present in different exons, preferentially separated by long introns, were selected, according with sequences deposited at http://www.ncbi.nlm.nih.gov/nucleotide. To avoid non-specific product formation, BLAST analysis (www.ncbi.nlm.nih.gov/blast) was carried out. The reaction conditions used to all primers were:
95uC for 10 minutes, followed by 40 cycles at 95uC for 15 seconds and annealing temperature of 59uC,60uC or 62uC for 60 seconds
(Table S2).
To calculate the expression of miRs for each tumor sample, the delta delta CT method was used and normalization was performed with the RNU48 endogenous. The F-BC 11sample was considered as reference.
To calculate the expression of target-mRNAs, NF-BC 33 sample was considered as reference sample based on Pfaffl method: ratio = (Etarget)
DCP target (ACTB–sample)
/(ENF-BC 33)
DCP NF-BC 33 (ACTB–sample)
). The differences in miRs and target expression levels (fold change) were calculated from the ratio of 22DDCTor Pfaffl ratio, respectively, of F-BC group relative to NF-BC tumor samples.
Results
All 36 tumors were classified as infiltrative ductal carcinomas and displayed grade 2 or 3. The clinical stage at diagnosis as well as the histological grade and tumor markers were similarly
distributed in sporadic or familial cases. Most of them were classified as luminal A and B and the frequency of the subtypes did not differ between familial or sporadic cases (Table 2).
Differentially expressed miRs
In an attempt to identify a miR signature that separates familial and sporadic breast carcinoma, we profiled miR expression on 36 tumor samples derived from 26 sporadic (NF-BC) and 10 familial patients (F-BC), using a miR platform containing 377 miRs. As 1 sample (F-BC 3 inTable 1) was excluded from the analyses due to a weak normalization result, only 35 tumor samples were further analyzed.
Among the 377 miRs contained in the array panel, 121 showed an expression level below the detection limit (CT.38) in more than 60% of the samples in both groups and were excluded for downstream analyses. While comparing F-BC and NF-BC using a Significance Analysis of Microarrays (SAM) statistical test (FDR = 0 and a delta value of 0.77), 9 miRs out of 256 showed significantly differentiated expression. Among them, 3 miRs (miR-486-3p, miR-874, and miR-98) were downregulated, whereas 6 miRs (miR-124, miR-210, miR-381, miR-455-3p, miR-501-5p, and miR-660) were upregulated in F-BC tumors as compared with tumors of NF-BC patients (Table 3).
Discriminant analyses
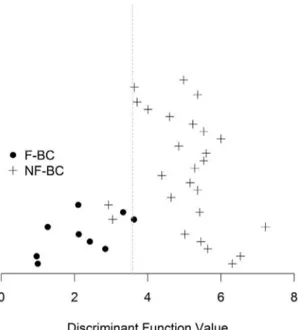
A discriminant analyses indicated that the 9 miRs differentially expressed could discriminate tumors between F-BC and NF-BC. The graphic (Figure 1) indicated 82% of accuracy in the distribution of the 35 patients between both groups. Out of 35 patients, 3 (NF-BC 7, NF-BC 9, and F-BC 8) were not correctly classified.
On cross-validation analysis, 1 patient was removed from the analysis, a new discriminant function was estimated and the removed patient was reclassified. Performing this procedure with all the patients, we had a classification accuracy of 88% and 92% for F-BC and NF-BC patients, respectively.
Differentially expressed mRNA
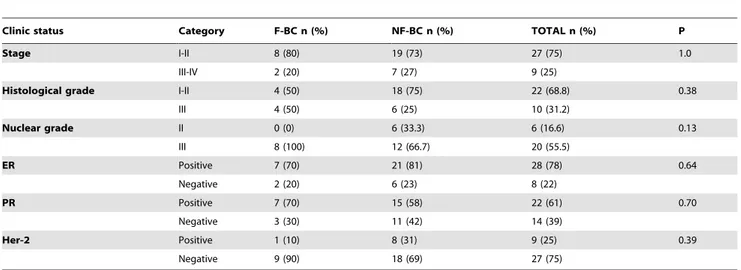
Differences in gene expression profiling of F-BC compared to NF-BC were assessed with a permuted student’s T-test and genes were considered differentially expressed when P#0.01. The gene Table 2.Frequency of clinical and histopathological characteristics according to the groups—familial breast cancer (F-BC) and sporadic breast cancer (NF-BC).
Clinic status Category F-BC n (%) NF-BC n (%) TOTAL n (%) P
Stage I-II 8 (80) 19 (73) 27 (75) 1.0
III-IV 2 (20) 7 (27) 9 (25)
Histological grade I-II 4 (50) 18 (75) 22 (68.8) 0.38
III 4 (50) 6 (25) 10 (31.2)
Nuclear grade II 0 (0) 6 (33.3) 6 (16.6) 0.13
III 8 (100) 12 (66.7) 20 (55.5)
ER Positive 7 (70) 21 (81) 28 (78) 0.64
Negative 2 (20) 6 (23) 8 (22)
PR Positive 7 (70) 15 (58) 22 (61) 0.70
Negative 3 (30) 11 (42) 14 (39)
Her-2 Positive 1 (10) 8 (31) 9 (25) 0.39
Negative 9 (90) 18 (69) 27 (75)
doi:10.1371/journal.pone.0101656.t002
Table 3.MiRs differentially expressed between F-BC and NF-BC.
miRs Fold-change (F-BC/NF-BC)
hsa-miR-124 10.08
hsa-miR-210 7.32
hsa-miR-455-3p 4.28
hsa-miR-660 2.65
hsa-miR-381 2.47
hsa-miR-501-5p 2.15
hsa-miR-98 22.29
hsa-miR-486-3p 24.53
hsa-miR-874 24.70
Fold change expression between comparison of F-BC and NF-BC was considered significant with an FDR (false discovery rate) = 0 and a delta value of 0.77.
doi:10.1371/journal.pone.0101656.t003
MicroRNA Expression in Early Onset Breast Cancer
expression profile led to 1599 probes representing 1415 unique differentially expressed genes. Among 1415, 742 probes were downregulated and 857 probes were upregulated.
Targeting prediction and selection of candidate genes The number of predicted targets for each of the 9 differentially expressed miRs among F-BC and NF-BC patients, ranged from 2594 unique targets for miR-381 to 342 targets for miR-210, for a total of 14294 targets (Figure 2). To select candidate genes, we combined the list of 1415 differentially expressed genes from our microarray experiment with the 14294 predicted targets from the miRWalk data base and examined only the intersection. This analysis yielded 91 unique differentially expressed predicted target-genes correlated with at least 1 out of 9 miR regulators. Out of 91, 34 showed down expression and 57 showed over expression. Supposedly candidate target-gene should exhibit an inverse expression level compared to the correspondent miR, however we also found miRs that were coordinately correlated with their targets. (Table S3).
Co-expression analyses
To assess the differences of miRs and gene interaction patterns between F-BC and NF-BC, we performed co-expression analysis. Co-expression matrixes with 91 candidate genes against 9 miRs were performed separately for the F-BC and NF-BC groups
(Figures 3A and 3B). We found 49 miR–mRNA interactions,
including those with predicted or not predicted genes for correspondent miR, which presented statistically significantly differences in co-expression between F-BC and NF-BC (P,0.05)
(Table S4). Not predicted interactions were defined as those
showing differences in co-expression between the groups but in which miR-mRNA interactions not fulfilled our target prediction criteria. Once miRs have a negative regulatory role on their mRNA targets, we selected miRs–mRNA interaction fulfilling the condition that the expression levels of the genes should be inversely
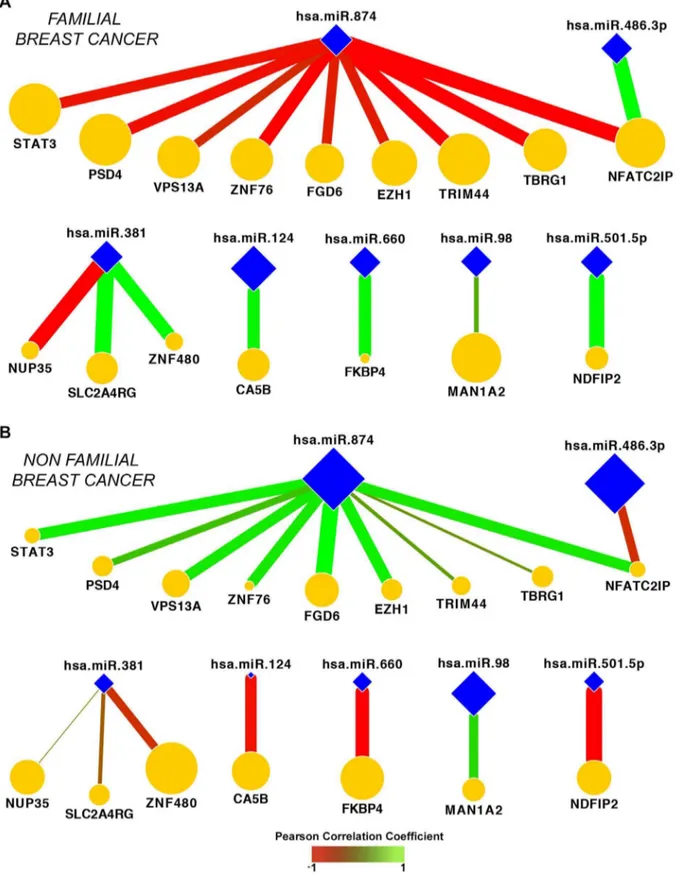
correlated with their corresponding miRs. In other words, if a given miR was upregulated, the expression of its target is expected to be downregulated and vice-versa. From the 31 predicted miR– mRNA interactions, 17 pairs presented inverse fold-change values between F-BC and NF-BC. These results suggested that 17 predicted miR–mRNA interactions could be supported by the potential miRs post-transcription regulator function. Analysis of those miR–mRNA interactions defined a network of 16 genes and 7 miRs whose co-expression is different in F-BC and NF-BC
(Figures 4A and 4B). Comparing both network profiles, F-BC
against NF-BC, we observed different colors of edges representing negative (red) or positive (green) co-expression correlation as well as the different thickness of the edges, where thicker edges indicate high values of co-expression correlation, and thinner edges represent low values of co-expression correlation. We can also visualize that 11 genes from the NF-BC group exhibited downregulation (smaller orange nodes) and 5 genes upregulation (larger orange nodes) compared with the same genes in the F-BC group. On the other hand, we observed 7 miRs (blue nodes) of which miR-98, miR-486-3p, and miR-874 showed low values of co-expression correlation (smaller size of blue nodes) and miR-124, miR-381, miR-501-5p, and miR-660 showed high values of co-expression correlation (bigger size of blue nodes) in F-BC compared with NF-BC network profile.
Out of 49, 8 not predicted miR–mRNA interactions showing inverse correlation (Table S5) could also distinguish F-BC from NF-BC tumors. Among them 5 pairs could be considered as predicted targets albeit using less stringent criteria.
From 49 miR–mRNA interactions, 24 (14 predicted and 10 not predicted) showed differentially expressed genes and significant co-expression differences; however, they did not exhibit inverse signal of fold-change value, suggesting that the separation between F-BC from NF-BC tumors could not be exclusively explained by the predominant mechanism of miRs-mediated gene repression.
We performed functional analysis using the IPA (Ingenuity Pathway Analysis; QUIAGEN) program on a set formed by 28 unique genes representing 49 predicted/not predicted miR-mRNA interactions listed intable S4. The results from functional analysis demonstrated over representation of some biological processes involved with: apoptosis, cell death, and fibroblast proliferation (Table S6).
Figure 1. Cross-validation analysis graphic.Representative cross-validation analysis graphic of 35 patients from the F-BC and NF-BC groups. Black spots indicate F-BC samples while plus signs indicate NF-BC samples. The line represents the limit discriminant function between groups. F-BC, familial breast cancer; NF-BC, non-familial breast cancer. doi:10.1371/journal.pone.0101656.g001
Figure 2. Target prediction graph.Graph displaying the number of predicted targets from miRWalk for each miRNA differentially expressed between F-BC and NF-BC groups. F-BC, familial breast cancer; NF-BC, non-familial breast cancer.
Validation of miRs and targets
The miRs and target-genes validation experiments were performed in a panel of independent samples of sporadic BC (n = 9), with low risk of displaying BRCA1/2 mutation (,12%) according toBreast and Ovarian Analysis of Disease Incidence and Carrier Estimation Algorithm (BOADICEA) (http://ccge.medschl.cam.ac. uk/boadicea/). Due to difficulties in acquisition of new cases of fresh frozen tissues of familial BC cases of young patients, not harboring BRCA1/2 mutation, the set of validation included only 2 new samples totalizing 7 samples of F-BC group. All validation set of patients exhibited tumors with luminal subtype. Other clinical and histopathological characteristics were reported in
table S7.
All 9 miRs were analyzed but the results of qPCR experiments showed the expected upregulation only for miR-124, miR-210, miR-381, miR-455-3p, miR-501-5p, miR-660 and miR-874 down regulation in the F-BC group versus the NF-BC group in accordance to the main results. The small number of samples in the validation experiments might explain the lack of miR-486 and miR-98 validation.
We selected 10 predicted target-genes (Table S2) from the network miR–mRNA interactions signature that showed inverse correlation, followingfigure 4, to confirm their inverse expression related to correspondent miR based on fold change values.
Out of 10, 8 target-genes exhibited inverse fold change values with their respectively miRs in agreement with our main results
Figure 3. Co-expression matrixes.Co-expression matrixes of the 91 differentially expressed genes vs 9 differentially expressed miRs for F-BC (A) and NF-BC (B), respectively. The colors represent the co-expression values reaching from 1 to21 for red and green, respectively. F-BC, familial breast cancer; NF-BC, non-familial breast cancer.
doi:10.1371/journal.pone.0101656.g003
MicroRNA Expression in Early Onset Breast Cancer
Figure 4. Illustration of network signatures.Seventeen miR–mRNA predicted interactions whose co-expression are significantly different between F-BC (A) and NF-BC (B) groups. Color edges represent positive (green) or negative (red) Pearson correlation values. The edge thickness indicates the magnitude of Pearson correlation values. The node size is proportional to the fold change of genes (orange nodes) and of miRs (blue nodes) between F-BC to NF-BC groups. F-BC, familial breast cancer; NF-BC, non-familial breast cancer.
(Table 4). This remarkable validation suggested that miR-124, 210, 381, 455-3p, 501-5p, 660 and miR-874, as well as STAT3, PSD4, SNF480, FGD6, EZH1, TRIM44, TBRG1, NFATC2IP and CA5B target-genes could possibly explain molecular mechanisms involved in BC carcinogenesis that distinguished tumors from familial to sporadic BC in young patients BRAC1/2 non carriers mutations.
Discussion
We present the results of integrated analysis of miR/mRNA data from the same tumor tissue samples to identify genes that could differentiate between tumor harvested from young patients (aged#35 years) with familial BC and those from sporadic BC, not harboring BRCA1/BRCA2 mutations. We identified a set of 9 miRs whose expression levels, rather than miR identity, were able to correctly separate, with high accuracy, familial and non-familial young BC patients. A subset of these miRs has previously been characterized as BC regulatory genes, including miR-486-3p [36], miR-98 [37], miR-874 [23], miR-210 [24], miR-124 [38,39], whereas miR-660 [40,41] has been associated with other cancers or tissue types.
We next identified a set of miRs showing significant negative or positive correlations with those of their targets. Approximately 34,6% retained inversely correlated miR–mRNA interactions. An interaction network revealed changes in the co-expression of these miR-mRNA pairs that were able to distinguish familial from sporadic breast cancer. For instance, a decreased expression of miR-874, miR-98 and miR-486-3p were associated with increased expression of their predicted target genes in F-BC cases. MiR-874, which has been previously associated with unfavorable prognosis in invasive breast cancer [23] was inversely correlated with several of their paired genes (EZH1, FGD6, PSD4, NFAIC2IP, STAT3, TBRG1, TRIM44, VPS13A, ZNF76), suggesting that miR-874 has a critical role in the regulation of genes preferentially expressed in F-BC, compared with the sporadic cases. This analysis revealed genes involved in embryonic stem cell self-renewal, such as STAT3 and EZH1 [42-44]. FGD6 (annexin A2) is a mediator of EGFR endocytosis and its inhibition in BC coincided with an enhanced EGF-signaling [45]. TBRG1 (NIAM) was previously identified as one of the TGFb1-responsive genes and has been described as a novel growth inhibitor that contributes to the maintenance of chromosomal stability [46]. VPS13A codes for
vacuolar sorting proteins, and its loss was observed in colorectal and gastric cancers with high microsatellite instability [47]. Upregulation of NFATC2IP (nuclear factor of activated T-cells, cytoplasmic, calcineurin-dependent 2 interacting protein) can induce the expression of ILs that stimulates T cell proliferation and activation. TRIMM44 is a member of tripartite motif-containing protein (TRIM) family, which is an important regulator of carcinogenesis [48].
Contrariwise, upregulated miRs in familial versus sporadic cases were correlated with a reduced expression of their target genes, including CA5B 124), ZNF480, SLC2A4RG, NUP35 (miR-381), NDFIP2 (miR-501-5p), and FKBP4 (miR-660). FKBP4, a binding protein of SSEA-4 is a syalyl-glycolipid that has been commonly used as a pluripotent human embryonic stem cell marker. The inhibition of FKBP4 could reduce the expression of SSEA-4, leading to suppression of cancer malignant processes [49]. SLC2A4R6 is associated with the recruitment of glut4 to the plasma membrane and its downregulation may decrease glucose uptake and AKT signaling [50]. CA5B is an enzyme localized in the mitochondrial matrix that converts the CO2produced by the TCA cycle to HCO32, which in turn controls metabolic pathways that increase oxidative phosphorylation. A decrease in CA5B levels may lead to a drop in intracellular pH and an activation of the pro-apoptotic protein BAX [51]. Thus, gene profiling in familial BC appears to be associated with some biological processes that seem to characterize a less aggressive behavior compared to the sporadic cases.
Our findings of coordinated expressed pairs between miR and mRNA predicted levels (28.6%) indicated that some miRs, including miR-501-5p, miR-660, miR-874, miR-98, miR-124, and miR-455-3p, act as positive regulators of their target mRNAs. The targets of this population appear to include mainly mRNAs associated with the embryonic development or the nervous system. Several instances of miR co-expression in the same direction as their target genes have been previously reported, albeit this is a less well understood phenomenon [52-54]. We also detected a set of genes that, although presenting positive/negative co-expression, were not included in our list ofin silicopredicted targets, indicating that these genes are not potential miR targets according to our stringent criteria, however, they may be regulated by other mechanisms.
In conclusion, comparing tumors of young patients with or without familial BC history not carriers of BRCA1/2 mutation our Table 4.MiR-mRNA interactions validation.
miR-mRNA interaction Fold miR Fold mRNA-target Validated
miR-124:CA5B 87.6 2100.0 Validated
miR-381:ZNF480 10.2 1.29 Not validated
miR-98: MAN1A2 3.68 22.38 Not validated*
miR-874:STAT3 22.5 2.97 Validated
miR-874:PSD4 22.5 2.05 Validated
miR-874:FGD6 22.5 3.44 Validated
miR-874:EZH1 22.5 3.78 Validated
miR-874:TRIM 44 22.5 3.00 Validated
miR-874:TBRG1 22.5 2.45 Validated
miR-874:NFATC2IP 22.5 2.16 Validated
*miR-mRNA interaction without agreement with our main results. doi:10.1371/journal.pone.0101656.t004
MicroRNA Expression in Early Onset Breast Cancer
results showed similarity between their phenotypes, most tumors of the present series being of the luminal subtype corroborating previous results [55]. However by applying co-expression analysis we found out transcriptional differences between both groups highlighting that changes in the miR-mRNA regulation were able to distinguish tumors between both groups.
Supporting Information
Table S1 Microarray raw data from GEO accession number GSE37126 showing the correspondent samples ID of the present study.
(PDF)
Table S2 Target-genes selected to validation. (PDF)
Table S3 91 differently expressed candidate genes.List of 91 differentially expressed genes associated to at least one miR. (PDF)
Table S4 49 miRNA–mRNA interactions. Interactions presenting significant differences of co-expression profile between F-BC and NF-BC.
(PDF)
Table S5 miR–mRNA not predicted interactions, pre-senting inverse correlation.
(PDF)
Table S6 Biological processes.Categories over represented by the target genes related to 49 miR-mRNA interactions. (PDF)
Table S7 Patient and tumor characteristics of the validation set.
(PDF)
Acknowledgments
We thank Aline Damascena and Leandro Lima (Laboratory, Research Center (CIPE), A.C. Camargo Cancer Center, Sa˜o Paulo, Brazil) for their contribution to the statistical analyses in the initial stages of the project. The authors would like to thank Enago (?www.enago.com) for the English language review.
Author Contributions
Conceived and designed the experiments: MMB HB. Performed the experiments: EPB EHRO. Analyzed the data: EPB CHT ARTS FSP ARP CABP AML RDP HB. Contributed reagents/materials/analysis tools: DMC HB CHT ARTS FSP ARP AML. Wrote the paper: EPB HB MMB.
References
1. Brinton LA, Sherman ME, Carreon JD, Anderson WF (2008) Recent trends in breast cancer among younger women in the United States. J Natl Cancer Inst 100: 1643–1648. doi:10.1093/jnci/djn344. PubMed: 19001605
2. El Saghir NS, Seoud M, Khalil MK, Charafeddine M, Salem ZK, et al. (2006) Effects of young age at presentation on survival in breast cancer. BMC Cancer 20: 6–194. PubMed: 16857060.
3. Peng R, Wang S, Shi Y, Liu D, Teng X, et al. (2011) Patients 35 years old or younger with operable breast cancer are more at risk for relapse and survival: a retrospective matched case-control study. Breast 20: 568-573. doi:10.1016/ j.breast.2011.07.012. PubMed: 21843944
4. Han W, Kang SY; Korean Breast Cancer Society (2010) Relationship between age at diagnosis and outcome of premenopausal breast cancer: age less than 35 years is a reasonable cut-off for defining young age-onset breast cancer. Breast Cancer Res Treat 119: 193–200. doi:10.1007/s10549-009-0388-z. PubMed: 19350387
5. Paluch-Shimon S, Wolf I, Sadetzki S, Gluck I, Oberman B, et al. (2011) Association between very young age and adverse characteristics of breast cancer at presentation amongst Israeli women. Am J Clin Oncol 34: 219–222. doi:10.1097/COC.0b013e3181d6b500. PubMed: 20523208
6. Madaras L, Baranya´k Z, Kulka J, Sza´sz AM, Kova´cs A, et al. (2013) Retrospective analysis of clinicopathological characteristics and family history data of early-onset breast cancer: a single-institutional study of hungarian patients. Pathol Oncol Res 19: 723–729. doi:10.1007/s12253-013-9635-z. PubMed: 23709114
7. Fredholm H, Eaker S, Frisell J, Holmberg L, Fredriksson I, et al. (2009) Breast cancer in young women: poor survival despite intensive treatment. PLoS One 4: e7695. doi:10.1371/journal.pone.0007695. PubMed: 19907646
8. Cancello G, Maisonneuve P, Mazza M, Montagna E, Rotmensz N, et al. (2013) Pathological features and survival outcomes of very young patients with early breast cancer: How much is "very young"? Breast 22: 1046–1051. doi:10.1016/ j.breast.2013.08.006. PubMed: 24091127
9. Anders CK, Hsu DS, Broadwater G, Acharya CR, Foekens JA, et al. (2008) Young age at diagnosis correlates with worse prognosis and defines a subset of breast cancers with shared patterns of gene expression. J Clin Oncol 26: 3324– 3330. doi:10.1200/JCO.2007.14.2471. Erratum in: J Clin Oncol 29: 3721. PubMed: 18612148
10. Dimitrakakis C, Tsigginou A, Zagouri F, Marinopoulos S, Sergentanis TN, et al. (2013) Breast cancer in women aged 25 years and younger. Obstet Gynecol 121: 1235–1240. doi:10.1097/AOG.0b013e318291ef9a. PubMed: 23812457 11. Lin CH, Lu YS, Huang CS, Kuo KT, Wang CC, et al. (2011) Prognostic
molecular markers in women aged 35 years or younger with breast cancer: is there a difference from the older patients? J Clin Pathol 64: 781–787. doi:10.1136/jclinpath-2011-200064. PubMed: 21642658
12. Tichy JR, Lim E, Anders CK (2013) Breast cancer in adolescents and young adults: a review with a focus on biology. J Natl Compr Canc Netw 11: 1060– 1069. PubMed: 24029122.
13. Fackenthal JD, Olopade OI (2007) Breast cancer risk associated with BRCA1 and BRCA2 in diverse populations. Nat Rev Cancer 7: 937–948. Review. PubMed: 18034184.
14. Haffty BG, Choi DH, Goyal S, Silber A, Ranieri K, et al. (2009) Breast cancer in young women (YBC): prevalence of BRCA1/2 mutations and risk of secondary malignancies across diverse racial groups. Ann Oncol 20: 1653–1659. doi:10.1093/annonc/mdp051. PubMed: 19491284
15. de Sanjose´ S, Le´one´ M, Be´rez V, Izquierdo A, Font R, et al. (2003) Prevalence of BRCA1 and BRCA2 germline mutations in young breast cancer patients: a population-based study. Int J Cancer 106: 588–593. PubMed: 12845657. 16. Anders CK, Fan C, Parker JS, Carey LA, Blackwell KL, et al. (2011) Breast
carcinomas arising at a young age: unique biology or a surrogate for aggressive intrinsic subtypes? J Clin Oncol 29: e18–20. doi:10.1200/JCO.2010.28.9199. PubMed: 21115855
17. Keegan TH, Press DJ, Tao L, Derouen MC, Kurian AW, et al. (2013) Impact of breast cancer subtypes on three-year survival among adolescent and young adult women. Breast Cancer Res 15: R95. PubMed: 24131591.
18. Azim HA Jr, Michiels S, Bedard PL, Singhal SK, Criscitiello C, et al. (2012) Elucidating prognosis and biology of breast cancer arising in young women using gene expression profiling. Clin Cancer Res 18: 1341–1351. doi:10.1158/1078-0432.CCR-11-2599. PubMed: 22261811
19. Carraro DM, Koike Folgueira MA, Garcia Lisboa BC, Ribeiro Olivieri EH, Krepischi ACV, et al. (2013) Comprehensive analysis of BRCA1, BRCA2 and TP53 germline mutation and tumor characterization: a portrait of early-onset breast cancer in Brazil. PLoS One 8: e57581. doi:10.1371/journal.pone. 0057581. PubMed: 23469205
20. Ferracin M, Querzoli P, Calin GA, Negrini M (2011) MicroRNAs: toward the clinic for breast cancer patients. Semin Oncol 38: 764–775. doi:10.1053/ j.seminoncol.2011.08.005. Review. PubMed: 22082762
21. Shi M, Liu D, Duan H, Shen B, Guo N (2010) Metastasis-related miRNAs, active players in breast cancer invasion, and metastasis. Cancer Metastasis Rev 29: 785–99. PubMed: 10.1007/s10555-010-9265-9.
22. Blenkiron C, Goldstein LD, Thorne NP, Spiteri I, Chin SF, et al. (2007) MicroRNA expression profiling of human breast cancer identifies new markers of tumor subtype. Genome Biol 8: R214. PubMed: 17922911.
23. Volinia S, Croce CM (2013) Prognostic microRNA/mRNA signature from the integrated analysis of patients with invasive breast cancer. Proc Natl Acad Sci U S A 110: 7413–7417. doi:10.1073/pnas.1304977110. PubMed: 3645522 24. Buffa FM, Camps C, Winchester L, Snell CE, Gee HE, et al. (2011) microRNA-associated progression pathways and potential therapeutic targets identified by integrated mRNA and microRNA expression profiling in breast cancer. Cancer Res 71: 5635–5645. doi:10.1158/0008-5472.CAN-11-0489. PubMed: 21737487
25. Shen J, Ambrosone CB, DiCioccio RA, Odunsi K, Lele SB, et al. (2008) A functional polymorphism in the miR-146a gene and age of familial breast/ ovarian cancer diagnosis. Carcinogenesis 29: 1963-1966. doi:10.1093/carcin/ bgn172. PubMed: 18660546
26. Pastrello C, Polesel J, Della Puppa L, Viel A, Maestro R (2010) Association between hsa-mir-146a genotype and tumor age-of-onset in BRCA1/BRCA2-negative familial breast and ovarian cancer patients. Carcinogenesis 31: 2124– 2126. doi:10.1093/carcin/bgq184. PubMed: 20810544
non-BRCA1/2 hereditary breast tumours. Br J Cancer 109: 2724–2734. doi:10.1038/bjc.2013.612. PubMed: 24104964
28. Murria Estal R, Palanca Suela S, de Juan Jime´nez I, Egoavil Rojas C, Garcı´a-Casado Z, et al. (2013) MicroRNA signatures in hereditary breast cancer. Breast Cancer Res Treat 142: 19–30. doi:10.1007/s10549-013-2723-7. PubMed: 24129975
29. Carey LA, Dees EC, Sawyer L, Gatti L, Moore DT, et al. (2007) The triple negative paradox: primary tumor chemosensitivity of breast cancer subtypes. Clin Cancer Res 13: 2329–2334. PubMed: 17438091.
30. Wang C, Gao C, Zhuang JL, Ding C, Wang Y (2012) A combined approach identifies three mRNAs that are down-regulated by microRNA-29b and promote invasion ability in the breast cancer cell line MCF-7. J Cancer Res Clin Oncol 138: 2127–2136. doi:10.1007/s00432-012-1288-x. PubMed: 22864815
31. Smyth GK, Michaud J, Scott HS (2005) Use of within-array replicate spots for assessing differential expression in microarray experiments. Bioinformatics 21: 2067–2075. PubMed: 15657102.
32. Chu GB, Narasimhan R, Tibshirani R, Tusher V (2001) SAM Significance Analysis of Microarrays users guide and technical document. http://statweb. stanford.edu/,tibs/SAM/
33. Saeed AI, Sharov V, White J, Li J, Liang W, et al. (2003) TM4: a free, open-source system for microarray data management and analysis. Biotechniques 34: 374–378. PubMed: 12613259.
34. Browne MW (2000) Cross-Validation Methods. J Math Psychol 44: 108-132. PubMed: 10733860.
35. Silva AR, Grinberg LT, Farfel JM, Diniz BS, Lima LA, et al. (2012) Transcriptional alterations related to neuropathology and clinical manifestation of Alzheimer’s disease. PLoS One 7: e48751. doi:10.1371/journal.pone. 0048751. PubMed: 23144955
36. Farazi TA, Horlings HM, Ten Hoeve JJ, Mihailovic A, Halfwerk H, et al. (2011) MicroRNA sequence and expression analysis in breast tumors by deep sequencing. Cancer Res 71: 4443–4453. doi:10.1158/0008-5472.CAN-11-0608. PubMed: 21586611
37. Siragam V, Rutnam ZJ, Yang W, Fang L, Luo L, et al. (2012) MicroRNA miR-98 inhibits tumor angiogenesis and invasion by targeting activin receptor-like kinase-4 and matrix metalloproteinase-11. Oncotarget 3: 1370–1385. PubMed: 23211491.
38. Liang YJ, Wang QY, Zhou CX, Yin QQ, He M, et al. (2013) MiR-124 targets Slug to regulate epithelial-mesenchymal transition and metastasis of breast cancer. Carcinogenesis 34: 713–722. doi:10.1093/carcin/bgs383. PubMed: 23250910
39. Lv XB, Jiao Y, Qing Y, Hu H, Cui X, et al. (2011) miR-124 suppresses multiple steps of breast cancer metastasis by targeting a cohort of pro-metastatic genes in vitro. Chin J Cancer 30: 821-830. doi:10.5732/cjc.011.10289. PubMed: 22085528
40. Dmitriev P, Barat A, Polesskaya A, O’Connell MJ, Robert T, et al. (2013) Simultaneous miRNA and mRNA transcriptome profiling of human myoblasts reveals a novel set of myogenic differentiation-associated miRNAs and their target genes. BMC Genomics 14: 265. doi:10.1186/1471-2164-14-265. PubMed: 23597168
41. Yoshitaka T, Kawai A, Miyaki S, Numoto K, Kikuta K, et al. (2013) Analysis of microRNAs expressions in chondrosarcoma. J Orthop Res 31: 1992–1998. doi:10.1002/jor.22457. PubMed: 23940002
42. Liu S, Patel SH, Ginestier C, Ibarra I, Martin-Trevino R, et al. (2012) MicroRNA93 regulates proliferation and differentiation of normal and malignant breast stem cells. PLoS Genet. 8: e1002751. doi:10.1371/journal. pgen.1002751. PubMed: 22685420
43. Lieblein JC, Ball S, Hutzen B, Sasser AK, Lin HJ, et al. (2008) STAT3 can be activated through paracrine signaling in breast epithelial cells. BMC Cancer 8: 302. doi:10.1186/1471–2407-8-302. PubMed: 18939993
44. Wagner KU, Schmidt JW (2011) The two faces of Janus kinases and their respective STATs in mammary gland development and cancer. J Carcinog 10: 32. doi:10.4103/1477-3163.90677. PubMed: 22279417
45. de Graauw M, Cao L, Winkel L, van Miltenburg MH, le De´ve´dec SE, et al. (2013) Annexin A2 depletion delays EGFR endocytic trafficking via cofilin activation and enhances EGFR signaling and metastasis formation. Oncogene: In press. doi: 10.1038/onc.2013.219. PubMed: 23792445
46. Tompkins VS, Hagen J, Frazier AA, Lushnikova T, Fitzgerald MP, et al. (2007) A novel nuclear interactor of ARF and MDM2 (NIAM) that maintains chromosomal stability. J Biol Chem 282: 1322–1333. PubMed: 17110379. 47. An CH, Kim YR, Kim HS, Kim SS, Yoo NJ, et al. (2012) Frameshift mutations
of vacuolar protein sorting genes in gastric and colorectal cancers with microsatellite instability. Hum Pathol 43: 40–47. doi:10.1016/j.hum-path.2010.03.015. PubMed: 21733561
48. Kashimoto K, Komatsu S, Ichikawa D, Arita T, Konishi H, et al. (2012) Overexpression of TRIM44 contributes to malignant outcome in gastric carcinoma. Cancer Sci 103: 2021–2026. doi:10.1111/j.1349-7006.2012.02407.x. PubMed: 22862969
49. Hung TC, Lin CW, Hsu TL, Wu CY, Wong CH (2013) Investigation of SSEA-4 binding protein in breast cancer cells. J Am Chem Soc 135: 5934-5937. doi:10.1021/ja312210c. PubMed: 23574147
50. Garrido P, Mora´n J, Alonso A, Gonza´lez S, Gonza´lez C (2013) 17b-estradiol activates glucose uptake via GLUT4 translocation and PI3K/Akt signaling pathway in MCF-7 cells. Endocrinology 154: 1979–1989. doi: 10.1210/en.2012-1558. PubMed: 23546602
51. Pellegrini L, Pucci B, Villanova L, Marino ML, Marfe G, et al. (2012) SIRT3 protects from hypoxia and staurosporine-mediated cell death by maintaining mitochondrial membrane potential and intracellular pH. Cell Death Differ 19: 1815–1825. doi:10.1038/cdd.2012.62. PubMed: 22595756
52. Vasudevan S, Tong Y, Steitz JA (2007) Switching from repression to activation: microRNAs can up-regulate translation. Science 318: 1931–1934. PubMed: 18048652.
53. Nunez-Iglesias J, Liu CC, Morgan TE, Finch CE, Zhou XJ (2010) Joint genome-wide profiling of miRNA and mRNA expression in Alzheimer’s disease cortex reveals altered miRNA regulation. PLoS One 5: e8898. doi:10.1371/journal.pone. 0008898. PubMed: 20126538
54. Hannafon BN, Sebastiani P, de las Morenas A, Lu J, Rosenberg CL (2011) Expression of microRNA and their gene targets are dysregulated in preinvasive breast cancer. Breast Cancer Res 13: R24. doi:10.1186/bcr2839. PubMed: 21375733
55. Fernandez-Ramires R, Go´mez G, Mun˜oz-Repeto I, de Cecco L, Llort G, et al. (2011) Transcription characteristics of familial non-BRCA1/BRCA2 breast tumors. Int J Cancer 128: 2635–2644. doi: 10.1002/ijc.25603. PubMed:20715112
MicroRNA Expression in Early Onset Breast Cancer