Journal of Engineering Science and Technology Review 8 (5) (2015) 180- 189
Research Article
Seismic Dynamic Damage Characteristics of Vertical and Batter Pile-supported Wharf
Structure Systems
Li Jiren 1, 2*, Song Bo 1,2 and Cui Jianyu 3
1School of Civil and Environmental Engineering, University of Science and Technology Beijing, Beijing 100083, China 2Beijing International Cooperation Base for Science and Technology-Aseismic Research of the Rail Transit Engineering in the Strong
Motion Area, Beijing 100083, China
3 Engineering Department, Anderson Technology Corporation, Tokyo 1050003, Japan
Received 28 July 2015; Accepted 1 October 2015
___________________________________________________________________________________________
Abstract
Considering a typical steel pipe pile-supported wharf as the research object, finite element analytical models of batter and vertical pile structures were established under the same construction site, service, and geological conditions to investigate the seismic dynamic damage characteristics of vertical and batter pile-supported wharf structures. By the numerical simulation and the nonlinear time history response analysis of structure system and the moment–axial force relation curve, we analyzed the dynamic damage characteristics of the two different structures of batter and vertical piles under different seismic ground motions to provide reasonable basis and reference for designing and selecting a pile-supported wharf structure. Results showed that the axial force of batter piles was dominant in the batter pile structure and that batter piles could effectively bear and share seismic load. Under the seismic ground motion with peak ground acceleration (PGA) of 350 Gal and in consideration of the factors of the design requirement of horizontal displacement, the seismic performance of the batter pile structure was better than that of the vertical pile structure. Under the seismic ground motion with a PGA of 1000 Gal, plastic failure occurred in two different structures. The contrastive analysis of the development of plastic damage and the absorption and dissipation for seismic energy indicated that the seismic performance of the vertical pile structure was better than that of the batter pile structure.
Keywords:
Steel pipe pile-supported wharf, Vertical pile structure, Batter pile structure, Seismic dynamic damage, Moment–axial force
(M–N) relation curve
__________________________________________________________________________________________
1. Introduction
For vertical and batter structure systems of a pile-supported wharf, different dynamic response characteristics and failure mechanisms are shown under seismic ground motion. After the Han-Shin Awaji earthquake in 1995, the earthquake damage of pile-supported wharves was recorded through field investigation of underwater photography and observation of damaged piles that were pulled out. In many earthquake observations, batter pile-supported wharf structures are more vulnerable than vertical pile structures. In the Tianjin Port, 22 pile-supported wharves have been established, and 700 pairs (1400 piles) of batter piles have been set. After the Tangshan earthquake in 1976, about 464 batter piles (more than 30% of the total) and 306 pile caps (more than 40% of the total) were broken [1]. The batter pile structures of the Sagar Dweep Port (Sumatra earthquake in 2004) [2] also broke after the earthquake. As batter pile-supported wharves are easily damaged during an earthquake, vertical pile structures are used instead of batter piles in most countries. In the United States, batter pile structures are not adopted for relevant seismic criteria and guidelines.
Nevertheless, the seismic performance of batter pile structures cannot be completely denied. For example, after the Loma Prieta earthquake in 1989, the batter pile structure that supported the rail beams of container cranes in the American Oakland Port remained intact and had no seismic damage. At present, the Code for Seismic Design of Water Transport Engineering (JST146-2012) [3] in China retains the design standard of batter pile wharf structures.
Given that wharf structures that accommodate import and export activities are essential to a port transportation system, understanding the performance of wharf structures in a high seismicity area is important. The seismic performance of pile-supported wharf structures has been the subject of a large number of previous studies. Shafieezaedeh et al. [4] studied the fragility of wharf structures for a typical pile-supported wharf and developed a set of fragility curves using a nonlinear model and limit states. Wang et al. [5] adopted the capacity spectrum method to determine the damage state of the target wharf structure and analyzed the uncertainties associated with the capacity spectrum and the thresholds of different damage states. Jaradat et al. [6] studied the documents of seismic, structural, geotechnical, and soil– structure interaction aspects and discussed various studies to support the development of a displacement-based seismic design. Shafieezadeh et al. [7] used a detailed model of a hypothetical wharf, including nonlinearities in piles, pile– deck connections, and soil–structure interaction, and the
______________
* E-mail address:[email protected]
ISSN: 1791-2377 © 2015 Kavala Institute of Technology. All rights reserved.
J
estr
JOURNAL OF Engineering Scienceand Technology Review
study verified that considering a crane may actually amplify the structural wharf response. Thomopoulos et al. [8] proposed a methodology for the performance-based fragility analysis of pile-supported wharves based on nonlinear dynamic analysis. Elahi et al. [9] evaluated a simple approximate pseudostatic method for estimating the maximum internal forces and the horizontal displacements of a pile group located in a soil slope. The applicability of the approach was verified by comparing the experimental shaking table tests and the results of the rigorous analysis of a pile-supported wharf. Amirabadi et al. [10] developed an optimal probabilistic seismic demand model for pile-supported wharves with batter piles and considered that probabilistic seismic demand models were critical components of performance-based seismic design and seismic risk assessment. Shafieezadeh et al. [11] investigated the modal properties and vulnerability of such existing pile-supported marginal wharves using advanced structural and soil modeling procedures to perform 2D nonlinear plane strain seismic analyses using the time histories of ground displacement and excess pore water pressures within the underlying soil embankment. Shafieezadeh et al. [12] also investigated the 3D nonlinear response of a typical pile-supported container wharf structure in liquefiable embankment soils. In comparison with that of the 2D model, the importance of the 3D response characteristics of the structure was demonstrated. Amirabadi et al. [13] developed an optimal probabilistic seismic demand model for typical pile-supported wharf structures using probabilistic seismic demand analysis. Heidary et al. [14] developed the seismic fragility curves of an idealized pile-supported wharf with batter piles through a practical framework. The FLAC2D model was used, and nonlinear time history analyses were performed to simulate the seismic performance of the wharf structure. An incremental dynamic analysis was also adopted to estimate the seismic demand quantities, and it indicated that fragility curves were useful for seismic risk assessment. Ramirez-Henao et al. [15] obtained estimates of the second-order lateral stiffness and the lowest buckling axial load of each pile using simple arithmetic calculations and presented application examples to demonstrate the versatility of the method and to compare the results with commercially available finite element software. They found that the buckling axial load of slender waterside piles was smaller than that of short land side piles. However, when the soil was soft, the difference became insignificant.
10.00
-13.50
-21.00
1:2 1:2
+2.60 +2.70
-26.00 -7.80
Buckling deformation Steel pipe piles
¦ Õ1016mm,t12mm
a)
b)
Fig. 1. Wharves damaged by an earthquake (Investigation after the Han-shin Awaji earthquake). (a) Buckling failure location and underwater photography of the damaged piles in the Ofunato Port, (b) Observation of the damaged piles after an earthquake in the Kobe Port
The dynamic damage responses of batter and vertical piles under the same construction site, service, and geological conditions were analyzed in this study. Comparison of the two structures indicated the differences in performance indicators under a seismic action. This study provided reasonable basis and reference for designing and selecting a pile-supported wharf structure.
2. Research background
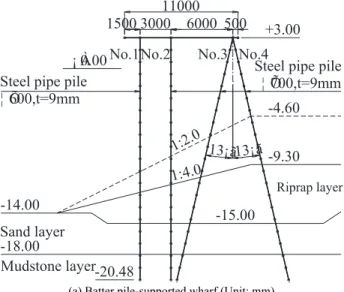
A typical steel pipe pile-supported wharf is selected and studied in this work. The water depth is −14.0 m, the length in the normal direction is 24.0 m, and the width is 11.0 m. The wharf deck, including slab and beam, is constructed with reinforced concrete. The slab is 400 mm thick, and the beam is 600 mm wide and 1000 mm high. Fig. 2(a) shows the cross-section of a batter pile-supported wharf with two vertical piles and two batter piles. The tilt angle of the batter piles is 13°. The diameter of the vertical pile near the sea side is 600 mm, and its thickness is 9 mm. The other vertical piles are 700 mm in diameter and 9 mm in thickness. Fig. 2(b) shows the cross-section of a vertical pile-supported wharf with four vertical piles. The diameter of the vertical pile near the sea side is 600 mm, and its thickness is 9 mm. The other vertical piles are 700 mm in diameter and 9 mm in thickness. Steel pipes are SKK400 with yield strength of 235 N/mm2 regardless of corrosion.
The performance parameters of the steel pipe piles are listed in Table 1.
Table 1. Performance parameters of steel pipe piles
Parameters Steel pipe pile
Φ600
Steel pipe pile
Φ700
Diameter D (mm) 600 700
Thickness t (mm) 9 9
Circumference ψ (m) 1.88 2.2 Unit weight w (kg/m) 131 153 Sectional area A (m2) 1.671E-02 1.954E-02 Sectional moment of
inertia I (m4) 7.30E-04 1.17E-03 Section modulus Z (m3) 2.43E-03 3.33E-03 Radius of gyration of area
Li Jiren, Song Bo and Cui Jianyu /Journal of Engineering Science and Technology Review 8 (5) (2015) 180 - 189
The soil profile for the wharves (Fig. 2) consists of three layers. From GL-4.60 m to GL-15.0 m is the riprap layer with N-value of 8. From GL-15.0 m to GL-18.0 m is the sand soil with N-value of 20. From GL-18.0 m and below is the mudstone with N-value of more than 50. The N-value of the site soil is measured on the basis of the standard penetration test.
11000 1500 3000 6000 500
No.4 +3.60
+2.00
-14.00
1:2.0
-4.60
-18.00
-15.00
-20.48
+3.00
Steel pipe pile ¦ Õ700,t=9mm Steel pipe pile
¦ Õ600,t=9mm
¨ ŒL.W.L.¡ À0.00
Sand layer
Mudstone layer
Riprap layer No.1 No.2
No.3
13¡ã 13¡ã
(a) Batter pile-supported wharf (Unit: mm)
Sand layer
Mudstone layer Steel pipe pile ¦ Õ600,t=9mm le
m
yer
-14.00
-4.60
-18.00
-15.00 No.1
No.2No.3No.4 +3.60
+2.00 +3.00
¨ ŒL.W.L.¡ À0.00
Steel pipe pile ¦Õ700,t=9mm
-20.48
1:2.0
Riprap layer 11000
1500 300030003000500
(b) Vertical pile-supported wharf (Unit: mm)
Fig. 2. Transverse view of the configuration of pile-supported wharf structures
3. Finite element numerical simulation analysis method 3.1 Finite element model
The finite element models of vertical and batter pile-supported wharf structures are shown in Fig. 3. Nonlinear plastic hinges are set on the connection of the pier concrete slabs and the steel pipe piles to simulate the elastic–plastic response characteristics of the piles under a seismic action to analyze the dynamic damage characteristics of the two different structure systems.
Steel pipe pile
¦ Õ600,t=9mm
Steel pipe pile
¦ Õ700,t=9mm
Sand layer
Mudstone layer
Riprap layer
11000 1500 3000 6000 500
No.1No.2 No.3 No.4
1:2.0
¡ À0.00
13¡ã13¡ã
+3.00
-20.48 -14.00
-18.00
-4.60
-9.30
-15.00
1:4.0
(a) Batter pile-supported wharf (Unit: mm)
¡ À0.00
+3.00
1:4.0
-4.60
-9.30
-15.00 3000
Steel pipe pile
¦Õ600,t=9mm l pipe pile
m
Steel pipe pile
¦ Õ700,t=9mm
No.1No.2 No.3 No.4
yer
Sand layer
Mudstone layer
Riprap layer 1:2.0
-14.00
-18.00
-20.48
11000
1500 30003000 500
(b) Vertical pile-supported wharf (Unit: mm) Fig. 3. Finite element models of pile-supported wharf structures
3.2 Parameters of soil springs
The interaction of pile–soil foundation is modeled by a series of soil springs distributed along the length of each of the piles in the directions perpendicular and parallel to the pile axial.
The value of soil spring perpendicular to the direction of the pile axial is determined by Eqs. (1) and (2).
K
h=αηkαkkhBH (1)
3 4
0( )
0.3
H
h h
B
k =k − (2)
where α is the correction coefficient of the horizontal
foundation reaction by considering the effect of the angle of piles, ηk is the correction coefficient of the horizontal
foundation reaction by considering the effect of pile group and is taken as 1.0, αkis the correction coefficient of the
horizontal foundation reaction for a single pile and is taken as 1.5, kh is the coefficient of the horizontal foundation
reaction force during an earthquake (kN/m3), kh0 is the
Specifications for Highway Bridges [16] and be derived
through the deformation coefficient
0 2800
E = N (kN/m2), N is the N -value
measured by the standard penetration test.), and BH is the
conversion load width of the pile (m).
The values of the soil spring KSV in the direction of the
pile axial and the soil spring of the pile end KV are
determined by Eqs. (3) and (4), respectively.
0.3 SV h
K = K (3)
0.1 u V
R K
D
= (4)
The limit support and the tensile force are determined by Eqs. (5) and (6), respectively:
min( , )
NU u pu
P = R R (5)
min( , )
TU u pu
P = P+W P (6)
where PNU is the limit support force; PTU is the
limit tensile force; Ru and Pu are the limit support and
tensile forces determined by subgrade, respectively;
pu
R and Ppu are the limit pressure ( = f Ay p)
and tensile forces ( = f Ay′ p) determined by the
piles, respectively; fy and fy′ are the compressive
and tensile yield strengths of the piles, respectively; Ap is the effective sectional area of the steel pipe piles; and W is the sum of the weight of the piles and the effective weight of the soil in the piles.
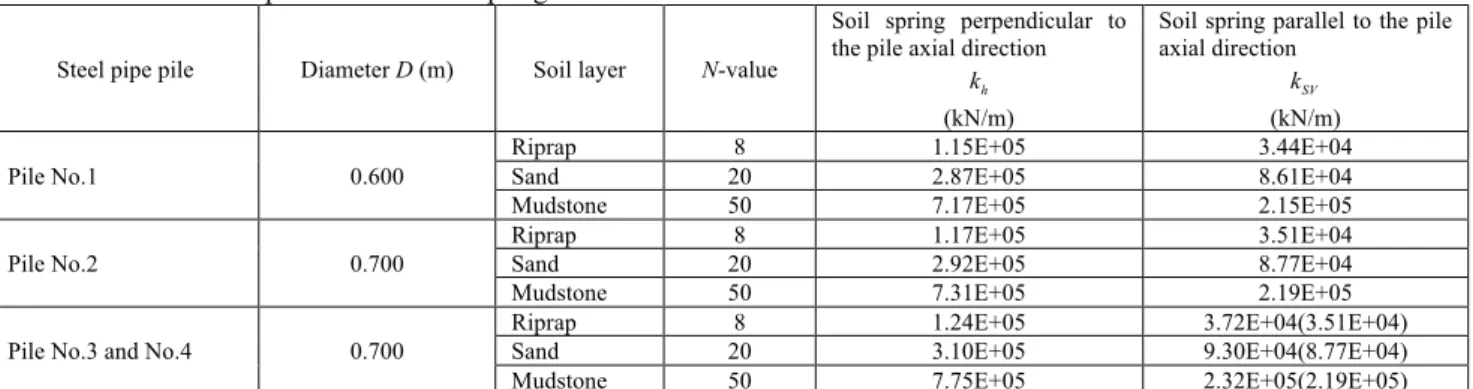
Based on the parameters determined above, the calculation results of the soil springs perpendicular and parallel to the pile axial direction are shown in Table 2.
Table 2. Performance parameters of soil springs
Steel pipe pile Diameter D (m) Soil layer N-value
Soil spring perpendicular to the pile axial direction
h k (kN/m)
Soil spring parallel to the pile axial direction
SV k
(kN/m)
Pile No.1 0.600
Riprap 8 1.15E+05 3.44E+04
Sand 20 2.87E+05 8.61E+04
Mudstone 50 7.17E+05 2.15E+05
Pile No.2 0.700
Riprap 8 1.17E+05 3.51E+04
Sand 20 2.92E+05 8.77E+04
Mudstone 50 7.31E+05 2.19E+05
Pile No.3 and No.4 0.700
Riprap 8 1.24E+05 3.72E+04(3.51E+04)
Sand 20 3.10E+05 9.30E+04(8.77E+04)
Mudstone 50 7.75E+05 2.32E+05(2.19E+05) Note: The values in parentheses are the equivalent springs parallel to the pile axial direction of piles No.3 and No.4 in a vertical pile-supported wharf.
3.3 Selection of input seismic ground motion
The El Centro seismic ground motion shown in Fig. 4 is used in the nonlinear time history analysis. The peak ground acceleration (PGA) is 356.9 Gal, and the duration is 53.72 s. This motion was recorded during the 1940 Imperial Valley earthquake (Ms = 7.2) in California. The PGA is adjusted to
350 and 1000 Gal. The PGA of 350 Gal can be used in the design of harbor structures, and it is equivalent to the seismic ground motion of level I. The ground motion with a PGA of 1000 Gal, which is larger than that at level I, is adopted to analyze the plastic characteristics of the steel pipe piles.
0 10 20 30 40 50 60
-400 -200 0 200 400
Acce
le
rati
on
(
Gal
)
Time (s)
Fig. 4. Accelerogram of the El Centro seismic ground motion
3.4 Dynamic response numerical calculation method in finite element analysis
The motion equation of the structure system for the dynamic time history response can be determined by the numerical time-stepping method for integrating differential equations [17]. The Newmark method is adopted for the numerical calculation of the dynamic response. The calculation is based on the following equations:
!
u
i+1=u!i+[(1−γ)Δt]u!!i+(γΔt)u!!i+1 (7)
u
i+1=ui+(Δt)u!i+[(0.5−β)(Δt)
2
]u!!
i+[β(Δt)
2
]!!u
i+1 (8)
where u!!, u!, and uare the acceleration, velocity, and relative displacement, respectively.
If the time step satisfies Eq. (9), the Newmark method will be stable.
1 1
2 2
n t
T π γ β
Δ
≤ ⋅
− (9)
Li Jiren, Song Bo and Cui Jianyu /Journal of Engineering Science and Technology Review 8 (5) (2015) 180 - 189
accuracy characteristics of the calculation method. When
1 / 4
β= and γ=1 / 2 , Eq. (9) is
expressed as Eq. (10).
n t
T Δ
<∞ (10)
Therefore, Newmark equations are the same as the derived assuming constant average acceleration, which is the average acceleration method. The average acceleration method is stable for any time step. Therefore, the time step does not affect the stability of the dynamic equation solutions.
4. Simulation analysis of the failure process
4.1 Dynamic time history response analysis of relative displacement
Figs. 5 and 6 show the results of the pile top relative displacement of the two pile-supported wharf structures under different ground motions. With an increase in PGA, the relative displacement on the pile top also increases.
0
10
20
30
40
50
60
-60
-40
-20
0
20
40
60
Extremum -57.6mm
Re
la
ti
v
e
d
ip
la
ce
men
t
(m
m)
Time (s)
(a) Batter pile-supported wharf structure
0
10
20
30
40
50
60
-150
-100
-50
0
50
100
150
Extremum 138.0mm
Re
la
ti
v
e
d
ip
la
ce
men
t
(mm
)
Time (s)
(b) Vertical pile-supported wharf structure
Fig. 5. Relative displacement time histories of the pile top (PGA = 350 Gal)
0
10
20
30
40
50
60
-150
-100
-50
0
50
100
150
Re
la
ti
v
e
d
ip
la
ce
men
t
/mm
Time /sec
Extremum -123.5mm
(a) Batter pile-supported wharf structure
0
10
20
30
40
50
60
-300
-200
-100
0
100
200
300
Extremum -263.1mm
Re
la
ti
v
e
d
ip
la
ce
men
t
/mm
Time /sec
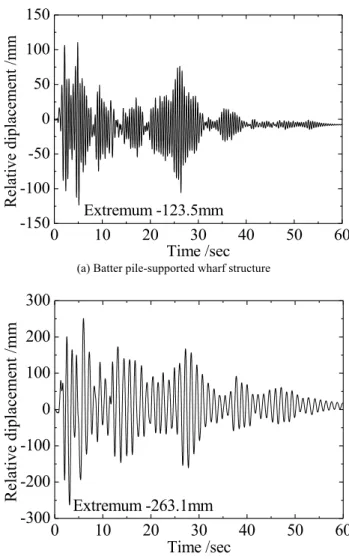
(b) Vertical pile-supported wharf structureFig. 6. Relative displacement time histories of the pile top (PGA = 1000 Gal)
The effect of the maximum displacement under ground motion on the batter pile-supported structure is smaller than that on the vertical pile-supported structure. According to the results of the dynamic time history response analysis, the maximum displacement of the vertical pile-supported structure is more than two times of the batter pile-supported structure. Under the same condition, the displacement performance indicator can be better controlled by the batter pile-supported structure.
4.2 Limit-bearing capacity analysis based on the correlation of moment–axial force (M–N)
-1200 -800
-400
0
400
800
1200
-6000
-3000
0
3000
6000
Compressive limit
(-3927kN)
M
y-N
M
p-N
Tensile limit
(788kN)
Axi
al
fo
rce
/k
N
Moment /kN
·
m
Pile No.1
-1200 -800 -400 0 400 800 1200
-6000 -3000 0 3000 6000
Axi
al
fo
rce
/k
N
Moment /kN·m
Tensile limit (946kN)
Compressive limit (-4592kN)
Mp-N
My-N
Pile No.2
-1200 -800 -400 0 400 800 1200
-6000 -3000 0 3000 6000
Axi
al
force
/
k
N
Moment /kN·m
Compressive limit (-4592kN) Tensile limit
(998kN)
My-N
Mp-N
Pile No.3
-1200 -800 -400 0 400 800 1200
-6000 -3000 0 3000 6000
Axi
al
fo
rce
/k
N
Moment /kN·m
My-N
Tensile limit (1050kN)
Compressive limit (-4592kN)
Mp-N
Pile No.4
(a) Batter pile-supported wharf structure
-1200 -800 -400 0 400 800 1200
-6000 -3000 0 3000 6000
Axi
al
fo
rce
/k
N
Moment /kN·m
Tensile limit (788kN)
Compressive limit (-3927kN)
Mp-N
My-N
Pile No.1
-1200 -800 -400 0 400 800 1200
-6000 -3000 0 3000 6000
Axi
al
fo
rce
/k
N
Moment /kN·m
Compressive limit (-4592kN) Tensile limit
(946kN)
My-N
Mp-N
Pile No.2
-1200 -800
-400
0
400
800
1200
-6000
-3000
0
3000
6000
Axi
al
fo
rce
/k
N
Moment /kN
·
m
M
p-N
M
y-N
Tensile limit
(998kN)
Compressive limit
(-4592kN)
Pile No.3
-1200 -800 -400 0 400 800 1200 -6000
-3000 0 3000 6000
Axi
al
fo
rce
/k
N
Moment /kN·m My-N
Mp-N
Tensile limit (1050kN)
Compressive limit (-4592kN)
Pile No.4
Li Jiren, Song Bo and Cui Jianyu /Journal of Engineering Science and Technology Review 8 (5) (2015) 180 - 189
Under ground motion with a PGA of 350 Gal, the two types of structure systems do not meet the full-plastic area, and plastic damage does not occur. As shown in Fig. 7 (a), the responses of the two batter piles of No.4 and No.3 exceed the tensile limit value but are still in the elastic stage. In Fig. 7 (b), the responses of the three vertical piles of No.4, No.3, and No.2 in the vertical pile-supported structure exceed the elastic stage and are in the plastic area. Therefore, under the seismic ground motion of this level and in consideration of the horizontal displacement to be satisfied by the design requirement, the seismic performance of the batter pile-supported structure is better than that of the vertical pile-supported structure.
Under ground motion with a PGA of 1000 Gal, as shown in Fig. 8, the batter piles of the batter pile-supported structure and all the vertical piles of the vertical pile structure exceed the limit load and are in the plastic area. Plastic damage occurs.
-1200 -800
-400
0
400
800
1200
-6000
-3000
0
3000
6000
Axi
al
fo
rce
/k
N
Moment /kN
·
m
Tensile limit
(788kN)
Compressive limit
(-3927kN)
M
y-N
M
p-N
Pile No.1
-1200 -800 -400 0 400 800 1200
-6000 -3000 0 3000 6000
Axi
al
fo
rce
/k
N
Moment /kN·m
Compressive limit (-4592kN) Tensile limit
(946kN)
My-N
Mp-N
Pile No.2
-1200 -800 -400 0 400 800 1200
-6000 -3000 0 3000 6000
Axi
al
force
/
k
N
Moment /kN·m
Tensile limit (998kN)
Compressive limit (-4592kN)
My-N Mp-N
Pile No.3
-1200 -800 -400 0 400 800 1200
-6000 -3000 0 3000 6000
Axi
al
fo
rce
/k
N
Moment /kN·m
Tensile limit (1050kN)
Compressive limit (-4592kN)
My-N Mp-N
Pile No.4
(a) Batter pile-supported wharf structure
-1200 -800 -400 0 400 800 1200
-6000 -3000 0 3000 6000
Axi
al
fo
rce
/k
N
Moment /kN·m
Tensile limit (788kN)
Compressive limit (-3927kN)
My-N
Mp-N
Pile No.1
-1200 -800 -400 0 400 800 1200
-6000 -3000 0 3000 6000
Axi
al
fo
rce
/k
N
Moment /kN·m
Tensile limit (788kN)
Compressive limit (-3927kN)
My-N
Mp-N
Pile No.2
-1200 -800 -400 0 400 800 1200
-6000 -3000 0 3000 6000
Axi
al
fo
rce
/k
N
Moment /kN·m
Compressive limit (-3927kN) Tensile limit
(788kN)
My-N
Mp-N
-1200 -800 -400 0 400 800 1200 -6000
-3000 0 3000 6000
Axi
al
fo
rce
/k
N
Moment /kN·m
Mp-N
Tensile limit (1050kN)
Compressive limit (-4592kN)
My-N
Pile No.4
(b) Vertical pile-supported wharf structure Fig. 8. M–N relation curve of the pile top (PGA = 1000 Gal)
During the two different types of ground motions, the batter piles in the batter pile-supported structure play a dominant role in bearing the seismic load. Consequently, the vertical piles near the sea side are not in the plastic area, and plastic hinge does not occur. By contrast, all piles in the vertical pile-supported structure enter the plastic area (PGA = 350 Gal) or reach full plasticity (PGA = 1000Gal), and plastic damage occurs. The axial tension and pressure in batter piles play a major role in the batter pile-supported structure. Under the same ground motions, the moment value in the batter pile-supported structure is thus smaller than that in the vertical pile-supported structure. From the M–N relation curve, the moment in the vertical pile-supported structure plays a dominant role, and the variation range of the value is larger than that in the batter pile-supported structure.
4.3 Plastic damage and failure process
According to the limit-bearing capacity analysis, the sequence and the timing of the pile failure process under seismic ground motion can be obtained and reflected in the acceleration and displacement relation curve, as shown in Fig. 9. With an increase in acceleration and displacement, except the vertical piles in the batter pile-supported structure, the other piles from the land side to the sea side approach the plastic stage sequentially, and plastic damage occurs.
-150 -100 -50 0 50 100 150 -2400
-1600 -800 0 800 1600 2400
᰷
Piles No.4 and No.3 entered full-plastic area
Piles No.4 and No.3 entered plastic stage Pile No.4
reached tensile limit
Pile No.3 Pile No.4
Acce
le
rati
o
n
/
Gal
Relative diplacement /mm Pile No.3
reached tensile limit
(a) Batter pile-supported wharf structure
-300 -200 -100 0 100 200 300 -900
-600 -300 0 300 600 900
᰷
Pile No.1 entered plastic stage Pile No.1 entered full-plastic area
Piles No.4, No.3 and No.2 entered full-plastic area
Pile No.4 Pile No.3 Pile No.2 Pile No.1
Accel
erat
io
n /
Gal
Relative diplacement /mm (b) Vertical pile-supported wharf structure
Fig. 9. Acceleration–displacement relation curve of the pile top (PGA = 1000 Gal)
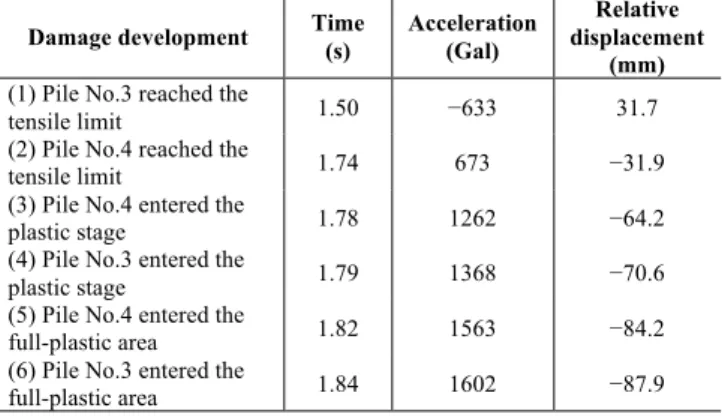
Under ground motion with a PGA of 1000 Gal, the batter piles (piles No.3 and No.4) in the batter pile-supported structure reach the tensile limit at accelerations of 630 and 670 Gal. When the acceleration of the pile top reaches 1560 and 1600 Gal, full plasticity occurs. The timing of the damage and the failure process for the batter piles is shown in Table 3.
Table 3. Timing of the damage development of the batter pile-supported structure (PGA = 1000 Gal)
Damage development Time (s) Acceleration (Gal)
Relative displacement
(mm) (1) Pile No.3 reached the
tensile limit 1.50 −633 31.7 (2) Pile No.4 reached the
tensile limit 1.74 673 −31.9 (3) Pile No.4 entered the
plastic stage 1.78 1262 −64.2 (4) Pile No.3 entered the
plastic stage 1.79 1368 −70.6 (5) Pile No.4 entered the
full-plastic area 1.82 1563 −84.2 (6) Pile No.3 entered the
full-plastic area 1.84 1602 −87.9
The piles of No.4 and No.3 in the vertical pile-supported wharf approach the plastic stage and enter the full-plastic area, respectively, when the acceleration reaches 330 and 360 Gal approximately. When the acceleration reaches 400 Gal, pile No.2 reaches the plastic stage and enters the full-plastic area immediately. The pile No.1 near the sea side enters the full-plastic area when the acceleration reaches 580 Gal. The pile top displacement rapidly increases. The timing of the damage and the failure process for the vertical pile-supported structure is shown in Table 4.
Table 4. Timing of the damage development of the vertical pile-supported structure (PGA = 1000 Gal)
Damage development Time (s) Acceleration (Gal)
Relative displacement
(mm) (1) Pile No.4 entered the
full-plastic area 1.92 332 −102.1 (2) Pile No.3 entered the
full-plastic area 1.93 360 −112.6 (3) Pile No.2 entered the
plastic stage 1.94 389 −112.8 (4) Pile No.2 entered the
full-plastic area 1.95 415 −132.7 (5) Pile No.1 entered the
plastic stage 2.95 547 −203.7 (6) Pile No.1 entered the
Li Jiren, Song Bo and Cui Jianyu /Journal of Engineering Science and Technology Review 8 (5) (2015) 180 - 189
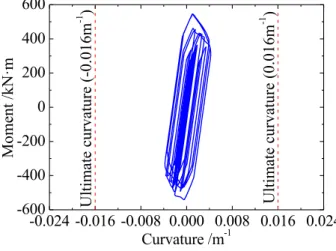
Comparison of the damage and the failure process of the two structure systems indicates that the timing of the damage and the failure process of the vertical pile-supported structure is later than that of the batter pile-supported structure. Therefore, the plastic damage that occurs in the batter pile-supported structure is prior to that in the vertical pile-supported structure. Comparison of the moment– curvature (M–Ф) hysteresis curve of the two structures in Fig. 10 presents that the vertical pile-supported structure has enough capacity for plasticity development to absorb and dissipate seismic energy in contrast to the batter pile-supported structure. Therefore, under the seismic ground motion of this level, the seismic performance of the vertical supported structure is superior to that of the batter pile-supported structure.
-0.024 -0.016 -0.008 0.000 0.008 0.016 0.024
-600
-400
-200
0
200
400
600
Ulti
mat
e
cu
rvat
u
re
(0
.0
1
6
m
-1 )
Ulti
mat
e
cu
rvat
u
re
(-0.0
1
6
m
-1 )
Mo
men
t
/k
N
·
m
Curvature /m
-1 (a) Batter pile-supported wharf structure-0.024 -0.016 -0.008 0.000 0.008 0.016 0.024
-1500
-1000
-500
0
500
1000
1500
Mo
men
t
/k
N
·
m
Curvature /m
-1Ulti
mat
e
cu
rva
tu
re
(-0.
0
1
6
m
-1 )
Ulti
mat
e
cu
rva
tu
re
(0
.0
1
6
m
-1 )
(b) Vertical pile-supported wharf structure
Fig. 10. M–Φ relation curve of the top of pile No.4 (PGA = 1000 Gal)
5. Conclusions
On the basis of the nonlinear finite element analysis, we compare the seismic dynamic damage characteristics of vertical and batter pile-supported structures under the same construction site, service, and geological conditions. The results are as follows:
(1) The effect of the maximum displacement under the same ground motion on the batter pile-supported structure is smaller than that on the vertical pile structure. According to the calculation results of the dynamic time history response analysis, the maximum displacement of the vertical supported structure is more than two times of the batter pile-supported structure.
(2) Under the two different types of seismic ground motions, the batter piles in the batter pile-supported structure play a dominant role in bearing the seismic load. Therefore, the vertical piles near the sea side do not approach the plastic area, plastic hinge does not occur. By contrast, all piles in the vertical pile-supported structure enter the plastic area or reach full plasticity, and plastic damage occurs.
(3) The axial tension and pressure in batter piles play a major role in the batter pile-supported structure. Under the same ground motions, the moment value in the batter pile-supported structure is thus smaller than that in the vertical supported structure. The moment in the vertical pile-supported structure also plays a dominant role, and the variation range of the value is larger than that of the batter pile-supported structure.
(4) Under ground motion with a PGA of 350 Gal, all piles in the batter pile-supported structure remain in the elastic stage, whereas the batter piles exceed the tensile limit. The responses of the three vertical piles near the land side in the vertical pile-supported structure enter into the plastic stage. Therefore, under the seismic ground motion of this level and in consideration of the horizontal displacement to be satisfied by the design requirement, the seismic performance of the batter pile-supported structure is better than that of the vertical pile-supported structure.
(5) Under ground motion with a PGA of 1000 Gal and on the basis of the comparison of the damage process and the M–Ф hysteresis curve of the two structure systems, the vertical pile-supported structure has enough capacity for plasticity development to absorb and dissipate seismic energy compared with the batter pile-supported structure. Therefore, under the seismic ground motion of this level, the seismic performance of the vertical pile-supported structure is superior to that of the batter pile-supported structure.
Acknowledgements
This study was supported by the National Natural Science Foundation of China (No.51078033 and No.51178045).
______________________________
References 1. Liu, H. X., “Tangshan earthquake”. Beijing: Earthquake Publish
Company, 1986.
2. Mondal, G., Rai, D. C., “Performance of harbour structures in Andaman Islands during 2004 Sumatra earthquake”. Engineering Structures, 30, 2008, pp. 174-182.
3. Professional Standard of the People’s Republic of China, “JST146-2012 Code for Seismic Design of Water Transport Engineering”.
4. Shafieezaedeh, A., Desroches, R., Ramanathan, K., “Developing fragility curves for a typical pile-supported wharf structure”.
ECCOMAS Thematic Conference - COMPDYN 2011: 3rd International Conference on Computational Methods in Structural Dynamics and Earthquake Engineering: An IACM Special Interest Conference, Programme, 2011.
5. Wang, G. S., Huang, F. K., Huang, C. L., “Seismic fragility analysis framework for pile-supported wharf”. Proceedings of the International Offshore and Polar Engineering Conference, 2011, pp. 516-523.
6. Jaradat, O. A., Priestley, M. J. N., “Displacement-based procedures for seismic design of pile-supported wharvesat the port of Los Angeles and the port of Long Beach”. American Concrete Institute, ACI Special Publication, 295, 2012, pp. 42-61.
7. Shafieezadeh, A., Kosbab, B. D., Desroches, R., Leon, R. T., “Dynamic interaction behavior of pile-supported wharves and container cranes in liquefiable soil embankments”. Structures Congress 2012 - Proceedings of the 2012 Structures Congress, 2012, pp. 549-558.
8. Thomopoulos, C., Lai, C. G., “Preliminary definition of fragility curves for pile-supported wharves”. Journal of Earthquake Engineering, 16(SUPPL. 1), 2012, pp. 83-106.
9. Elahi, H., Poulos, H. G., Moradi, M., Ghalandarzadeh, A., “Seismic analysis of pile group in soil slopes using pseudostatic approach”.
Geotechnical Special Publication, 225, 2012, pp. 2273-2282.
10. Amirabadi, R., Bargi, K., Torkamani, H. H., “Seismic demands for pile-supported wharf structures with batter piles”. Research Journal of Applied Sciences, Engineering and Technology, 4(19), 2012, pp. 3791-3800.
11. Shafieezadeh, A., DesRoches, R., Rix, G. J., Werner, S. D., “Seismic performance of pile-supported wharf structures considering soil-structure interaction in liquefied soil”. Earthquake Spectra, 28(2), 2012, pp. 729-757.
12. Shafieezadeh, A., DesRoches, R., Rix, G. J., Werner, S. D., “Three-dimensional wharf response to far-field and impulsive near-field ground motions in liquefiable soils”. Journal of Structural Engineering (United States), 139(8), 2013, pp. 1395-1407. 13. Amirabadi, R., Bargi, K., Dolatshahi, P. M., Heidary, T. H.,
Mccullough, N., “Determination of optimal probabilistic seismic demand models for pile-supported wharves”. Structure and Infrastructure Engineering, 10(9), 2014, pp. 1119-1145.
14. Heidary, T., H., Bargi, K., Amirabadi, R., McCllough, N. J., “Fragility estimation and sensitivity analysis of an idealized pile-supported wharf with batter piles”. Soil Dynamics and Earthquake Engineering, 61-62, 2014, pp. 92-106.
15. Ramirez-Henao, A. F., Paul Smith-Pardo, J., “Elastic stability of pile-supported wharves and piers”. Engineering Structures, 97, 2015, pp. 140-151.
16. Japan Road Association. “Specifications for Highway Bridges Part IV Substructures”, 2012, pp. 284-287.