Valéria Silva Cândido BrizonI Karine Laura CortellazziII Fabiana Lima VazquezII
Gláucia Maria Bovi AmbrosanoII Antônio Carlos PereiraII
Viviane Elisângela GomesI Ana Cristina OliveiraI
I Departamento de Odontologia Social e Preventiva. Faculdade de Odontologia. Universidade Federal de Minas Gerais. Belo Horizonte, MG, Brasil
II Departamento de Odontologia Social. Faculdade de Odontologia de Piracicaba. Universidade Estadual de Campinas. Campinas, SP, Brasil
Correspondence:
Valéria Silva Cândido Brizon
Faculdade de Odontologia de Piracicaba – Unicamp
Av. Limeira, 901- Areião - CP 52 13414-903 Piracicaba, SP, Brasil E-mail: valer iabrizon@hotmail.com Received: 06/17/2012
Approved: 03/04/2013
Article available from: www.scielo.br/rsp
Individual and contextual factors
associated with malocclusion in
Brazilian children
ABSTRACT
OBJECTIVE: To assess the association between the prevalence of malocclusion in Brazilian 12 years-olds with individual and contextual variables.
METHODS: A cross-sectional, analytical study was conducted with data from the Brazilian Oral Health Survey – SBBrazil 2010. The outcome studied was malocclusion, categorized as absent, set, severe and very severe. The independent variables were classifi ed as individual and contextual. Data were analyzed using a multilevel model with a 5% signifi cance level.
RESULTS: It was found that the prevalence of severe and very severe malocclusion in 12-year-olds did not differ between the Brazilian regions, although variation between the cities was signifi cant (p < 0.001). Male children (p = 0.033), those on lower income (p = 0.051), those who had visited a dentist (p = 0.009), with lower levels of satisfaction with mouth and teeth (p < 0.001) and embarrassed to smile (p < 0.001) had more severe malocclusion. The characteristics of the cities also affected the severity of malocclusion; cities with more families on social benefi ts per 1,000 inhabitants, with lower scores on the health care system performance index and lower gross domestic product per capita were signifi cantly associated with malocclusion.
CONCLUSION: Signifi cant associations between the presence and severity of malocclusion were observed at the individual and contextual level.
The epidemiological profi le of oral health problems has changed, especially in children aged 12. In Brazil, tooth decay has shown a decrease in the DMFT index (decayed, missing and fi lled teeth) from 6.7 in 1986 to 2.07 in 2010 and, currently, a signifi cant number of those children are free of caries (43.5%).a Therefore,
other problems related to the oral cavity have begun to receive attention, among them, occlusal changes stand out.14 Due to its high prevalence, the World Health
Organization (WHO) now considers malocclusion to be the third largest public health problem in dentistry.9,10
National data relating to malocclusion indicate a preva-lence of 40.0% for the index age of 12 years. For severe, and very severe malocclusion, the prevalence is 10.4% and 7.1% respectively.a In many cases, malocclusion
can impact on the quality of life of this part of the popu-lation. It can produce aesthetic deviations in the teeth and/or face and functional disturbances of occlusion, chewing, swallowing, pronunciation and breathing. It can also cause psychosocial disorders with potential repercussions on the self-esteem and interpersonal relationships of severely affected individuals. 5
In the face of this reality, there is a need for a clearer picture in order to understand the disease process in relation to malocclusion. Thus, in addition to individual factors, other factors, called modifi ers or modulators (social, economic, cultural, ethnic/racial, psychological and behavioral factors), are related to the health of the population. Currently, these factors are known as social determinants of health. 12
In contextual terms, some health indicators and social factors may contribute to better identifying groups or individuals vulnerable to diseases. Among these indicators, the Human Development Index (HDI) is a comparative measure used to rank countries by their level of “human development”.b
Another indicator would be the “Bolsa Família” (BF, Family Allowance), a program of direct income transfer that benefits families (about 16 million Brazilians – 8.5% of the general population) with per capita income below 70 reais per month, based on the guaranteed income, productive inclusion and access to public services,c which represents the state of
vulner-ability directly linked to economic development. The INTRODUCTION
Performance Index of the Brazilian public health system (IDSUS, Índice de Desempenho do Sistema Único de Saúde),d the score of which varies between zero to ten,
evaluates the access and quality of health services. The lowest scores represent the worst performances of SUS for Brazil and for each county and state.¹
In order to better understand the factors closely related to the problem, the aim of this study was to evaluate the association between the prevalence of malocclu-sion in Brazilian 12-year-olds with individual and contextual variables.
METHODS
This was a cross-sectional analytical study. Data from the national epidemiological survey of oral health (SBBrasil 2010) were used. a This
epidemio-logical survey examined the oral health status of the population in different age groups in urban and rural areas. Brazil has a total of 190,755,799 individuals, 3,402,242 of those are children aged 12.e There were
37,519 individuals examined in the 26 state capitals, the Federal District and 150 municipalities with different population sizes.
The database generated in this research is in the public domain and is freely accessible on the Ministério da Saúde webpage.e
Data collection was performed in the home, including oral examinations and interviews using a structured questionnaire. The oral health teams were composed of an examiner – a dental surgeon, and an auxiliary note taker. For the clinical examination, instruments recommended by the WHO were used (mouth mirror and Community Periodontal Index CPI dental probe).9
The presence of malocclusion was recorded using the Dental Aesthetic Index (DAI), categorized as: normal, set, severe and very severe.4 The basic principle of the
DAI is a combination of measures that together express the occlusal state of the individual and the associ-ated need for orthodontic treatment, which considers aesthetic commitment, beyond occlusion. Altogether, there are 11 steps, considering three major dimensions to be assessed: dentition, space and occlusion itself.
a Ministério da Saúde (BR). Secretaria de Vigilância em Saúde. Secretaria de Atenção à Saúde. Coordenação Nacional de Saúde Bucal. SB2010: Pesquisa Nacional de Saúde Bucal. Resultados principais. Brasília (DF); 2011[cited 2012 Feb 08]. Available from: http://dab.saude. gov.br/cnsb/sbbrasil/download.htm
b Programa das Nações Unidas para o Desenvolvimento. Desenvolvimento Humano e IDH. Brasília (DF); 2012[cited 2012 Mar 10]. Available from: http://www.pnud.org.br/idh/
c Ministério do Desenvolvimento Social e Combate à Fome (BR). Programa Bolsa Família. Brasília (DF); 2012 [cited 2012 Mar 15]. Available from: http://www.mds.gov.br/bolsafamilia
d Ministério da Saúde (BR). IDSUS - Índice de Desempenho do Sistema Único de Saúde. Brasília (DF); 2011 [cited 2012 Mar 08]. Available from: http://portal.saude.gov.br/portal/saude/area.cfm?id_area=1080
The sampling technique used by SBBrasil 2010 was probabilistic cluster sampling. For 12-year-olds, three strata were used: the fi rst used domains and the primary sampling units: capital and interior municipalities according to macro region. The second consisted of the subdivision of the participating municipalities: 27 capitals plus 30 municipalities in each macro region. And the third was done by random selection to ensure the representativeness of the municipalities, census tracts and households.
Between 1 and 250 participants were evaluated per city in 172 cities around Brazil, totaling 7,328 children aged 12, with a sample loss of 8.4 %. To calculate the sample size, the parameters used (z value, variance, mean of the DMFT, acceptable margin of error, design effect and non-response rate) were those from the SBBrasil 2003.f
The fi eld teams were properly trained in workshops. The calibration technique adopted was consensus, calculating the correlation between each examiner and the results obtained by team consensus. The model proposed by the WHO was taken as a reference. The weighted kappa coeffi cient was calculated for each examiner, age group and health problem studied, with the minimum acceptable value of 0.65. For DAI, the WHO recommends the minimum value of 0.85 for inter-examiner and 0.95 to intra-examiner for the evaluation. a
The outcome studied was malocclusion, measured by DAI, calculated as follows:
DAI = (missing teeth x 6) + (API) + (ESP) + (DI x 3) + (DMXA) + (DMDA) + (OMXA x 3) +
(OMDA x 4) + (MAA x 4) + (RMAP x 3) + 13
Codes and weights were defi ned as follows:
API: crowding in the incisal segment weight 1; ESP: incisal segment spacing Weight 1; DI: incisal diastema weight 3, DMXA: anterior maxillar misalignment weight 1, DMDA: anterior mandibular misalignment weight 1, OMXA: anterior maxillar overjet Weight 3, OMDA: anterior mandibular overjet weight 4, MAA: vertical anterior open bite weight 4 and RMAP: antero-posterior molar relation weight 3.
Thus, the scores are calculated and distributed according to the severity of the malocclusion and the need for orthodontic treatment as follows: absent (DAI < 25), set (DAI 26-30), severe (31-35 DAI) and very severe (DAI ≥ 36).4
The HDI, a measure that gathers information on longevity, income and schooling, was used for contex-tual characterization.b
f Ministério da Saúde (BR). Secretaria de Atenção à Saúde. Projeto SB Brasil 2003: condições de saúde bucal da população brasileira 2002-2003. Resultados principais. Brasília (DF); 2004[cited 2012 Feb 08]. Available from:http://dtr2001.saude.gov.br/editora/produtos/livros/ pdf/05_0053_M.pdf
BF was obtained by the number of families receiving it for every 1,000 inhabitants in the municipality, aiming to standardize and facilitate comparison with other municipalities.c
The IDSUS register was achieved using the score that the municipality received from the evaluation and the number of homogeneous group into which the munici-pality was grouped.d
The gross domestic product (GDP) per capita is the sum of the salaries of the entire population of the municipality divided by the number of inhabitants.e
Data were dichotomized into municipalities with and without fl uoride in tap water.e
In the descriptive analysis, the data were evaluated by the chi-squared test. The multilevel model was made up of fi xed components (known variables) and random components (cities and variances at different levels). 21
Adjustments to the multilevel model were performed using the PROC MIXED procedure from the SAS statistic program (SAS Institute Inc. 9.2, 2008) according to the methodology described in Singer15
(1998) and Tellez et al16 (2006).
At level 1, the variables related to individuals were consid-ered. At level 2 the variables were those related to cities, evaluating the behavior of the variable malocclusion (level 1) as a function of the predictor variables for levels 1 and 2.
Initially, one model was adjusted only with the intercept (model 1). Then the effects of individual-level predic-tors (level 1) – Model 2 – and cities (level 2) – Model 3 were included. In the selection of contextual variables indicators related to access to and quality of health services (IDSUS), socioeconomic conditions (HDI and GDP per capita) and social vulnerability (BF) were taken into consideration.
The quality of the adjustments was evaluated using the convergence model, criteria from Akaike information criterion and Akaike information criterion corrected, and statistics – twice times the logarithm of the likelihood function. All analyses used a 5% level of signifi cance. The Project SBBrasil 2010 followed the standards set by the Declaration of Helsinki and was approved by the Conselho Nacional de Ética em Pesquisa, record no. 15,498, January 7th, 2010.
RESULTS
statistical differences between regions, ranging from 17.8% in the North to 22.0% in the South, with a national mean of 19.8%. However, there was no statistically signifi cant difference in the distribution of percentages of categories between different macro regions of the country (p < 0.0176) (Table 1). Very severe malocclu-sion was identifi ed in 9.4 % of the children examined. The descriptive analysis of the independent variables (frequency and percentage) can be seen in Table 2. Most of those examined (76.1%) lived in the capitals, while there was a balance between the different genres examined, basically half (51.3%) needed some kind of treatment, 75 % came from families with incomes below R$1,500, less than 5% came from families where the head of the household was attending a university course or had a university degree. As regards health variables, 23.7% reported having had toothache in the last six months, 81.6% had access to a dentist, the majority (60.1%) were satisfi ed with their teeth, while problems related to diffi culty, discomfort or
embarrassment related to the teeth and oral environment had little prevalence. Regarding contextual variables, the majority of participants (62.5%) lived in cities with high levels of socioeconomic development and 79.3% lived in cities with fl uoridated tap water.
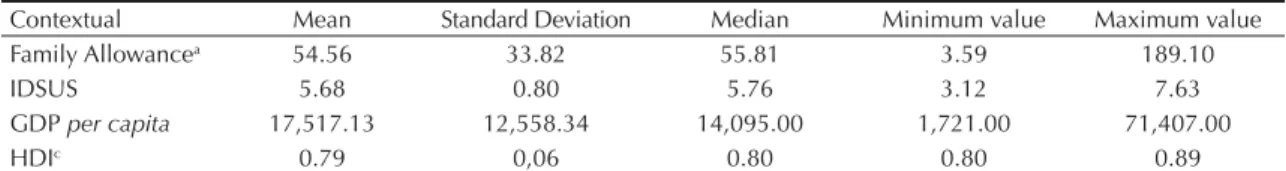
The cities of the participants had, on average, 54.56 families receiving benefi ts per 1,000 households. While the mean IDSUS was 5.68 (as a reference, 7 would be the limit for adequate performance according to the SUS), the mean per capita GDP was R$17,517 and mean HDI was 0.79, which is considered good (Table 3).
As for the multilevel analysis, Model 1 shows that the average index score for malocclusion in cities was 1.68 with a standard error of 0.03 (Table 4). The malocclu-sion variation between cities was signifi cant (p < 0.001), but the variation between participants within cities was about 15 times larger than the variation between cities. According to the intra-class correlation coeffi cient, it can be affi rmed that the variation between cities represented approximately 6.0% of the total variation. Table 1. Distribution of children aged 12 according to prevalence and severity of malocclusion. SBBrasil, 2010.
Region Malocclusion p-value
Absent Set Severe Very Severe Total
North 962 327 131 147 1,567 0.0176a
61.4% 20.9% 8.4% 9.4% 100,0%
Northeast 959 311 173 164 1,607
59.7% 19.4% 10.8% 10.2% 100,0%
Southeast 617 245 139 97 1,098
56.2% 22.3% 12.7% 8.8% 100,0%
South 330 124 68 60 582
56.7% 21.3% 11.7% 10.3% 100,0%
Central-West 506 196 84 70 856
59.1% 22.9% 9.8% 8.2% 100,0%
Total 3,374 1,203 595 538 5,710
59.1% 21.1% 10.4% 9.4% 100,0%
a Chi-squared test
Table 2. Frequency and percentage by category of qualitative independent variables. SBBrasil, 2010.
Variable Frequency Percentage (%)
Demographic
Domain
Capital 5,578 76.12
Interior 1,750 23.88
Region
North 1,743 23.79
Northeast 2,041 27.85
Southeast 1,342 18.31
South 1,010 13.78
Central-West 1,192 16.27
Sex
Male 3,639 49.66
Female 3,689 50.34
Continuation Skin color
White 2,897 39.53
Brown 712 9.72
Yellow 144 1.97
Dark brown 3,513 47.94
Indigenous 62 0.85
Oral health problems
Trauma
No trauma 5,630 78.11
Enamel Fracture 1,282 17.79
Enamel/dentine fracture 262 3.63
Fracture with pulp exposure 21 0.29
Absence due to trauma 13 0.18
Treatment necessity
Not necessary 3,528 48.68
Necessary 3,719 51.32
Socioeconomic
Number of Individuals
0 1 0.01
1 11 0.15
2 235 3.21
3 1,079 14.76
4 2,264 30.97
5 1,745 23.87
6 889 12.16
7 477 6.52
8 258 3.53
9 141 1.93
> 10 211 2.89
Number of rooms
0 2 0.03
1 539 7.37
2 2,560 35.02
3 1,931 26.42
4 778 10.64
5 602 8.24
6 397 5.43
7 231 3.16
8 121 1.66
9 68 0.93
>10 81 1.08
Number of consumer goods
0 042 0.58
1 105 1.45
2 138 1.90
3 390 5.37
4 877 12.07
5 1,102 15.17
6 1,070 14.73
7 989 13.61
8 852 11.73
9 528 7.27
10 394 5.42
11 779 10.72
Continuation
Income per capita (R$)
Below 250.00 313 4.52
251.00 to 500.00 1,084 15.64
501.00 to 1,500.00 3,694 53.31
1,501.00 to 2,500.00 1,082 15.62
2,501.00 to 4,500.00 494 7.13
4,501.00 to 9,500.00 196 2.83
over 9,500.00 66 0.95
Years of Schooling
0 19 0.26
1 42 0.58
2 75 1.03
3 235 3.22
4 727 9.95
5 1,432 19.61
6 2,241 30.69
7 1,503 20.58
8 625 8.56
9 202 2.77
10 85 1.16
11 49 0.67
12 34 0.47
13 7 0.10
14 5 0.07
15 22 0.30
Schooling, morbidity and use of orthodontic services Self-perception and impact on health
Perception of need for treatment
No 2,228 32.07
Yes 4,720 67.93
Toothache (last 6 months)
No 5,559 76.29
Yes 1,728 23.71
Severity of pain (intensity – from 1 to 5)
1 244 14.49
2 323 19.18
3 485 28.8
4 277 16.45
5 355 21.08
Dentist appointment
No 1,337 18.43
Yes 5,918 81.57
Frequency of appointments
Less than one year 3,570 61.19
From 1 to 2 years 1,669 28.61
3 years or more 595 10.20
Where was your last dental appointment?
Public Service 3,207 54.59
Private Service 1,898 32.31
Health plan/Agreements 690 1.74
Other 80 1.36
Reason for appointment
Check-up 2,172 37.05
Pain 748 12.76
Extraction 708 12.08
Treatment 2,082 35.52
Other 152 2.59
Continuation
Level of satisfaction with teeth
Very satisfi ed 798 11.10
Satisfi ed 3,522 49.01
Neither satisfi ed nor dissatisfi ed 1,215 16.91
Dissatisfi ed 1,540 21.43
Very Dissatisfi ed 111 1.54
Diffi culty eating
No 6,067 83.26
Yes 1,220 16.74
Discomfort when brushing
No 6,382 87.54
Yes 908 12.46
Nervousness and irritation
No 6,513 89.46
Yes 767 10.54
Infl uence on leisure
No 6,860 94.05
Yes 434 5.95
Infl uence on sport
No 6992 95.82
Yes 305 4.18
Diffi culty talking
No 6,959 95.42
Yes 334 4.58
Embarrassed to smile
No 6,297 86.40
Yes 991 13.60
Diffi culty working/studying
No 6,920 94.85
Yes 376 5.15
Diffi culty sleeping
No 6,653 91.26
Yes 637 8.74
Contextual
Homogenous groups
High IDSE¹ and High MAC² 4,581 62.51
High IDSE and Medium MAC 1,297 17.70
Medium IDSE and Low MAC 436 5.95
Low IDSE and Low MAC 394 5.38
Medium IDSE and No MAC 277 3.78
Low IDSE and No MAC 343 4.68
Fluoridated tap water
No 1,433 20.67
Yes 5,501 79.33
When the individual level variables (model 2) were included, it was observed that male children (p = 0.03), with lower income (p = 0.05), who visited the dentist (p = 0.01), showing less satisfaction with mouth and teeth (p < 0.001) and feeling embarrassed to smile (p < 0.001) had the highest average index score for malocclusion. All these signifi cances were controlled by the other predictors in the model.
In model 3 the variables of the second level (cities) were included in order to evaluate their infl uence in explaining the variability of malocclusion. It was found that the characteristics of the cities with the highest number of families receiving BF per 1,000 inhabitants, the worst scoring IDSUS and those with lower GDP per capita
were associated with severity of malocclusion. All these signifi cances were controlled by the signifi cant predictor variables of the individual and cities.
DISCUSSION
Knowing the oral health status of population groups through epidemiological surveys is critical to the devel-opment of proposed actions appropriate to their needs and risks, as well as the possibility of comparisons that, retrospectively, allow the impact of these actions to be assessed, to plan and run services with equity.
The decline in dental caries, still the most prevalent oral health problem, allowed a new planning for oral health by health managers, bringing a new look at other problems, mainly due to increased awareness and expectations regarding oral health or increased availability of dental treatment.2 In this context,
orthodontics was deemed eligible to access both the private and the public sector, due to its high preva-lence, impact on aesthetics and infl uence on some respiratory problems, for example.
In Brazil, the most recent epidemiological studies concerning the population’s oral health, which took place in 2003 and 2010, showed a 19.3% reduction in the frequency of malocclusion, ranging from 58.1% to 38.8% at 12 years of age. In relation to severity, in 2003 the prevalence of the severe condition was 15.7% and very severe 20.7%. In 2010, for the same
conditions, there was a reduction of 5.3% and 13.6%, respectively.a,f Even with a decline in the prevalence
of malocclusion in children aged 12, this involvement can still be considered a public health issue.
Furthermore, the infl uence of lifestyle on levels of health and the quality of life of different popula-tion groups, including children and adolescents, is widely documented in the literature of health area.8
In this sense, the survey, monitoring and intervention concerning health risk behaviors are considered public health priorities by various health agencies.3
The results obtained in this study show an associa-tion of individual level variables with the severity of malocclusion. Males presented a higher severity of malocclusion compared with females, corroborating other fi ndings in the literature that revealed gender exerted a signifi cant infl uence on the severity of the disease.2,8 It is believed that this has happened due
to the fact that women are more determined when treating health problems.
There was a higher severity of malocclusion observed in those children who claimed to be less satisfi ed with their mouth and teeth and feel embarrassed to smile. However, it seems reasonable that self-perception does not coincide with the actual situation of malocclu-sion, because the problem is not impacting on cultural precepts but seen as an attribute of beauty and mascu-linity or femininity, as observed in occidental culture.19
So the infl uence of these factors depends on the cultural and social characteristics of each population group.
These fi ndings suggest that, according to the severity of the malocclusion, self-perceived need for orthodontic treatment among children can be predicted. Namely, the self-perception in children should be seen as fundamentally important in understanding the impact of malocclusion on daily life, especially in relation to functional limitations and psychosocial well-being, since it greatly values the physical appearance.19
With regard to access, the results of this study show greater severity of malocclusion in those children who have visited the dentist at least once in their lives. According to Peres et al11 (2008), there is an increased
Table 3. Mean, standard deviation, median, minimum and maximum value of quantitative contextual variables. SBBrasil, 2010. (In R$)
Contextual Mean Standard Deviation Median Minimum value Maximum value
Family Allowancea 54.56 33.82 55.81 3.59 189.10
IDSUS 5.68 0.80 5.76 3.12 7.63
GDP per capita 17,517.13 12,558.34 14,095.00 1,721.00 71,407.00
HDIc 0.79 0,06 0.80 0.80 0.89
a Number of benefi ciary households for every 1,000 inhabitants.
use of dental services and a reduction in the proportion of people who had never consulted a dentist. Although different health needs cannot be fully eliminated only with the use of health services, they can facilitate qualifi ed access and reduce health inequalities.12 It
is probable that those with access to a dentist usually have a higher need for treatment, including orthodontic.
The results showed that, within the individual context, children in the group with the lowest incomes had a higher severity of malocclusion, corroborating reports in the literature regarding the infl uence of socioeco-nomic factors in determining malocclusion.6,12,17
Using multilevel analysis was due to the importance of investigating interactions between variables on different levels (individual and contextual), which showed greater statistical effi ciency, more power and less bias than the one contained in a multivariate analysis as the logistic regression.7
The study highlighted the infl uence of variables related to the socioeconomic context on the severity of maloc-clusion. Cities with more families receipients of BF, with lower IDSUS and lower GDP per capita were associated with severe malloclusion. Over the past two decades, social inequalities in health have become, one of the most important issues in public health, both in rich countries and those with medium or low economic income.12 Some
authors have emphasized that the most vulnerable house-holds are more susceptible to malocclusion.17
Specifi cally in relation to malocclusion, Tomita et al18
(2000) developed a theoretical model that posits the infl uence of socioeconomic factors on malocclusion through oral habits psychological factors and general patterns of disease. Conceptual models allow us to clarify that socioeconomic factors and access-to-service factors can infl uence exposure to and develop-ment of oral health problems.1,20
Although the design of the SBBrasil was robust, the study has some limitations. A weakness of cross-sectional studies is the diffi culty in establishing causal relation-ships based on a cross section of time, limiting confi -dence in establishing the direction of the association. The design of the study and the evaluation tool used to quantify malocclusion do not identify for how long the individuals surveyed have suffered from the disease.
This information may be helpful in better understanding the role of individual variables and contextual infl uences concerning malocclusion as an individual, episodic or cyclic condition. Thus, longitudinal studies are needed to allow a better understanding of the association between malocclusion and individual and contextual variables. Another limitation is tooth decay, which was not used in the model due to it being a confounding factor in the study, especially in the question ascertaining whether adolescents have already been to the dentist.
Although there are data available on the prevalence and severity of malocclusion, the sample calculation was based on parameters for dental caries, which is Table 4. Multi-level models for individual and contextual variables for malocclusion in adolescents aged 12. SBBrasil, 2010.
Model 1 Model 2 Model 3
Intercept only Level 1 variables Complete model
Estimate
p-value Estimated p-value Estimated p-value
(Standard error) (Standard error) (Standard error)
Level 1 variables (individual)
Intercept 1.689 (0.029) < 0.001 1.425 (0.077) < 0.001 0.955 (0.193) < 0.001
Sex
(Refa Female) 0.056 (0.026) 0.033 0.059 (0.026) 0.032
Income (Ref. more than R$ 9,500.00) 0.026 (0.013) 0.051 0.025 (0.013) 0.005
Consultationb (Ref. Yes) -0.090 (0.034) 0.009 -0.881 (0.034) 0.011
Satisfaction (Ref. Very satisfi ed) 0.115 (0.014) < 0.001 0.114 (0.014) < 0.001
Ashamed to smile (Ref. No) 0.267 (0.042) < 0.001 0.267 (0.042) < 0.001
Level 2 variables (cities)
Family Allowance (Ref. less allowance) 0.001 (0.001) 0.018
IDSUS (Ref. higher IDSUS) 0.054 (0.028) 0.054
GDP per capita (Ref. higher PIB) 5.89 x 10⁻⁶
(3.04 x 10⁻⁶)
0.052
Variances
Variance between cities 0.062 (0.015) < 0.001 0.058 (0.014) < 0.001 0.053 (0.014) 0.001
Variance between participants in city 0.945 (0.028) < 0.001 0.921 (0.018) < 0.001 0.921 (0.018) < 0.001
a Ref: reference
b Appointment: Have you ever visited a dentist?
kept as a benchmark as it is among the most signifi cant diseases of the oral cavity. Moreover, it is the only one that has available data for all age groups, and its prevalence and severity generate sample sizes that permit proper inferences for other health problems.a
Despite signifi cant advances in recent years in improving health indicators, Brazil is still among the countries with the greatest inequalities, in other words health inequali-ties between population groups are systematic and signifi cant, but avoidable, unfair and unnecessary. These health inequalities are the product of great inequali-ties between different social and economic stratum of Brazilian population.11 The main challenges for the future
will be translating existing knowledge and experiences of effective prevention and health promotion programs into strategic action, in order to achieve sustainable advances in oral health, thereby reducing inequalities.13
Based on the contextual variables, it is suggested, therefore, that government incentives could be aimed at cities with the worst SUS structuring and with greater vulnerability, using, for example, the Ministerial Decree no. 718/SAS from 20/12/2010, which differentiates funding for specialized procedures in orthodontics.g
Identifi cation of risk factors for malocclusion must take into account individual variables together with the contextual variables, building a clearer epidemiological picture capable of planning actions in oral health.
Significant associations between the presence and severity of malocclusion were observed at the indi-vidual and contextual level, those being important parameters that can assist in the planning of public poli-cies under the reference of the constitutional principles of comprehensiveness and equity.
1. Ben-Shlomo Y, Kuh D. A life course approach to chronic disease epidemiology conceptual models, empirical challenges and interdisciplinary
perspectives. Int J Epidemiol. 2002;3(2):285-93.
DOI: 10.1093/ije/31.2.285
2. Carvalho DM, Alves JB, Alves MH. Prevalence of malocclusion in schoolchildren with low
socioeconomic status. Rev Gaucha Odontol.
2011;59(1):71-7.
3. Centers for Disease Control and Prevention. Youth risk behavior surveillance- United States, 2005. MMWR. 2006;55(SS-5).
4. Cons NC, Jenny J, Kohout FJ. DAI: the dental aesthetic index. Iowa City: College of Dentistry, University of Iowa; 1986.
5. Danaei SM, Salehi P. Association between normative and self-perceived orthodontic treatment need among
12- to 15-year-old students in Shiraz, Iran. Eur J
Orthod. 2010;32(5):530-4. DOI: 10.1093/ejo/cjp139
6. Doğan AA, Sari E, Uskun E, Sağlam AMŞ. Comparison of
orthodontic treatment need by professionals and parents
with different socio-demographic characteristics. Eur J
Orthod. 2010;32(6):672-6. DOI: 10.1093/ejo/cjp161
7. Hox JJ. Multilevel analysis: techniques and applications. Mahwah: Lawrence Erlbaum Associates; 2002. 8. Manzanera D, Montiel-Company JM, Almerich-Silla JM,
Gandía JL. Diagnostic agreement in the assessment of orthodontic treatment need using the Dental Aesthetic
Index and the Index of Orthodontic Treatment Need. Eur
J Orthod. 2010;32(2):193-8. DOI: 10.1093/ejo/cjp084
9. World Health Organization. Health through oral health: guidelines for planning and monitoring for oral health care. London; 1989.
10. Organização Mundial da Saúde. Levantamento epidemiológico básico de saúde bucal. 3. ed. São Paulo; 1991.
11. Peres KG, Barros AJD, Anselmi L, Peres MA, Barros FC. Does malocclusion infl uence the adolescent’s satisfaction with appearance? A cross-sectional study nested in a Brazilian birth cohort. Community
Dent Oral Epidemiol. 2008;36(2):137-43. DOI: 10.1111/j.1600-0528.2007.00382.x 12. Peres KG, Peres MA, Boing AF, Bertoldi AD, Bastos
JL, Barros AJD. Redução das desigualdades na
utilização de serviços odontológicos no Brasil entre
1998 e 2008. Rev Saude Publica. 2012;46(2):250-9.
DOI: 10.1590/S0034-89102012000200007 13. Pertesen PE. The World Oral Health Report, 2003.
Continuous improvement of oral health in the 21 st century – the approach of the WHO Global Oral
Health Programe. Community Dent Oral Epidemiol.
2003;31Suppl1:3-24.
14. Roncalli AG, Unfer B, Costa ICC, Arcieri RM, Guimarães LOC, Saliba NA. Levantamentos epidemiológicos em saúde bucal: análise da metodologia proposta pela Organização Mundial
da Saúde. Rev Bras Epidemiol. 1998;1(2):177-89.
DOI: 10.1590/S1415-790X1998000200008 15. Singer JD. Using SAS proc mixed to fi t multilevel
models, hierarchical models, and individual growth
models. J Educ Behav Stat. 1998;24(4):323-55.
16. Tellez M, Sohn W, Burt BA, Ismail AI. Assessment of the relationship between neighborhood characteristics and dental caries severity among low-income
African-Americans: a multilevel approach. J Public Health Dent.
2006;66(1). DOI: 10.1111/j.1752-7325.2006.tb02548.x 17. Thomaz EBA, Cangussu MCT, Assis MO. Maternal
breastfeeding, parafunctional oral habits and malocclusion in adolescents: A multivariate analysis.
Int J Pediatr Otorhinolaryngol. 2012;76(4):500-6. DOI: 10.1016/j.ijporl.2012.01.005
18. Tomita NE, Sheiham A, Bijella VT, Franco LJ. Relação entre determinantes socioeconômicos e hábitos bucais de risco para más-oclusões em
pré-escolares. Pesq Odont Bras. 2000;14(2):169-75.
DOI: 10.1590/S1517-74912000000200013
19. Xiao-Ting L, Tang Y, Huang XL, Wan H, Chen YX. Factors infl uencing subjective orthodontic treatment need and culture-related differences among Chinese natives and
foreign inhabitants. Int J Oral Sci. 2010;2(3):149-57.
DOI: 10.4248/IJOS10050
20. Watt RG. Emerging theories into the social determinants of health: implications for health promotion.
Community Dent Oral Epidemiol. 2002;30(4):241-7.
DOI: 10.1034/j.1600-0528.2002.300401.x 21. Zanini RR, Moraes AB, Giugliani ERJ, Riboldi
J. Determinantes contextuais da mortalidade neonatal no Rio Grande do Sul por dois modelos
de análise. Rev Saude Publica. 2011;45(1):79-89.
DOI: 10.1590/S0034-89102011000100009
REFERENCES
Research fi nanced by the Conselho Nacional de Desenvolvimento Científi co e Tecnológico (Ministério da Ciência e Tecnologia)
and the Coordenação de Pessoal de Nível Superior (Programa Nacional de Cooperação Acadêmica).
Article based on the Master dissertation of Brizon VSC, presented to the Post-Graduate Program in Orthodontics in Public
Health, Universidade Federal de Minas Gerais, in 2012.
The Pesquisa Nacional de Saúde Bucal 2010 (SBBrasil 2010, Brazilian Oral Health Survey) was fi nanced by the General
Coordination of Oral Health/Brazilian Ministry of Health (COSAB/MS), through the Centro Colaborador do Ministério da
Saúde em Vigilância da Saúde Bucal, Faculdade de Saúde Pública at Universidade de São Paulo (CECOL/USP), process no. 750398/2010.
This article underwent the peer review process adopted for any other manuscript submitted to this journal, with anonymity guaranteed for both authors and reviewers. Editors and reviewers declare that there are no confl icts of interest that could affect their judgment with respect to this article.