Edivânia Barbosa do ValeI Antônio da Cruz Gouveia MendesII
Rafael da Silveira MoreiraII
I Programa de Residência Multiprofi ssional em Saúde Coletiva. Centro de Pesquisas Aggeu Magalhães. Fundação Oswaldo Cruz. Pernambuco. Recife, PE, Brasil. II Departamento de Saúde Coletiva. Centro
de Pesquisas Aggeu Magalhães. Fundação Oswaldo Cruz. Pernambuco. Recife, PE, Brasil
Correspondence:
Fundação Oswaldo Cruz - Pernambuco Centro de Pesquisas Aggeu Magalhães Av. Professor Moraes Rego, s/n − Campus da UFPE − Cidade Universitária
50670-420 Recife, PE, Brasil Received: 4/16/2013 Approved: 6/24/2013
Article available from: www.scielo.br/rsp
Self-perceived oral health
among adults in Northeastern
Brazil
ABSTRACT
OBJECTIVE: To identify self-perceived oral health in adults and associated variables.
METHODS: The study involved primary data from the Brazilian Oral Health Survey (SBBrasil) 2010 with 2,456 adults aged 35 to 44 in the Northeastern Brazil. The dependent variable was self-perceived oral health and the independent variables were grouped into four blocks: demographic, predisposing/facilitation, oral health status and those related to self-perceived need for treatment. The Rao and Scott test was used to test the association between these variables. To test the effect of the independent variables on the outcome, a multinomial logistic regression model was used according to the hierarchical model, resulting in an analysis divided into two stages: simple analysis and hierarchical multiple regression analysis.
RESULTS: Positive self-perception of oral health was observed in 37% of
the participants. In the fi nal model, the features directly associated with
this perception were being white, having a household income exceeding R$ 500.00, owning goods number above the median, having more sound teeth, not experiencing bleeding, not requiring prosthesis, Oral Imparcts on Daily Performances = 0, not requiring treatment, having gone to the dentist less than 3 years ago.
CONCLUSIONS: The results show that self-perceived oral health in adults living in the Northeast is directly associated with a multidimensional structure of factors. The poor economic conditions associated with poor clinical conditions impact heavily on this population’s self-perception of oral health.
The concept of quality of life is closely related to self-perception which, in health care, can be understood as the interpretation of experiences and the state of health in the context of everyday life. It is based on information and knowledge of health and disease,
modifi ed by the experience and social and cultural
norms of each individual.4,11,22
The importance of social and psychological aspects is recognized and interest is growing in understanding the impact of these factors on the individual’s oral health. Thus, many research tools, such as questionnaires, are
being developed to study the infl uence of the
condi-tion of the individual’s teeth on their quality of life. Such evaluations, carried out using self-perception, are very important for health care professionals as each patient’s behavior is conditioned by this perception, by the importance given to it and by their cultural values
and previous experience of the health care system.19
Some authors18,19 state that self-perceived oral health
has multi-dimensional aspects, associated with physical and subjective conditions related to the mouth. Self-perceived oral health is directly infl uenced by social, economic and psychological motives, which can only be explained and understood when the patients are listened to and when their self-diagnoses and opinions are taken into consideration.
Thus, in order to understand the multi-dimensional aspects of self-perceived oral health, models were created which seek to understand the factors related to this perception, as well as the inter-relationship between these factors. For example, Gift et al6 (1998)
conjec-tured a theoretical conceptual model in which self-perceived oral health is a function of multiple factors, including individual demographic characteristics (age and skin color), predisposition and facilitating factors (schooling, income, overall self-perceived health and guidance perceived), factors related to oral health conditions and self-perceived need for treatment.22
They also noted that in order for self-perceived oral health to be observed, as well as the multiple factors which affect this process, a variety of indices have also been created to evaluate functional, social and psychological problems due to oral health problems. As examples they cite the Geriatric Oral Health Assessment Index,2 the Oral Health Impact Profi le20 and
the Dental Impact of Daily Living.9 The Oral Impacts
on Daily Performances (OIDP) a socio-dental indicator which assesses the frequency and severity of impacts on daily life through nine questions, giving an individual impact score.7 In 2010, a national survey was carried out INTRODUCTION
on the oral health conditions of the Brazilian population,
making use of the OIDP.17
The aim of this article was to prevent the self-perceived oral health of adults living in the Northeast and to identify associated factors.
METHODS
The study used primary data from the National Oral Health Survey - Pesquisa Nacional de Saúde Bucal (SBBrasil 2010), carried out by the Ministério da Saúde, with the aim of describing the oral health conditions of the Brazilian population.
The SBBrasil 2010 analyzed a sample of individuals in 177 municipalities from fi ve age groups: Age fi ve, 12, 15-19, 35-44 and 65-74 years old. A total of 37,519 indi-viduals were examined, of which 10,390 were resident in the Northeast.a The sampling plan contained domains
in the state capitals and municipalities in the interior. The primary sampling units were: (a) municipality, for the interior of the regions and (b) census tract, for the state capitals.17
Oral examinations were carried out to assess the prevalence and severity of the main oral health prob-lems, and questionnaires were used to collect data on socio-economic conditions, use of dental services and perceived health. These examinations were carried out within the homes selected by a fi eld work team formed of an examiner and a note taker, who had been through a training and calibration process.17
For this study, all individuals from the SBBrasil 2010 resident in municipalities in the Northeast of Brazil (in state capitals and interior) and aged between 35 and 44 were selected. The dependent variable was self-perceived oral health, determined by the following
question: “With regards your teeth and mouth, are
you…?” with fi ve options: Very satisfi ed, satisfi ed, neither satisfi ed nor dissatisfi ed, dissatisfi ed, very dissatisfi ed. However, in order to understand and orga-nize the results of this article better, there responses were grouped into three categories: 1) satisfi ed (very satisfi ed + satisfi ed) 2) neither satisfi ed nor dissatisfi ed, and 3) dissatisfi ed (dissatisfi ed, very dissatisfi ed).
The independent variables were selected based on the theoretical model of Gift et al6 (1998), with some
adap-tations, resulting in a model composed of four blocks of variables (Figure).
It is important to emphasize the OIDP index, used as one of the variables in block 4 (variables related to self-perceived need for treatment), was analyzed using
a questionnairea containing the nine functions assessed
in the OIDP. There were questions on whether everyday tasks were affected by the teeth: eating, brushing teeth, speaking, smiling, sleeping, working or studying, going out and doing sport. The responses were 0 = no impact and 1 = impact on one or more.
Need for a prosthesis was assessed by the professional examiner. The consumer goods taken into account were: television, fridge, stereo, microwave, telephone, mobile phone, washing machine, dishwasher, laptop and number of cars. The need for treatment was that reported by the interviewee.
Analysis of the initial data was carried out by distrib-uting the independent variables according to the dependent variable, and the Rao & Scott15 test was
used to test the association between them. This test is specifi cally for complex samples and only tests the association between qualitative variables, without providing information as to whether the category has greater effect on the outcome.
To test the effect of the independent variables on the event, a multinomial logistic regression model was used according to the hierarchical model proposed by Victora et al23 (1997). The hierarchical analysis follows the levels
in which the four blocks of variables were organized as in the model shown in the Figure. Thus, this analysis had two stages: simple and multiple hierarchical.
The simple analysis verified whether there was an association between each independent variable and the
outcome, with “dissatisfi ed” as the reference category of the dependent variable. At this stage, the odds ratio (OR) and the respective 95% confi dence interval were calcu-lated, and 5% was adopted as the level of signifi cance.
Next, the multiple analysis was carried out. At this stage, within each level of the hierarchy, variables with p < 0.25 were tested in multiple models. At the end of the multiple analysis, variables with p < 0.05 were kept
in the fi nal model for each level and were considered
factors of adjustment for the subsequent blocks.
The criterion was the hierarchical model and the inter-relationships between the various groups of factors. It is worth pointing out that the objective of adopting an a priori theoretical model meant that the modeling process was true to the relationships shown in the
model. Thus, the simple exercise of fi nding
associa-tions between variables was renounced in favor of an explanatory focus directed at the theoretical – method-ological framework of the study.
The analyses were carried out using the SPSS 13.0 software, considering the complex design of the sample. This adjustment was necessary as the sample in the SBBrasil 2010 was a cluster sample, and estimates which do not take into account the cluster organization of the sample tent to overestimate and lose accuracy.10
The SBBrasil 2010 Project followed the standard set by the Declaration of Helsinki and was approved by the National Research Ethics Council, record no. 15,498, on 7th January 2010.
DMFT: Sum of teeth (T): D = Decayed (affected by caries and untreated); M = Missing (extracted due to caries); F = Filled (attacked by caries, but treated)
OIDP: Oral Impacts on Daily Performances.
Figure. Hierarchical model of the independent variables adapted from the explanatory model proposed Gift et al6 (1998).
Self-perception of oral health Block 3
Oral health condition variables
- Number of healthy teeth - DMFT Index
- Prevalence of bleeding - Nedding prothesis
Block 4
Self-perceived need for treatment
- Dentist appointment - Frequency of visiting dentist - Type of service used on last visit
- Motive of last visit - Needing treatment - Toothache - OIDP Block 1
Demographic Variables
- Sex - Age
- Race/skin color
Block 2
Predisposition/ facilitating variables
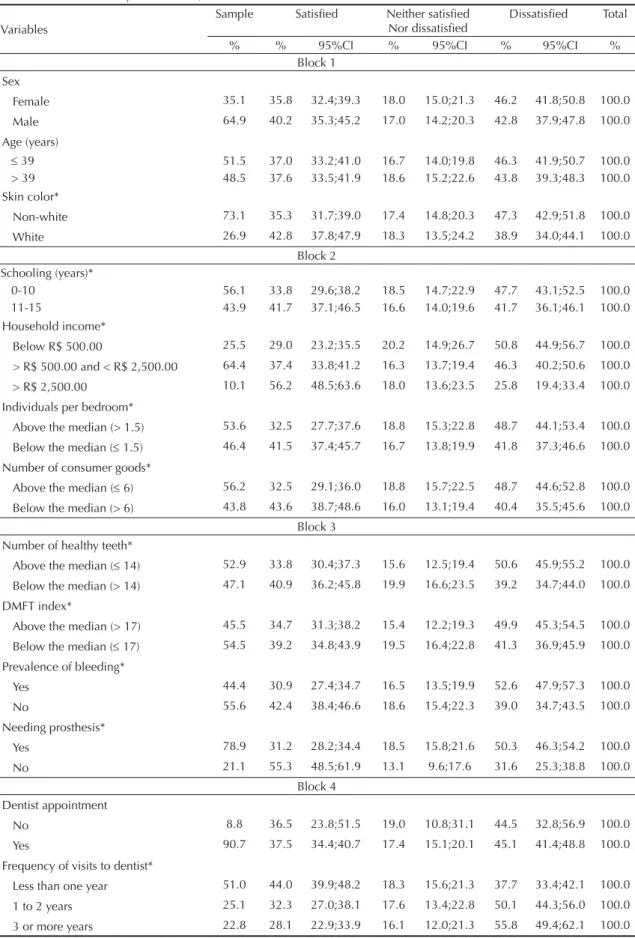
Table 1. Descriptive analysis of the rates of prevalence and respective confi dence intervals for the evaluated responses according to block of variables analyzed. SBBrasil, 2010.
Variables
Sample Satisfi ed Neither satisfi ed Nor dissatisfi ed
Dissatisfi ed Total
% % 95%CI % 95%CI % 95%CI %
Block 1 Sex
Female 35.1 35.8 32.4;39.3 18.0 15.0;21.3 46.2 41.8;50.8 100.0 Male 64.9 40.2 35.3;45.2 17.0 14.2;20.3 42.8 37.9;47.8 100.0 Age (years)
39 51.5 37.0 33.2;41.0 16.7 14.0;19.8 46.3 41.9;50.7 100.0 > 39 48.5 37.6 33.5;41.9 18.6 15.2;22.6 43.8 39.3;48.3 100.0 Skin color*
Non-white 73.1 35.3 31.7;39.0 17.4 14.8;20.3 47.3 42.9;51.8 100.0
White 26.9 42.8 37.8;47.9 18.3 13.5;24.2 38.9 34.0;44.1 100.0 Block 2
Schooling (years)*
0-10 56.1 33.8 29.6;38.2 18.5 14.7;22.9 47.7 43.1;52.5 100.0 11-15 43.9 41.7 37.1;46.5 16.6 14.0;19.6 41.7 36.1;46.1 100.0 Household income*
Below R$ 500.00 25.5 29.0 23.2;35.5 20.2 14.9;26.7 50.8 44.9;56.7 100.0 > R$ 500.00 and < R$ 2,500.00 64.4 37.4 33.8;41.2 16.3 13.7;19.4 46.3 40.2;50.6 100.0
> R$ 2,500.00 10.1 56.2 48.5;63.6 18.0 13.6;23.5 25.8 19.4;33.4 100.0 Individuals per bedroom*
Above the median (> 1.5) 53.6 32.5 27.7;37.6 18.8 15.3;22.8 48.7 44.1;53.4 100.0 Below the median ( 1.5) 46.4 41.5 37.4;45.7 16.7 13.8;19.9 41.8 37.3;46.6 100.0 Number of consumer goods*
Above the median ( 6) 56.2 32.5 29.1;36.0 18.8 15.7;22.5 48.7 44.6;52.8 100.0 Below the median (> 6) 43.8 43.6 38.7;48.6 16.0 13.1;19.4 40.4 35.5;45.6 100.0
Block 3 Number of healthy teeth*
Above the median ( 14) 52.9 33.8 30.4;37.3 15.6 12.5;19.4 50.6 45.9;55.2 100.0 Below the median (> 14) 47.1 40.9 36.2;45.8 19.9 16.6;23.5 39.2 34.7;44.0 100.0 DMFT index*
Above the median (> 17) 45.5 34.7 31.3;38.2 15.4 12.2;19.3 49.9 45.3;54.5 100.0
Below the median ( 17) 54.5 39.2 34.8;43.9 19.5 16.4;22.8 41.3 36.9;45.9 100.0 Prevalence of bleeding*
Yes 44.4 30.9 27.4;34.7 16.5 13.5;19.9 52.6 47.9;57.3 100.0 No 55.6 42.4 38.4;46.6 18.6 15.4;22.3 39.0 34.7;43.5 100.0 Needing prosthesis*
Yes 78.9 31.2 28.2;34.4 18.5 15.8;21.6 50.3 46.3;54.2 100.0
No 21.1 55.3 48.5;61.9 13.1 9.6;17.6 31.6 25.3;38.8 100.0
Block 4 Dentist appointment
No 8.8 36.5 23.8;51.5 19.0 10.8;31.1 44.5 32.8;56.9 100.0
Yes 90.7 37.5 34.4;40.7 17.4 15.1;20.1 45.1 41.4;48.8 100.0 Frequency of visits to dentist*
Less than one year 51.0 44.0 39.9;48.2 18.3 15.6;21.3 37.7 33.4;42.1 100.0
1 to 2 years 25.1 32.3 27.0;38.1 17.6 13.4;22.8 50.1 44.3;56.0 100.0 3 or more years 22.8 28.1 22.9;33.9 16.1 12.0;21.3 55.8 49.4;62.1 100.0
RESULTS
Of the 10,390 individuals in the study resident in the Northeast, 2,456 were aged between 35 and 44. Of these, 64.9% were female, 74.8% had an income below R$ 1,500.00 and 51.1% had fewer than nine years of schooling. Of the interviewees, 37.0% stated that they were satisfi ed (very satisfi ed + satisfi ed) with their oral health, 17.5% reported that they were neither satisfi ed nor dissatisfi ed and 44.7% said they were dissatisfi ed (dissatisfi ed + very dissatisfi ed).
Table 1 shows the descriptive analysis of the prevalence rates of responses for the question on self-perceived oral health, according to the selected independent variables. With regards demographic variables, only skin color had an association with the outcome (p < 0.05).
All of the variables concerning predisposition/facilitating were associated (p < 0.05) with self-perceived oral health; the highest dissatisfaction was observed among those on low incomes (50.8%) and 56.2% of those on higher incomes (over R$ 2,500.00) were satisfi ed.
Of the variables related to oral health conditions, the following had a statistical association with the outcome: dissatisfaction among those who had fewer than average
healthy teeth (50.6%), bleeding (52.6%) and those needing a prosthesis (50.3%).
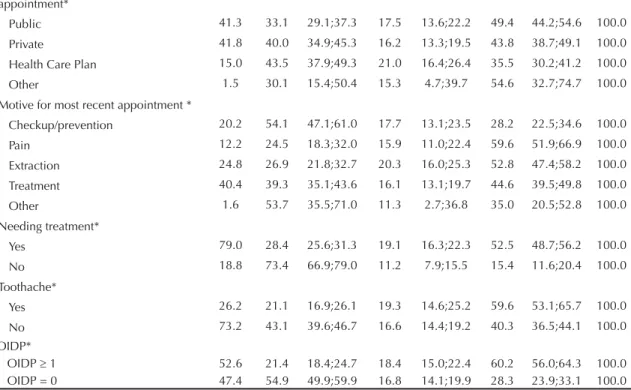
Of the variables associated with self-perceived need for treatment, only dental consultations were not statistically associated; the other variables presented dissatisfaction according to: frequency of visiting the dentist (every three years or more 55.8%), type of dental services last used (public 49.4%), motive for most recent visit (pain 59.6%), need for treatment (52.5%),
toothache (59.6%) and OIDP ≥ 1 (60.2%).
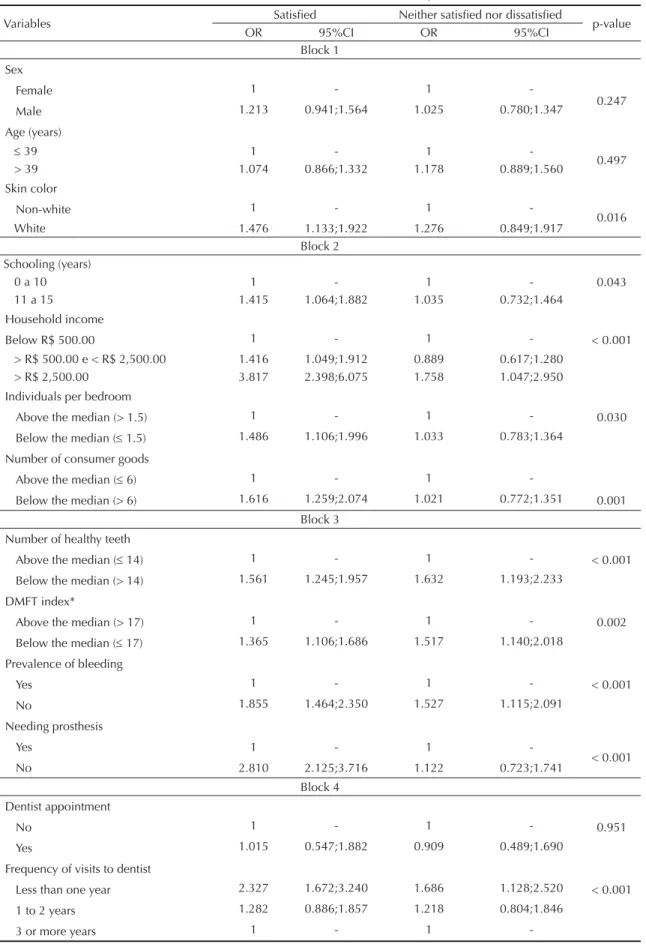
Table 2 shows the results of the simple analysis. Of the variables which were statistically signifi cant, it was noted that in block 1, whites were more satisfi ed with their oral health than non-whites. In block 2, those who reported they were satisfi ed with their oral health had more years of schooling (11-15 years), income > R$ 2,500.00, lived in households with the number of
individuals per bedroom below the mean (≤ 1.5) and
had more than the mean number of consumer goods (>6). In Block 3, it was observed that those who were
most satisfi ed had more healthy teeth, lower mean
DMFT (decayed, missing, fi lled teeth), did not suffer
bleeding and did not need a dental prosthesis. In block 4, those who were most satisfi ed with their oral health were those who had seen the dentist within the last
Continuation
Type of service used on most recent appointment*
Public 41.3 33.1 29.1;37.3 17.5 13.6;22.2 49.4 44.2;54.6 100.0 Private 41.8 40.0 34.9;45.3 16.2 13.3;19.5 43.8 38.7;49.1 100.0 Health Care Plan 15.0 43.5 37.9;49.3 21.0 16.4;26.4 35.5 30.2;41.2 100.0 Other 1.5 30.1 15.4;50.4 15.3 4.7;39.7 54.6 32.7;74.7 100.0 Motive for most recent appointment *
Checkup/prevention 20.2 54.1 47.1;61.0 17.7 13.1;23.5 28.2 22.5;34.6 100.0 Pain 12.2 24.5 18.3;32.0 15.9 11.0;22.4 59.6 51.9;66.9 100.0 Extraction 24.8 26.9 21.8;32.7 20.3 16.0;25.3 52.8 47.4;58.2 100.0 Treatment 40.4 39.3 35.1;43.6 16.1 13.1;19.7 44.6 39.5;49.8 100.0
Other 1.6 53.7 35.5;71.0 11.3 2.7;36.8 35.0 20.5;52.8 100.0 Needing treatment*
Yes 79.0 28.4 25.6;31.3 19.1 16.3;22.3 52.5 48.7;56.2 100.0
No 18.8 73.4 66.9;79.0 11.2 7.9;15.5 15.4 11.6;20.4 100.0
Toothache*
Yes 26.2 21.1 16.9;26.1 19.3 14.6;25.2 59.6 53.1;65.7 100.0 No 73.2 43.1 39.6;46.7 16.6 14.4;19.2 40.3 36.5;44.1 100.0 OIDP*
OIDP 1 52.6 21.4 18.4;24.7 18.4 15.0;22.4 60.2 56.0;64.3 100.0 OIDP = 0 47.4 54.9 49.9;59.9 16.8 14.1;19.9 28.3 23.9;33.1 100.0 * p < 0.05 (Rao Scott test)
DMFT: Sum of teeth (T): D = Decayed (affected by caries and untreated); M = Missing (extracted due to caries); F = Filled (attacked by caries, but treated)
Table 2. Values for the unadjusted odds ratio and confi dence intervals obtained from simple analysis for association between the variables in the hierarchical model and dissatisfaction with oral health. SBBrasil, 2010.
Variables Satisfi ed Neither satisfi ed nor dissatisfi ed p-value
OR 95%CI OR 95%CI
Block 1 Sex
Female 1 - 1
-0.247
Male 1.213 0.941;1.564 1.025 0.780;1.347
Age (years)
39 1 - 1
-0.497
> 39 1.074 0.866;1.332 1.178 0.889;1.560
Skin color
Non-white 1 - 1
-0.016
White 1.476 1.133;1.922 1.276 0.849;1.917
Block 2 Schooling (years)
0 a 10 1 - 1 - 0.043
11 a 15 1.415 1.064;1.882 1.035 0.732;1.464
Household income
Below R$ 500.00 1 - 1 - < 0.001
> R$ 500.00 e < R$ 2,500.00 1.416 1.049;1.912 0.889 0.617;1.280 > R$ 2,500.00 3.817 2.398;6.075 1.758 1.047;2.950 Individuals per bedroom
Above the median (> 1.5) 1 - 1 - 0.030
Below the median ( 1.5) 1.486 1.106;1.996 1.033 0.783;1.364 Number of consumer goods
Above the median ( 6) 1 - 1
-Below the median (> 6) 1.616 1.259;2.074 1.021 0.772;1.351 0.001 Block 3
Number of healthy teeth
Above the median ( 14) 1 - 1 - < 0.001
Below the median (> 14) 1.561 1.245;1.957 1.632 1.193;2.233
DMFT index*
Above the median (> 17) 1 - 1 - 0.002
Below the median ( 17) 1.365 1.106;1.686 1.517 1.140;2.018 Prevalence of bleeding
Yes 1 - 1 - < 0.001
No 1.855 1.464;2.350 1.527 1.115;2.091
Needing prosthesis
Yes 1 - 1
-< 0.001
No 2.810 2.125;3.716 1.122 0.723;1.741
Block 4 Dentist appointment
No 1 - 1 - 0.951
Yes 1.015 0.547;1.882 0.909 0.489;1.690
Frequency of visits to dentist
Less than one year 2.327 1.672;3.240 1.686 1.128;2.520 < 0.001
1 to 2 years 1.282 0.886;1.857 1.218 0.804;1.846
3 or more years 1 - 1
year, whose most recent appointment had been through their health insurance, had other motives for their last appointment, who were not in need of treatment, did not suffer from toothache and had an OIDP value = 0.
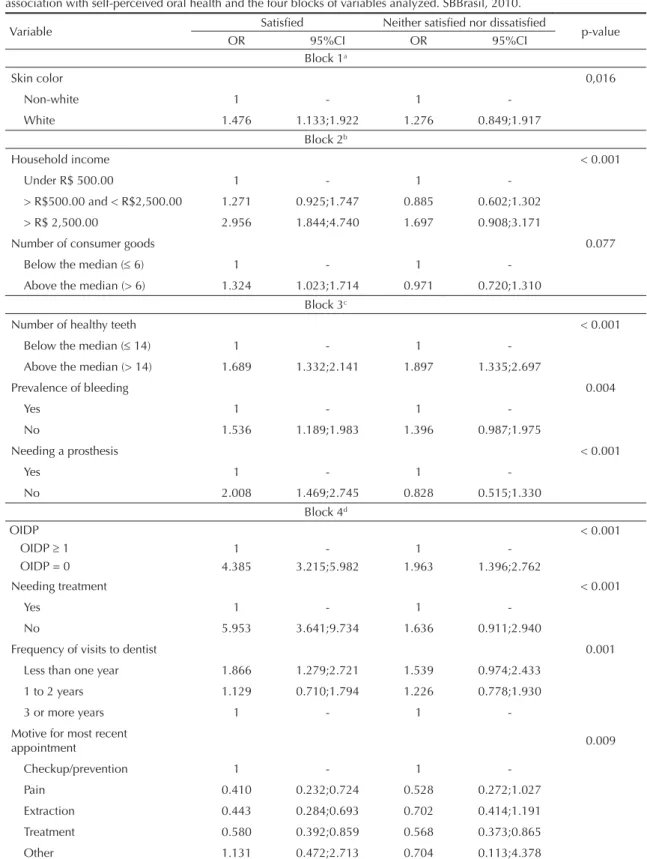
In the multiple analysis (Table 3), it was observed that, after adjustment, the following variables were directly associated with self-perceived oral health: skin color, household income, number of consumer goods, number of healthy teeth, prevalence of bleeding, needing a pros-thesis, OIDP, needing treatment, frequency of visiting the dentist and motive for most recent visit.
DISCUSSION
The prevalent self-perception of oral health was nega-tive (44.7%) in the age group analyzed. The highest levels of dissatisfaction observed were strongly associ-ated with variables relassoci-ated to conditions of predisposi-tion/facilitating, to oral health conditions which the individuals presented during their examinations and those related to self-perceived need for treatment. Of the demographic variables, only skin color proved to be associated with dissatisfaction.
Thus, with regards to socioeconomic conditions (block 2 variables), the following were directly associated with dissatisfaction: low levels of schooling, low income,
poor housing (living in households with many people in the rooms) and having few consumer goods. It is known that each individual’s socioeconomic aspects directly infl uence their oral health conditions, as such factors are associated with greater or lesser knowledge of healthy lifestyle habits and, consequently, recognizing greater or lesser need for orthodontic treatment. Moreover, they are conditions which directly infl uence the individual’s way of life. Working and living conditions qualify, each in a different way, the way in which individuals think, feel and act with respect to their health.1 Studies1,7 show
that low levels of schooling and income are related to a higher prevalence of negative impacts from oral health and that lower income is associated with level of education, the value placed on health, lifestyle and access to health care information.
Regarding the variables related to oral health conditions (block 3), all of them were observed to have an associa-tion with self-perceived oral health and that negative conditions – such as fewer healthy teeth, higher DMFT, bleeding and needing a prosthesis – were factors directly related to negative perception of oral health. These fi nd-ings can be explained by the fact that such conditions, in addition to producing discomfort in the individuals, often compromise chewing and can also be responsible for producing negative self-perceptions of oral aesthetics, resulting in dissatisfaction when smiling and speaking.
Continuation
Type of service used on most recent appointment
Public 1 - 1
-Private 1.363 1.034;1.795 1.042 0.725;1.496
Health Care Plan 1.832 1.311;2.561 1.672 1.083;2.583 0.016
Other 0.824 0.324;2.097 0.794 0.191;3.303
Motive for most recent appointment
Checkup/prevention 1 - 1
-Pain 0.214 0.130;0.351 0.422 0.229;0.779
Extraction 0.265 0.172;0.410 0.609 0.391;0.948 < 0.001
Treatment 0.458 0.323;0.650 0.574 0.382;0.862
Other 0.800 0.378;1.694 0.515 0.092;2.878
Needing treatment
Yes 1 - 1
-< 0.001
No 8.763 6.042;12.710 1.977 1.284;3.042
Toothache
Yes 1 - 1
-< 0.001
No 3.023 2.234;4.092 1.274 0.904;1.795
OIDP
OIDP 1 1 - 1
-< 0.001
OIDP = 0 5.466 4.208;7.101 1.938 1.463;2.568
DMFT: Sum of teeth (T): D = Decayed (affected by caries and untreated); M = Missing (extracted due to caries); F = Filled (attacked by caries, but treated)
Table 3. Values for the adjusted odds ratio and confi dence intervals obtained by multi-nominal logistic regression analysis for association with self-perceived oral health and the four blocks of variables analyzed. SBBrasil, 2010.
Variable Satisfi ed Neither satisfi ed nor dissatisfi ed p-value
OR 95%CI OR 95%CI
Block 1a
Skin color 0,016
Non-white 1 - 1
-White 1.476 1.133;1.922 1.276 0.849;1.917
Block 2b
Household income < 0.001
Under R$ 500.00 1 - 1
-> R$500.00 and < R$2,500.00 1.271 0.925;1.747 0.885 0.602;1.302
> R$ 2,500.00 2.956 1.844;4.740 1.697 0.908;3.171
Number of consumer goods 0.077
Below the median (6) 1 - 1
-Above the median (> 6) 1.324 1.023;1.714 0.971 0.720;1.310 Block 3c
Number of healthy teeth < 0.001
Below the median ( 14) 1 - 1
-Above the median (> 14) 1.689 1.332;2.141 1.897 1.335;2.697
Prevalence of bleeding 0.004
Yes 1 - 1
-No 1.536 1.189;1.983 1.396 0.987;1.975
Needing a prosthesis < 0.001
Yes 1 - 1
-No 2.008 1.469;2.745 0.828 0.515;1.330
Block 4d
OIDP < 0.001
OIDP 1 1 - 1
-OIDP = 0 4.385 3.215;5.982 1.963 1.396;2.762
Needing treatment < 0.001
Yes 1 - 1
-No 5.953 3.641;9.734 1.636 0.911;2.940
Frequency of visits to dentist 0.001
Less than one year 1.866 1.279;2.721 1.539 0.974;2.433
1 to 2 years 1.129 0.710;1.794 1.226 0.778;1.930
3 or more years 1 - 1
-Motive for most recent
appointment 0.009
Checkup/prevention 1 - 1
-Pain 0.410 0.232;0.724 0.528 0.272;1.027
Extraction 0.443 0.284;0.693 0.702 0.414;1.191
Treatment 0.580 0.392;0.859 0.568 0.373;0.865
Other 1.131 0.472;2.713 0.704 0.113;4.378
DMFT: Sum of teeth (T): D = Decayed (affected by caries and untreated); M = Missing (extracted due to caries); F = Filled (attacked by caries, but treated)
OIDP: Oral Impacts on Daily Performances a Adjusted for Block 1 variables
Haikal et al8 (2011) also observed that, the lower the
mean number of teeth and the higher the DMFT values, the more negative the self-perceived oral health.
Individuals needing dental prosthesis tend to evaluate the own oral health negatively. It can be seen that the need for prosthetic rehabilitation is a clinical situation which directly impacts on chewing, as well as on self-perception of smiling and often produces embarrassment when smiling and talking, as well as diffi culties in interpersonal relationships. Thus, the results found here corroborate the
fi ndings of another study carried out in Brazil4 which also
found that needing a dental prosthesis is directly related to a negative self-perception of oral health.
The clinical conditions showed a strong association with negative self-perceived oral health. Other surveys2,19,21
also report a link between perception of oral conditions and some clinical variables, although this association was relatively weak. These studies justify that fi nding as many of the diseases detected in the clinical examinations are asymptomatic and the individual is probably unaware of them. Moreover, studies1,18 also show that the majority
of individuals view their oral condition favorably, even when clinical conditions are dissatisfactory, probably as the clinical measurements of health used by profes-sionals are relatively poor predictors of the individual’s perception of their oral health.
Regarding the variables related to self-perceived need for treatment (block 4), having visited (or not) the dentist before the interview was not associated with self-perceived oral health. However, variables such as frequency of visits to the dentist, type of service used on the most recent visit, reason for most recent visit, need for treatment, toothache and OIDP were strongly related to the outcome. It was noted that longer intervals without visiting the dentist was most strongly associ-ated with dissatisfaction, in other words, 55.8% of individuals who went to the dentist fewer than once in three years were dissatisfi ed with their oral health. This
fi nding corroborates the results found in Matos & Lima-Costa12 (2006), which used data from the SBBrasil 2003
and also reported that not visiting the dentist for three years or more was signifi cant in increasing the chances of the adult self-evaluating their oral health as very bad.
It was observed that there was an association between the last visit to the dentist being to a public service and dissatisfaction with oral health. This fi nding is of great importance as it creates the need for greater refl ection on how oral health public policies are being carried out in Brazil, especially in the Northeast where, historically, there has been less provision of orthodontic care to the population. Diffi culties and delays in getting orth-odontic care has direct repercussions on individuals’ satisfaction with their oral health, as well as possibly
aggravating existing problems. Camargo et al5 (2009)
also noted that those who sought care in public services
reported less frequent use compared with those who used the private network, and that regular use is lower among those with lower levels of income and education. The stated that, although the public health care system – Sistema Único de Saúde played an important part in reducing inequalities (principle of equality), it seems that that function is not being developed. However, it is not possible to affi rm whether this delay is due to diffi culties in getting an orthodontic appointment or to lack of interest on the part of the interviewee in seeking an appointment. Therefore, more detailed studies of this aspect need to be undertaken. The fact that it is a cross-sectional study being analyzed effectively means that temporal causal relationships between the independent variables and the outcome in question cannot be estab-lished. Thus, dissatisfaction may precede or follow the type of service used.
In this study, pain and toothache were observed to be directly associated with dissatisfaction with oral health conditions, something that, in other studies1,3,5,14 has
also been observed as one of the factors which create dissatisfaction and lead individuals to seek orthodontic care. This should be highlighted, as it suggests that the interviewees’ use of orthodontic services is often limited to emergencies. It is possible that there is not a culture of using orthodontic services for preventa-tive purposes, which is a fairly negapreventa-tive aspect for the population’s oral health. According to a study14 in
Araraquara, Southeastern Brazil, of the adult popula-tion aged 35 to 44, when seeking relief, little patient-dentist interaction is expected with regards information and advice and plaque control. Therefore, oral health care activities need to emphasize approaches which encourage the individual to value preventative actions and which enable a stronger link to be made between patients and orthodontic services and professionals, in the private or public network, so that they are more aware of healthy habits and the health-disease process.
Needing treatment was also noted, by Soares et al21
(2011) to be a factor strongly associated with self-perceived oral health.
It was observed that individuals who reported being dissatisfi ed with their oral health were those who had
OIDP index scores ≥ 1. The high prevalence of impact
on daily tasks in the population in question was also
observed by Gomes & Abegg7 (2007) in their study
of adults in the same age group. The authors state that this is the age group with the highest prevalence of oral health conditions impacting on daily life and that
this fi nding may be related to the increased presence
of unmet need for treatment, due to this age groups diffi culties in accessing treatment.
With regards to the demographic (block 1) variables
analyzed, only skin color proved to be signifi cantly
were more dissatisfi ed with their oral health. Studies in the United States5,13 report that whites have better
perceived oral health than non-whites. However, a study5 of the adult population in the city of Pelotas, RS,
observed that the unadjusted effect of the skin color variable disappeared after controlling for this variables. Although studies6,16 report that negative self-perceived
oral health increases with age and that sex is also related to self-perceived oral health, no statistically signifi cant association with these factors was found in this study.
Indeed, the results of the fi nal hierarchical analysis model show that self-perceived oral health in adults in the Northeast is directly associated with a multi-dimen-sional structure of factors. The model proposed by Gift
et al6 (1998) functioned as a measuring stick in the
modelling process, establishing relationships between the independent variables distal and proximal to the
outcome. Moreover, it was observed that, after adjusting the variables in logistic regression, conditions such as: household income, number of healthy teeth, needing a prosthesis, higher OIDP index and needing treatment were those which most strongly affected the outcome (p < 0.001). The poor economic conditions associated with the poor clinical oral health conditions of the adult population in the Northeast has a great impact on the self-perceived oral health of these individuals, thus showing that public policies aimed at improving this notably disadvantaged population’s quality of life need to be strengthened and possibly redirected.
ACKNOWLEDGEMENTS
1. Araújo CS, Lima RC, Peres MA, Barros AJD. Utilização de serviços odontológicos e fatores associados: um estudo de base populacional no Sul do Brasil. Cad Saude Publica. 2009;25(5):1063-72. DOI: 10.1590/S0102-311X2009000500013
2. Atchison KA, Dolan TA. Development of the Geriatric Oral Health Assessment Index. J Dent Educ. 1990;54(11):680-7.
3. Atchison KA, Gift HC. Perceived oral health in a diverse sample. Adv Dent Res. 1997;11(2):272-80.
DOI: 10.1177/08959374970110021001
4. Bombarda-Nunes FF, Miotto MHMB, Barcellos LA. Autopercepção de saúde bucal do agente comunitário de saúde de Vitória, ES, Brasil. Pesq Bras Odontopediatria Clin Integr. 2008;8(1):7-14. DOI: 10.4034/1519.0501.2008.0081.0003
5. Camargo MBJ, Dumith SC, Barros AJD. Uso regular de serviços odontológicos entre adultos: padrões de utilização e tipos de serviços. Cad Saude Publica. 2009;25(9):1894-906. DOI: 10.1590/S0102-311X2009000900004
6. Gift HC, Atchison KA, Drury TF. Perceptions of the natural dentition in the context of multiple variables. J Dent Res. 1998;77(7):1529-38. DOI: 10.1177/00220345980770070801
7. Gomes AS, Abegg C. O impacto odontológico no desempenho diário dos trabalhadores do Departamento Municipal de Limpeza Urbana de Porto Alegre, Rio Grande do Sul, Brasil. Cad Saude Publica. 2007;23(7):1707-14. DOI: 10.1590/S0102-311X2007000700023
8. Haikal DS, Paula AMB, Martins AMEBL, Moreira NA, Ferreira EF. Autopercepção da saúde bucal e impacto na qualidade de vida do idoso: uma abordagem quanti-qualitativa. Cienc Saude Coletiva. 2011;16(7):3317-29. DOI: 10.1590/S1413-81232011000800031
9. Leão A, Sheiham A. Relation between clinical dental status and subjective impacts on dally living. J Dent Res. 1995;74(7):1408-13.
DOI: 10.1177/00220345950740071301
10. Martins AMEBL, Barreto SM, Pordeus IA. Auto-avaliação de saúde bucal em idosos: análise com base em modelo multidimensional. Cad Saude Publica. 2009;25(2):421-35. DOI: 10.1590/S0102-311X2009000200021
11. Martins AMEBL, Barreto SM, Silveira MF, Santa-Rosa TTA, Pereira RD. Self-perceived oral health among Brazilian elderly individuals. Rev Saude Publica. 2010;44(5):912-22. DOI: 10.1590/S0034-89102010005000028
12. Matos DL, Lima-Costa MF. Auto-avaliação da saúde bucal entre adultos e idosos residentes na Região Sudeste: resultados do Projeto SB-Brasil,
2003. Cad Saude Publica. 2006;22(8):1699-07. DOI: 10.1590/S0102-311X2006000800018
13. Matthias RE, Atchison KA, Lubben JE, De Jong F, Schweitzer SO. Factors affecting self-ratings of oral health. J Public Health Dent. 1995;55(4):197-04. DOI: 10.1111/j.1752-7325.1995.tb02370.x
14. Pinellia C, Turrionib APS, Loffredoa LCM. Autopercepção em higiene bucal de adultos: reprodutibilidade e validade. Rev odontol UNESP. 2008;37(2):163-9.
15. Rao JNK, Scott AJ. On simple adjustments to chi-squared test with sample survey data. Ann Stat. 1987;15(1):385-97. DOI: 10.1214/aos/1176350273
16. Reisine ST, Bailit HL. Clinical oral health statusn and adult perceptions of oral health. Soc Sci Med Med Psychol Med Sociol. 1980;14A(6):597-605. DOI: 10.1016/0160-7979(80)90063-6
17. Roncalli AG, Silva NN, Nascimento AC, Freitas CHSM, Casotti E, Peres KG et al. Aspectos metodológicos do Projeto SB Brasil 2010 de interesse para inquéritos nacionais de saúde. Cad Saude Publica. 2012;28Suppl:40-57. DOI: 10.1590/S0102-311X2012001300006
18. Silva SRC, Castellanos Fernandes RA.
Autopercepção das condições de saúde bucal por idosos. Rev Saude Publica. 2001;35(4):349-55. DOI: 10.1590/S0034-89102001000400003
19. Silva SRC, Rosell FL, Valsecki Jr A. Percepção das condições de saúde bucal por gestantes atendidas em uma unidade de saúde no município de Araraquara, São Paulo, Brasil. Rev Bras Saude Matern Infant. 2006;6(4):405-10. DOI: 10.1590/S1519-38292006000400007
20. Slade GD, Spencer AJ. Social impact of oral conditions among older adults. Aust Dent J. 1994;39(6):358-64. DOI: 10.1111/j.1834-7819.1994.tb03106.x
21. Soares GB, Batista RM, Zandonade E, Oliveira AE. Associação da autopercepção de saúde bucal com parâmetros clínicos orais. Rev Bras Odontol. 2011;68(2):268-73.
22. Vasconcelos LCA, Prado Jr RR, Teles JBM, Mendes RF. Autopercepção da saúde bucal de idosos de um município de médio porte do Nordeste brasileiro. Cad Saude Publica. 2012;28(6):1101-10. DOI: 10.1590/S0102-311X2012000600009
23. Victora CG, Huttly SR, Fuchs SC, Olinto MT. The role of conceptual frameworks in epidemiological analysis: a hierarchical approach. Int J Epidemiol. 1997;26(1):224-7. DOI: 10.1093/ije/26.1.224
REFERENCES
The Pesquisa Nacional de Saúde Bucal 2010 (SBBrasil 2010, Brazilian Oral Health Survey) was fi nanced by the General Coordination of Oral Health/Brazilian Ministry of Health (COSAB/MS), through the Centro Colaborador do Ministério da Saúde em Vigilância da Saúde Bucal, Faculdade de Saúde Pública at Universidade de São Paulo (CECOL/USP), process no. 750398/2010.
This article underwent the peer review process adopted for any other manuscript submitted to this journal, with anonymity guaranteed for both authors and reviewers.