Genotoxic and mutagenic effects of polluted surface water in the midwestern
region of Brazil using animal and plant bioassays
Priscila Leocádia Rosa Dourado
1, Monyque Palagano da Rocha
1, Liriana Mara Roveda
1, Jorge Luiz Raposo
Junior
1, Liliam Sílvia Cândido
2, Claudia Andréa Lima Cardoso
3, Maria Aparecida Marin Morales
4, Kelly
Mari Pires de Oliveira
1,2and Alexeia Barufatti Grisolia
1,21
Faculdade de Ciências Exatas e Tecnológicas, Universidade Federal da Grande Dourados, Dourados, MS,
Brazil.
2Faculdade de Ciências Biológicas e Ambientais, Universidade Federal da Grande Dourados, Dourados,
MS, Brazil.
3
Universidade Estadual do Mato Grosso do Sul, Dourados, MS, Brazil.
4
Instituto de Biociências, Universidade Estadual Paulista “Júlio de Mesquita Filho”, Rio Claro, SP, Brazil.
Abstract
This study aimed to evaluate DNA damage in animal and plant cells exposed to water from the Água Boa stream (Dourados, Mato Grosso do Sul, Brazil) by using bioassays, and to identify the chemical compounds in the water to determine the water quality in the area. Through the cytotoxicity bioassay withAllium cepa, using micronucleus test, and comet assay, usingAstyanax altiparanae fish, the results indicated that biological samples were genetically al-tered. Micronuclei were observed in erythrocytes ofA. altiparanae after exposure to water from locations close to in-dustrial waste discharge. The highest DNA damage observed with the comet assay in fish occurred with the exposure to water from locations where the presence of metals (Cu, Pb, Cd, Ni) was high, indicating the possibility of genotoxic effects of these compounds. Thus, these results reinforce the importance of conducting genotoxicity tests for developing management plans to improve water quality, and indicate the need for waste management before do-mestic and industrial effluents are released into the rivers and streams.
Keywords:Allium cepa; Astyanax altiparanae; mutagenicity; cytotoxicity; genotoxicity. Received: September 23, 2015; Accepted: May 11, 2016.
Introduction
The economic development in the 1950s resulted in the territorial and industrial occupation of land that invaded areas of environmental protection, leading to the contami-nation of water bodies by domestic and industrial effluents. Furthermore, pesticide and chemical inputs contribute to the contamination of streams and rivers located near agri-cultural regions (Araújo and Dallos, 2006). Water quality and aquatic biodiversity have remarkably decreased be-cause of the exploitation from various human activities that alter the aquatic environment. Examples of such activities include inappropriate land use, effluent discharge, and ex-ploitation by overfishing (Goulart and Callisto, 2003).
The 357/2005 resolution of the Brazilian National Environmental Council (CONAMA) aims to safeguard the
water quality of aquatic ecosystems throughout Brazil. This resolution seeks to establish acceptable waste levels of var-ious compounds that are used in domestic, agricultural, livestock, and industrial processes, based on the influence that these compounds can have on physical, chemical, and biological conditions of water.
Biomarkers are used to identify chemicals released into the environment that might cause genetic and chromo-somal changes and have direct health effects, leading to hu-man diseases such as cancer, atherosclerosis, cardiovascu-lar disease, and premature aging (Radic et al., 2010). Bioassays performed using microorganisms, animals, and plant cells, separately or in combination with chemical analyses, have been used to define the toxicity of water from various resources (Zeguraet al., 2009).
Among the contaminants of urban-industrial origin, high levels of metals are the main compounds that induce toxic, genotoxic, and mutagenic effects in exposed organ-isms (Wong, 1988). Furthermore, it has been reported that these compounds can induce chromosomal abnormalities, and micronuclei, as well as DNA damage in aquatic
organ-DOI: http://dx.doi.org/10.1590/1678-4685-GMB-2015-0223
Send correspondence to Alexéia Barufatti Grisolia. Faculdade de Ciências Exatas e Tecnológicas, Universidade Federal da Grande Dourados, Rodovia Dourados – Itahum km 12, Cidade
Univer-sitária, 79804-970 Dourados, MS, Brazil. E-mail:
isms (Matsumotoet al., 2006; Barbosa et al., 2010), in-creasing the ecotoxicological risk.
According to the National Water Agency (ANA, 2009), several agroindustrial activities occur in the vicinity of the Dourados river basin (Dourados, MS) that generate contaminated waste water released in local water resources. The Água Boa is one of several streams located in this basin that receives effluent from domestic sewage and other mu-nicipal, industrial and agricultural waste (i.e. neonicoti-noids, carbamates, organophosphates, and pyrethroids).
Among the neonicotinoids pesticides used in the state of Mato Grosso do Sul, thiamethoxam and carbendazim were defined as a new class of insecticides widely used against pests in food production and in other numerous pur-poses, such as in seed treatment and in pets (Bankset al., 2005; Parazajder, 2012, thesis, University of Zagreb, Za-greb, Croácia). The exacerbated use of these products rep-resents a potential threat to humans, since their residues accumulate in food and contaminate aquatic environments. It is, therefore, necessary to intensify studies and promote an efficient environmental monitoring in the region.
The Água Boa stream was monitored using biotests that might allow the identification of possible genetic dam-age to living organisms due to the presence of pollutants
(urban, industrial, and agricultural) that have been depos-ited in the stream, often without adequate treatment. Thus, this study aimed to identify the chemical compounds pres-ent in the Água Boa stream water and evaluate DNA dam-age in animal and plant cells exposed to these waters. The findings of this study might contribute to the monitoring of water quality in this region.
Material and Methods
Characterization of the biomonitoring site
The Água Boa stream is located within the urban per-imeter, and larger part of this stream passes across the southern outskirts of the city along the industrial district. Surface water samples were collected in December 2012 and February, April, July, September and October 2013 from three different sites of the stream.
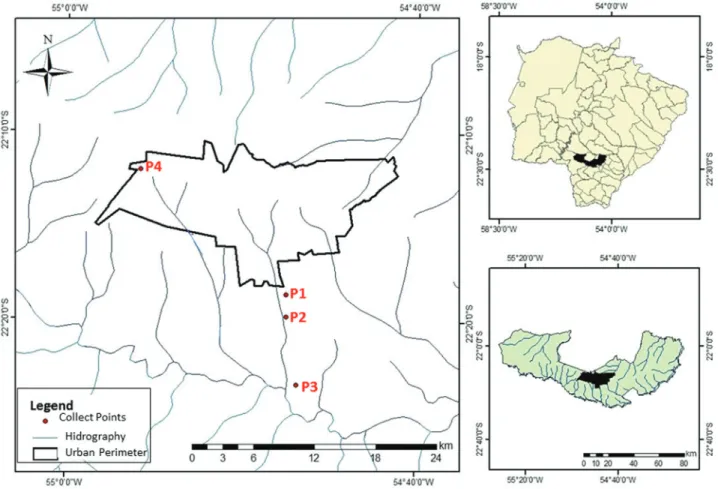
Point 1 (P1: 22.31060 °S, 054.79087 °W) is located about 4.5 km downstream of the urban area; domestic sew-age and solid waste are released in this location. Point 2 (P2: 22.32965 °S, 054.79107 °W) is located in the vicinity of the landfill and industrial district, and a near tannery and chicken slaughterhouse are the main factors of water con-tamination. Point 3 (P3: 22.39558 °S, 054.78407 °W) is
lo-Figure 1- Collection sites for water samples. Collection points from surface water in the Água Boa stream (P1, P2, P3), and groundwater from artesian
cated about 0.49 km from the mouth of the Dourados river at the Água Boa stream, which belongs to the Dourados river basin in the Grande Dourados (MS, Brazil) region, and from where water is taken for population supply. This point is impacted by agrochemicals, because of monocul-ture plantations (corn and soybeans) near its banks. In addi-tion, water samples were collected from groundwater of the Federal University of Grande Dourados (UFGD), namely, Point 4 (P4: 22.19697°S, 054.934458°W), and used to compare the compositions with those of surface water. The sampling site locations (Figure 1) were recorded using a Global Positioning System (GPS).
Water temperature (°C), pH, dissolved oxygen (DO [mg O2L-1]), electrical conductivity (Cond [mS/cm2]), and
total dissolved solids (TDS [mg L-1]) were measured using the multiparameter probe HI 9829 (Hanna). Dourados rain-fall data were obtained from Embrapa Agropecuária Oeste.
Water samples
Surface water samples were collected on the same day at around 8:00 am. Water samples used for fish bio-assays (Astyanax altiparanae) were collected in 20-L poly-ethylene containers, whereas those for theAllium cepatests were collected in 250-mL polyethylene bottles. These con-tainers were cleaned with tap water before water samples were collected.
For chemical analysis (metals and pesticides), the wa-ter samples were collected in 1 L glass bottles. For the de-termination of metals, the water was acidified with 1 mL acid (65% (v/v), VetecÒ, Duque de Caxias, RJ, Brazil) and
maintained under refrigeration (< 6 °C), whereas samples collected for the determination of organic compounds were frozen at –20 °C.
Instrumentation, sample preparation and analysis of metals
The protocol used was adapted from the technique de-scribed by Raposo Junior et al. (2008). An Agilent AA 240FS flame atomic absorption spectrometer (Agilent Technologies, Santa Clara, CA, USA) equipped with hol-low cathode lamps was used throughout this work. The op-eration parameters (such as wavelength, lamp current, slit setting, and air/acetylene flame composition) were adjusted for optimum conditions.
High-purity deionized water obtained using a Millipore Milli-Q Academic®deionizer system (resistivity
18.2 MW cm, Millipore, Bedford, MA, USA) and nitric
acid (HNO3) [65% (v/v), Sigma-AldrichÒ, St. Louis, MO,
USA] were used to prepare all solutions. All solutions and samples were stored in plastic or glass bottles cleaned by soaking in 10% (v/v) HNO3for at least 24 h and thoroughly
rinsed in deionized water before use.
For the chemical analysis, 200 mL of water was trans-ferred to an Erlenmeyer flask with reduced to
approxi-mately 30 mL, and the final volume was adjusted to 50 mL with 1.0% (v/v) HNO3solution.
Blanks, analytical solutions, and samples were mea-sured in triplicate at the main atomic wavelength for multi-element determination of zinc (Zn), cadmium (Cd), cobalt (Co), chromium (Cr), copper (Cu), iron (Fe), manganese (Mn), nickel (Ni), and lead (Pb).
10 mL HNO3, and heated at 90 °C for water
preconcentration. The volume was reduced to approxi-mately 30 mL, and the final volume was adjusted up to 50 mL with 1.0% (v/v) HNO3solution.
The following calibration curves were used: 0.0–2.0 mg L-1 Zn, 0.2–10.0 mg L-1 Cd, 0.2–10.0 mg L-1 Co,
0.2–15.0 mg L-1Cr, 0.1–2.0 mg L-1Cu, 0.5–4.0 mg L-1Fe,
0.2–4.0 mg L-1Mn, 0.2–10.0 mg L-1Ni, 0.2–15.0 mg L-1Pb
at a 5.0 mL/min aspiration rate.
Determination of organic compounds
Two-hundred microliters of the water were subjected to solid phase extraction (SPE) procedure. The process in-cluded activation and conditioning of the cartridge with 20 mL methanol and 20 mL ultrapure water, respectively. Subsequently, 200 mL sample was eluted by SPE. The con-stituents that adhered to the cartridge were eluted with 20 mL methanol, followed by 20 mL ethyl acetate. The metha-nol and ethyl acetate fractions of each sample were mixed and evaporated. Subsequently, the fractions were diluted in 100mL methanol, passed through a 0.20 mm membrane
fil-ter, and analyzed using high-performance liquid chroma-tography (HPLC).
Liquid chromatography (LC) analysis of standard solutions and samples
For biomonitoring neonicotinoids often used in the fields, the samples and standard carbendazim (CAS No. 10605-21-7) and thiamethoxam (CAS No. 153719-23-4) were analyzed in an LC system (Varian 210, Varian, Sugar Land, TX, USA) with a ternary solvent delivery system equipped with an auto-sampler and a photodiode array de-tector (PDA) that was monitored atl= 200–800 nm. The LC column was a C-18 (25 cm 4.6 mm; particle size, 5mm;
Luna, Phenomenex, Torrance, CA, USA) that had a small pre-column (2.5 cm´3 mm) containing the same packing,
which was used to protect the analytical column. In each analysis, the flow rate and the injected volume were set as 1.0 mL min–1and 20mL, respectively. All chromatographic
analyses were performed at 25 °C. The samples were eluted using acetonitrile (A): water (B) (65:35) for 5.5 min. The solvent gradient program was as follows: 0 min, 35% B for 5.5 min, 15 min 40% B; 18 min 20% B; and 20 min return-ing to the initial settreturn-ing (65% A: 35% B).
Linearity
ex-ternal calibration. Twenty microliters of the dilutions were analyzed using LC, with each determination repeated five times. For the standard solutions, the corresponding chro-matogram was obtained, and a graph was constructed from the mean of the chromatogram areas plotted against the standards in 1–100mg mL-1intervals. A linear least square
regression of the peak areas, as a function of the concentra-tions, was performed to determine the correlation coeffi-cients. The equation parameters (slope and intercept) of the standard curve were used to obtain the sample concentra-tions.
Detection and quantification limits
The detection limits were determined by injecting so-lutions of thiamethoxam and carbendazim at known con-centrations (20mL each), and then decreasing the
concen-trations of the samples until a peak with a signal/noise ratio of 3 was detected. The corresponding concentration was considered the minimal detectable concentration. The quantification limit was determined using the same meth-odology, and was defined as the chromatographic peak with a signal/noise ratio of 10. The organic compound anal-ysis was performed on one sample from P1, P2, and P3 col-lected in October 2013.
Biological analysis
Plant bioassay
The protocol used was adapted from the described by Matsumoto and Marin-Morales (2005) with modifications. Four plates containing 50 seeds ofAllium cepawere pre-pared for tests with water samples (P1, P2, P3, and P4). The seeds were exposed to the water samples for 96 h. The ger-minated roots were collected and fixed in Carnoy (v/v) 3:1 absolute ethanol/glacial acetic acid for 6 h. Next, the roots were hydrolyzed with 1 mol L-1 HCl (37%, Dinâmica, Diadema, Brazil) at 60 °C for 10 min, washed with distilled water and stained with Schiff reagent for 2 h.
For each treatment, five slides were prepared from root meristems and observed under an optical microscope (Nikon 400 objective). From each slide, 1000 cells were counted, totaling 4000 cells per treatment. The calculation of mitotic index (MI) and alteration index (AI) were calcu-lated as follows.
MI = number of dividing cells / number of total cells scored x 100
AI = number of cells with alteration / number of total cells scored x 100
MI and AI averages were subjected to analysis of variance (ANOVA) by using the F test, after data normality was checked using the Shapiro–Wilk test. The parameter means were compared using Tukey’s test (significance was set at P£0.05).
Chromosomal alterations observed in meristematic mitotic cells ofA. cepawere chromosome breakage, chro-mosomal adherence, chromosome bridge, chromosome loss, c-metaphase, multipolar anaphases, micronuclei and nuclear bud.
Animal Bioassay
The water samples (P1, P2, P3, and P4) were placed in glass tanks (40´30´20 cm) and aerated at room
tem-perature for 24 h. All fish (A. altiparanae) used for the bioassay were provided by the commercial fish farm (Douradense farm). The animal experiments were ap-proved by the ethics committee for animal research of the UFGD, Protocol nº. 005/2013.
Ten fish were placed in each aquarium that had been previously prepared with stream water samples, and main-tained for 72 h in the aquaria. Five fish were used for the micronucleus test and the other five were used for the comet assay. Specimens were then collected and anesthe-tized with 2% (v/v) benzocaine (soluble).
The micronucleus test was performed using blood smear from the tail vein. Two slides from each fish were prepared, fixed in ethanol and stained using Panotic LB. The number of micronuclei (MCN) in the erythrocytes was counted, following the protocol described by Schmid (1975) and Heddleet al.(1983), with minor adaptations. In all, 2,000 cells were counted for each fish, and only the cells with intact membranes and cytoplasm were consid-ered for the analysis. The MCN were counted using light microscope (Nikon) at 400´magnification.
The means for MCN were subjected to ANOVA ing the F-test, after the data were checked for normality us-ing the Shapiro-Wilk test. Means were compared by Tukey’s test (significance was set at p£0.05).
The comet assay was adapted from the technique de-scribed by Venturaet al.(2008). Six microliters of blood were collected by puncture and diluted with 2,000mL of
phosphate buffered saline (1:1). For each fish, two slides with 20mL cell suspension were made and 120mL 0.5%
low melting point agarose 0.5% (v/v) at 37 °C was added. The slides were left in the lysis solution for 1 h at 4 °C. Af-ter lysis, the slides were stored in 0.3 mol L-1NaOH buffer
and 0.001 mol L-1EDTA (pH > 13) for 20 min. Next, the
slides were subjected to electrophoresis at 25 V, 300 mA for 20 min and neutralized with Tris 0.4 mol L-1for 15 min,
fixed in ethanol for 10 min and stained with ethidium bro-mide (0.02 mol L-1). In all, 100 nucleoids of each slide (200
nucleoids per treatment/individual) were counted by the same person by using a fluorescence microscope (Labo-med; T121100) at 400´magnification.
al-terations (TCA) was subjected to the Chi-square test (P£
0.05) to compare the results of the different sites (P1, P2, P3, and P4). The comet assay cells score (CS) was deter-mined by calculating the number of cells with alterations multiplied by the corresponding class (1, 2, 3, and 4).
Results
The physicochemical analysis of the temperature, pH, oxygen content and total dissolved solids of water samples from all points showed values within the parameters estab-lished by CONAMA (2005). However, the values for elec-trical conductivity showed rates above 100mS/cm2 in all
samples.
Rainfall levels in the city of Dourados during the col-lection period were obtained from the Embrapa Western Agriculture data set (Dourados/MS). The average rainfall for the months (mm) of December 2012 and February, April, July, September, and October 2013 were 3.62, 3.82, 9.59, 4.31, 1.69, 4.23, respectively. The highest and lowest rainfall was recorded in April and September 2013, respec-tively.
Chemical analysis
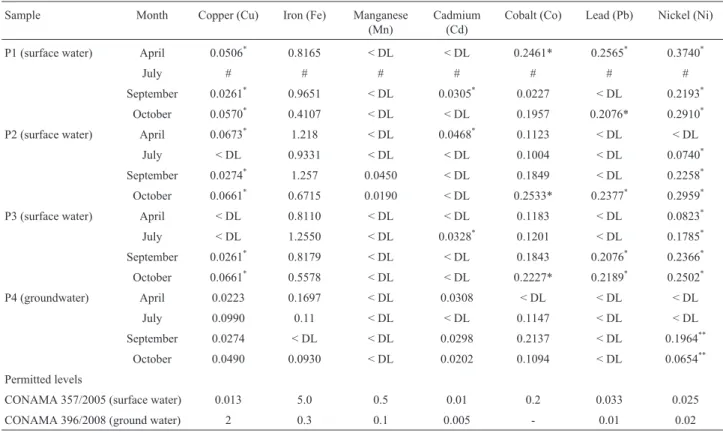
The Cu, Fe, Mn, Cd, Co, Pb and Ni levels in the Água Boa stream water and groundwater samples are shown in Table 1. The water samples collected from P1, P2, and P3 during September and October 2013 contained higher Cu content than the permitted national limit (CONAMA, 2005). However, only P1 and P2 samples collected in April 2013 exceeded the limit of Cu levels. Cd levels exceeded the national standard in P2 (April), P3 (July), and P1 (Sep-tember), while Pb levels exceeded the national standard in P1 (April and October 2013), P2 (October) and P3 (Sep-tember and October). Ni levels exceeded the national limits at P1, and P3 from April to October, and P2 from July to October. For all other elements (Fe, Mn and Co), the levels were below the national standard (CONAMA, 2005). Zn and Cr levels were below the detection level at all points. The results from P4 were compared with the 396/2008 CONAMA (2008) groundwater classification regulations, of which Ni levels (from September and October) exceeded the permitted limits.
Organic compound determination
The organic compound analysis indicated that thia-methoxam was present (Table 2) in the Água Boa stream.
Table 1- Metal levels (mg L-1) in the Água Boa stream water samples from April 2013 to October 2013.
Sample Month Copper (Cu) Iron (Fe) Manganese (Mn)
Cadmium (Cd)
Cobalt (Co) Lead (Pb) Nickel (Ni)
P1 (surface water) April 0.0506* 0.8165 < DL < DL 0.2461* 0.2565* 0.3740*
July # # # # # # #
September 0.0261* 0.9651 < DL 0.0305* 0.0227 < DL 0.2193*
October 0.0570* 0.4107 < DL < DL 0.1957 0.2076* 0.2910*
P2 (surface water) April 0.0673* 1.218 < DL 0.0468* 0.1123 < DL < DL
July < DL 0.9331 < DL < DL 0.1004 < DL 0.0740*
September 0.0274* 1.257 0.0450 < DL 0.1849 < DL 0.2258*
October 0.0661* 0.6715 0.0190 < DL 0.2533* 0.2377* 0.2959*
P3 (surface water) April < DL 0.8110 < DL < DL 0.1183 < DL 0.0823*
July < DL 1.2550 < DL 0.0328* 0.1201 < DL 0.1785*
September 0.0261* 0.8179 < DL < DL 0.1843 0.2076* 0.2366*
October 0.0661* 0.5578 < DL < DL 0.2227* 0.2189* 0.2502*
P4 (groundwater) April 0.0223 0.1697 < DL 0.0308 < DL < DL < DL July 0.0990 0.11 < DL < DL 0.1147 < DL < DL September 0.0274 < DL < DL 0.0298 0.2137 < DL 0.1964**
October 0.0490 0.0930 < DL 0.0202 0.1094 < DL 0.0654**
Permitted levels
CONAMA 357/2005 (surface water) 0.013 5.0 0.5 0.01 0.2 0.033 0.025 CONAMA 396/2008 (ground water) 2 0.3 0.1 0.005 - 0.01 0.02
Limits of detection (LOD): 0.007 mg L-1Cu, 0.014 mg L-1Fe, 0.005 mg L-1Mn, 0.008 mg L-1Cd, 0.021 mg L-1Co, 0.060 mg L-1Pb, 0.018 mg L-1Ni.
Limits of quantification (LOQ): 0.026 mg L-1Cu, 0.049 mg L-1Fe, 0.017 mg L-1Mn, 0.029 mg L-1Cd, 0.073 mg L-1Co, 0.203 mg L-1Pb, 0.062 mg L-1Ni.
As there are no reference values for pesticides in surface waters in the Brazilian legislation (CONAMA 357/2005), we used the limits set by the European community as refer-ence (EC 83/1998).
Plant bioassays
The MI values were statistically different between P2 (5.14) and P4 (8.44) in April 2013. P4 was not statistically different from the other three points in any of the other months. At P1, the MI was higher in April (6.72) than in October (1.25). At P2, the highest MI was obtained in Feb-ruary (7.34), and was statistically different from July and October, which had the lowest values. At P3, the highest MI was recorded during February (6.95) and April (6.93), and these values were statistically different from September and October, which had the lowest MI. At P4, the highest MI was recorded in April (8.44), while July, September and October had lower values (Table 3).
P3 had higher AI compared to all other points during April. In all other months, no significant differences were observed among the sampling points. At P1, the highest AI
was recorded in February (0.20), and was statistically dif-ferent from September (0.0). At P3, the highest AI was re-corded during April (0.24), which was statistically different from all other months, except September. No significant difference was obtained among months for P2 and P4 (Ta-ble 4).
In surface water samples from P1, P2 and P3, the most frequent chromosomal changes in the meristematic cells ofA. cepawere in the form of nuclear buds, chromo-some bridges, chromochromo-some loss, polyploid cell, C-meta-phases, chromosomal adhesions and multipolar anaphase. MCN and chromosome breaks were also found.
Animal bioassays
MCN test with A. altiparanae
In December 2012, fish exposed to water collected from P2 had the highest number of MCN (5.40). Results with statistical similarity were observed in P1 and P3 but not in P4. In February 2013 water from P3 induced the highest average number of MCN (4.20), which was
statisti-Table 2- Results of organic compounds in the Água Boa stream water (Dourados, MS, Brazil).
Compound (mg L-1) Sampling sites Permitted levels (mg L-1) European Union (83/1998)
1 2 3
Thiamethoxam 1.23 1.45 1.58 0.1
Carbendazim < LOD < LOD < LOD 0.1
Limits of detection (LOD): 0.37mg L-1(thiamethoxam); 0.36mg L-1(carbendazim). Limits of quantification (LOQ) 1.23mg L-1(thiamethoxam); 1.20mg
L-1(carbendazim).
Table 3- Mean mitotic index (MI) inAllium cepameristematic cells exposed to P1, P2, P3 surface water samples collected from the Água Boa stream (Dourados, MS) and P4 (groundwater) during December 2012 and February, April, July, September, and October 2013.
Collection points December February April July September October P1 2.79±2.56aBC 4.95±1.53aABC 6.72±1.50aA # 5.08
±2.39aAB 1.25±1.09aC
P2 4.60±1.23aAB 7.34±2.66aA 5.14±1.46bAB 3.50±1.17aB 4.32±1.21a AB 1.93±1.30aB
P3 5.31±1.05aAB 6.95±1.36aA 6.93±2.60aA 5.93±1.93aAB 3.22±1.25aB 2.86±1.40aB
P4 5.55±1.90aAB 6.67±2.49aAB 8.44±2.11aA 6.00±2.73aB 2.70±2.7aB 3.33±1.94aB
MI values followed by the same bold lowercase letter in a given column or capital letters in a given row did not differ significantly, # No sample collected.
Table 4- Alteration Index (AI) inAllium cepameristematic cells exposed to P1, P2, P3 surface water samples collected from the Água Boa stream (Dourados, MS) and P4 (groundwater) during December 2012 and February, April, July, September, and October 2013.
Collection points December February April July September October P1 0.04±0.06aA 0.20±0.23aA 0.01±0.01bA #
0±0bB 0.08±0.12aA
P2 0.12±0.11aA 0.02±0.01aA 0.07±0.13bA 0±0aA 0±0bA 0.07±0.08aA
P3 0.04±0.09aB 0.03±0.03aB 0.24±0.12aA 0±0aB 0.09±0.05abAB 0.07±0.06aB
P4 0.006±0.01aA 0.03±0.04aA 0±0.00bA 0±0aA 0.14±0.14aA 0.13±0.13aA
cally different from those from P4 but similar to P1 and P2 (Table 5).
In July and October, a greater number of MCN was observed in fish exposed to the samples from P1, P2 and P3 than from P4. However, during April and September, these points were not statistically different.
The highest number of MCNs was observed in April 2013 (14.60) at P1 and was statistically different from De-cember 2012 and February 2013, which had the smallest number of MCNs. At P2, the highest number of MCNs was observed in July (15.40), which was statistically different from February, September, and December. At P3, the high-est number of MCNs was observed in July (16.60), which was statistically different from all the other months (Table 5).
The sources of variation and respective mean squares of MCNs ofA. altiparanaeerythrocytes, and MI and AI ob-served in the meristematic cells ofA. cepaare summarized in Table 6. The MCN means were influenced by both col-lection periods and points, but were not influenced by the interaction between the two. The MI was influenced by all variables (sources of variation and the interaction between them). The rates AI were not influenced by any of the sources of variation.
Comet assay with A. altiparanae
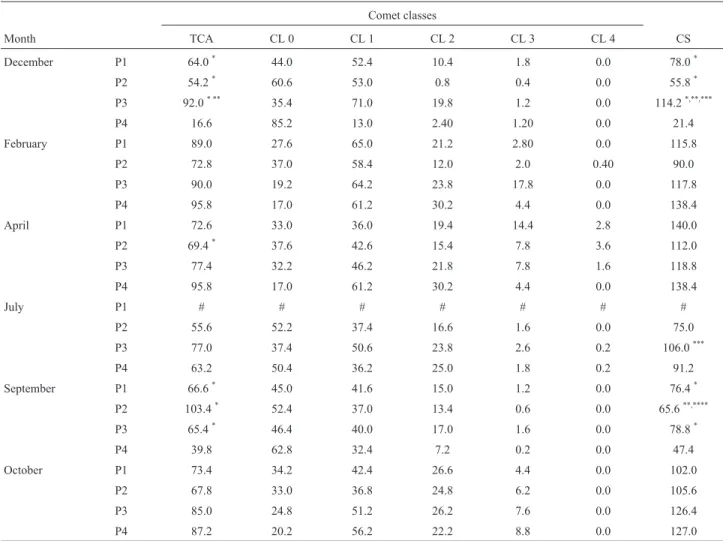
In December 2012, a significantly higher number of total cells with alterations (TCA) was obtained from the water samples (P1, P2, and P3) compared to P4. In the same period, TCA was higher for P3 and was statistically differ-ent from P1, which had a higher TCA. In April, P2 had to lowest TCA. In September, TCA values of all three points in the stream were higher than P4. No significant differ-ences in TCA levels were obtained for any of the other months (February, July and October 2013).
In December 2012, significant differences were noted in the number of damaged cells (CS: number of comets number of the corresponding class) at P1, P2, and P3 com-pared to P4. In addition, the number of damaged cells for P3 was significantly different from P1 and P2. In July, signifi-cant differences were obtained for P3 compared to P2. In September, significant differences were obtained for P2 compared to P1 and P3. No significant differences were ob-tained among any of the points in February, April, and Oc-tober 2013.
Discussion
Human activities (agricultural, industrial, and urban) have affected the water quality of the Água Boa stream, causing changes in odor and color along the stream edge at P1 and P2, which are located near the municipal waste and
Table 5- Mean number of micronuclei (MCN) in the erythrocytes ofAstyanax altiparanaeexposed to water samples collected from P1, P2, and P3 (sur-face water) in the Água Boa stream (Dourados, MS) and P4 (groundwater) during December 2012 and February, April, July, September and October 2013.
Average number of micronuclei at collection points
Collection points December February April July September October P1 2.80±2.58abB 3.20±2.48abB 14.60±11.56aA # 8.20
±4.08aAB 10.60±2.79aAB
P2 5.40±1.94aCD 3.00±2.82abD 14.80±5.97aAB 15.40±2.70aA 8.20±4.43aBCD 10.40±1.81aABC
P3 4.20±3.03abB 4.20±1.78aB 8.80±3.03aB 16.60±2.88aA 9.20±2.16aB 9.20±3.19aB
P4 0.20±0.44bB 0.80±0.83bB 4.60±4.82aAB 3.40±2.19bAB 6.80±3.49aA 3.20±1.48bAB
Average number of MCN followed by the same bold lowercase letter in a given column or capital letters in a given row did not differ significantly by Tukey’s test (P£0.05).
Columns indicate statistical differences between collection points, while rows indicate statistical differences between the sampling months. # Sample not collected
Table 6- Sources of variation, degrees of freedom, and mean square of micronuclei (MCN) number inAstyanax altiparanae, in addition to the MI and AI
reported inAllium cepa.
Sources of Variation Degrees of freedom Mean square
MCN MI AI MCN MI AI
Colection Periods 3 4 4 13.461*** 13.541*** 0.033NS
Colection Points 5 5 5 12.736*** 3.352*** 0.169NS
Periods * Points 14 19 19 0.820NS 1.265*** 0.119NS
CV (%) 24.50 20.15 294.59
R2 0.72 0.78 0.25
industrial disposal sites. These changes might be related to the release of various chemicals into the freshwater envi-ronment (CETESB, 2010).
Electrical conductivity indicates the amount of salts and the concentration of pollutants in the water, and values increase with increased amount of dissolved total solids (CETESB 2010). At all sampling points in the Água Boa stream, the electrical conductivity (above 100mS/cm2)
ex-ceeded the permitted limits. The points with the highest electrical conductivity (P2 and P3) were closer to the indus-trial district, and were located downstream from where in-dustrial effluents were discharged into the water. Thus, the altered conditions of the stream could affected the osmotic balance of animal cells and might explain the changes inA. altiparanaewhen the fish were subjected to the stream wa-ter in the aquariums. Although mortality was not recorded in the bioassays, the animals showed difficulty in adapta-tion (difficulty breathing, increase of gill movement). This fact corroborates the findings of Nuneset al.(2011), who suggested that behavioral changes in fish are related to the changes in the physicochemical parameters of water.
The development of economic activities in the last five decades has caused an increase in the concentrations of metals in water resources, impacting the natural environ-ment (Matsumoto and Marin-Morales, 2005). According to Kabata-Pendias and Pendias (1992) and Manzano et al. (2014), when the levels of metals are above the national regulation standards, they might become toxic to plants and other organisms. The high metal concentrations in the stream water found in our study might have resulted from the disposal of untreated effluent from the industrial district and agricultural areas.
Small amounts of Cu are essential for the environ-ment under natural conditions. However, excessive quanti-ties could be toxic for fish, microorganisms, and humans (Pereira, 2004). The natural levels of this and other ele-ments in the stream water have increased due to various anthropogenic activities such as the discharge of effluents from sewage treatment, run off from agricultural and indus-trial processes, and, in some cases, due to high rainfall lev-els (Rangelet al., 2011). For instance, Cu levels exceeded the national regulations in stream samples during the dry season.
Lead is bioaccumulative and classified as highly toxic for aquatic biota. Even small quantities of this element cause physiological changes in aquatic organisms (Pereira, 2004; Govind and Madhuri, 2014). The Pb content in the Água Boa stream water samples exceeded the national reg-ulations for all samples collected in October 2013 and for P3 samples collected in September (dry season). These re-sults indicate that rainfall affects metal concentrations in the water.
High levels of Ni were also found in the sample and this accumulation affects the behavior of fish because it blocks the gill filaments, causing asphyxiation. In
Septem-ber and OctoSeptem-ber 2013, high Ni levels found in samples col-lected from the stream could be caused by the low rainfall indexes, mainly in October, and by the disposal of wastes from industries located upstream, leading to the low MI and high CS observed.
High Pb and Ni contents, combined with high electri-cal conductivity, in the water samples might explain the be-havior of A. altiparanae observed during the bioassays (Uzoekwe and Oghosanine, 2011).
Cadmium is naturally found in the environment. Ho-wever, various industrial processes might increase its con-centrations, such as electroplating, pigment production, welding, insecticide formulations, incineration of munici-pal waste and agricultural fertilizers (Fariaset al., 2007). In April 2013, Cd levels exceeded the national regulations at P2, and this could be caused by high rainfall rate in April. Thus, fertilizers used for corn culture in this area might have leached Cd to the stream and increased its contamina-tion levels.
The cytotoxity of a compound might be determined by its ability to inhibit or enhance cell proliferation (Fer-nandeset al., 2007). Metals interfere with MI, induce AI and lead to MCN formation. Thus, metals have mutagenic and cytotoxic potential in plant and animal tissues (Chris-tofolettiet al., 2013). Similarly, we found that high heavy metal (Cu, Cd, Pb, and Ni) levels in September and October 2013 caused a decline in MI in stream samples located near the landfill and industrial district.
Thiamethoxam was detected in the stream samples, indicating that this substance is leached into the stream. This compound is easily dispersed in the soil, and hence has the potential to contaminate aquatic environments (Oliveira et al., 2009). It enters the water because of its use in agricul-tural crops (maize and sugarcane) in the Dourados region (MS) (ANVISA, 2001). Šojicet al. (2012) indicated that thiamethoxam is rapidly metabolized and converted to more toxic by-products. Furthermore, it causes damage to exposedE. coliDNA and yields positive results in muta-genicity (Ames Test) and genotoxicity (Comet assay) tests, indicating its possible toxic effect on organisms. Excessive use of such pesticide might contribute to the contamination of water bodies and directly impact the health of aquatic or-ganisms.
Monjolinho river, Brazil (Bianchiet al., 2011) and Pirapó river, Brazil (Peronet al., 2009).
The cytotoxity of a compound might be determined by its ability to inhibit or enhance cell proliferation (Fer-nandeset al., 2007). The MI analysis in the meristematic cells ofA. cepaidentified cytotoxic, genotoxic, and muta-genic changes in plant tissues treated with water samples from the Água Boa stream. This result might have been caused by the presence the thiamethoxam in the water sam-ples, preventing growth and development of exposed or-ganisms. Furthermore, changes to the MI process led to the emergence of chromosomal changes such as nuclear buds, chromosome bridges, chromosome loss, polyploid cells, C-metaphases, chromosomal adhesions and multipolar anaphases. These changes may or may not be repaired, and are likely to be related to the contamination of the water by heavy metals and pesticides (Majeret al., 2005). This type of damage affects the organization of cytoplasmic
micro-tubules because of the activity of aneugenic substances, which could cause incorrect division and formation of chromosomal changes.
Chromosomal changes might be directly related to the formation of MCN in cells (Bianchiet al., 2011). MCNs are induced by both aneugenic (on the mitotic spindle) and clastogenic (chromosome breakage) actions of chemical agents in the stream environment (Matsumotoet al., 2006).
Recent research has showed an association between high concentrations of metals and erythrocyte damage in tilapia. Thus, the genotoxic effects found in the cells of these animals could be related to the existence of metals in water samples (Duarte et al., 2012). The highest MCN numbers inA. altiparanaewere documented in our stream samples during April and July 2013. This result indicates the potential of metals (Cu, Cd, Pb, and Ni) to alter the mi-totic spindle formation or influence the appearance of
chro-Table 7- Average total cells with comet alterations (TCA), different comet classes (CL), and cell scores (CS) observed inAstyanax altiparanae erythro-cytes exposed to P1, P2, and P3 water samples collected from the Água Boa stream (Dourados, MS), in addition to groundwater (P4), during the study months.
Comet classes
Month TCA CL 0 CL 1 CL 2 CL 3 CL 4 CS
December P1 64.0* 44.0 52.4 10.4 1.8 0.0 78.0*
P2 54.2* 60.6 53.0 0.8 0.4 0.0 55.8*
P3 92.0* ** 35.4 71.0 19.8 1.2 0.0 114.2*,**,***
P4 16.6 85.2 13.0 2.40 1.20 0.0 21.4
February P1 89.0 27.6 65.0 21.2 2.80 0.0 115.8
P2 72.8 37.0 58.4 12.0 2.0 0.40 90.0
P3 90.0 19.2 64.2 23.8 17.8 0.0 117.8
P4 95.8 17.0 61.2 30.2 4.4 0.0 138.4
April P1 72.6 33.0 36.0 19.4 14.4 2.8 140.0
P2 69.4* 37.6 42.6 15.4 7.8 3.6 112.0
P3 77.4 32.2 46.2 21.8 7.8 1.6 118.8
P4 95.8 17.0 61.2 30.2 4.4 0.0 138.4
July P1 # # # # # # #
P2 55.6 52.2 37.4 16.6 1.6 0.0 75.0
P3 77.0 37.4 50.6 23.8 2.6 0.2 106.0***
P4 63.2 50.4 36.2 25.0 1.8 0.2 91.2
September P1 66.6* 45.0 41.6 15.0 1.2 0.0 76.4*
P2 103.4* 52.4 37.0 13.4 0.6 0.0 65.6**,****
P3 65.4* 46.4 40.0 17.0 1.6 0.0 78.8*
P4 39.8 62.8 32.4 7.2 0.2 0.0 47.4
October P1 73.4 34.2 42.4 26.6 4.4 0.0 102.0
P2 67.8 33.0 36.8 24.8 6.2 0.0 105.6
P3 85.0 24.8 51.2 26.2 7.6 0.0 126.4
P4 87.2 20.2 56.2 22.2 8.8 0.0 127.0
CL 0: Class 0, no damage; CL 1: Class 1, slightly damaged; CL 2: Class 2, damaged; CL 3 and 4: Class 3; and 4, highly damaged.*Statistically different
compared to P4;**statistically different compared to P1;***statistically different compared to P2;****statistically different compared to P3; # samples not
mosomal loss or damage, consequently leading to the emergence of MCNs.
The amount of metals presents in the stream water varied as a function of time (season and period) and collec-tion site. Periods of rain and drought differentially influ-enced genetic changes in the plant and animal bioassays. MI decreased in the plant bioassays during the dry season (September and October 2013). In contrast, high numbers of MCNs were recorded in theA. altiparanaeerythrocytes during the rainy period (April and July 2013). These find-ings corroborate those of a study by Lemoset al.(2009).
The genotoxic agents in water samples might cause the loss of DNA integrity, inducing DNA breaks and dam-age (Nuneset al., 2011). The CS in P3 (Table 7), had the greatest genotoxic potential, particularly when rainfall was low (December 2012 and September/2013), compared with that of P1 and P2, in the high rainfall season. The comet as-say was useful to evaluate how chemicals in the water af-fected A. altiparanae erythrocytes, suggesting that the greatest genotoxic effects originated from agricultural and industrial activities. Moreover, the test is sensitive enough to identify DNA damage that may be repaired (Ramsdorfet al., 2009).
Plant and animal tests showed different responses to contaminants in the stream samples. The greatest damage was observed inA. cepaduring periods of drought, while MCN levels increased during the periods of rain, as was also reported by Portoet al.(2005).
Domestic, industrial and agricultural effluents are po-tential contaminants of Água Boa stream water. These sources of waste contain different compositions of various substances, such as metals and pesticides, that interact with the cells of organisms, negatively affecting the aquatic biota. Thus, combining the results of chemical and physi-cochemical analysis for cytotoxicity, genotoxicity, and mutagenicity tests facilitates the accurate monitoring of water quality of many rivers and streams.
This study represents pioneering research in this re-gion that could serve as a basis for the development of fu-ture research aimed towards generating information about water quality of rivers and streams throughout Brazil.
In conclusion, cytotoxic, genotoxic and mutagenic damage in Allium cepa andAstyanax altiparanae might have been found due to the presence of chemical com-pounds in the water (Cd, Pb, Cu, Ni and thiamethoxam) of the Água Boa stream (Dourados, MS). These compounds, rise an alert to the risk of contamination of the water by other substances, which should be investigated. Thus, con-sidering that the Água Boa stream runs through Dourados city, empties into the Dourados river and is supplied to the population, the biomonitoring of this stream is necessary, to effectively diagnose contamination, as a preventive mea-sure and to mitigate the negative effects of xenobiotics, aiming at the recovery of water quality.
Acknowledgments
This research was supported by Universidade Federal da Grande Dourados (UFGD), Coordenação de Aperfei-çoamento de Pessoal de Nível Superior (CAPES) and Fun-dação de Apoio ao Desenvolvimento do Ensino, Ciência e Tecnologia do Estado de Mato Grosso do Sul (FUNDECT).
References
ANA (2009) - Programa Nacional de Avaliação da Qualidade das Águas (PNQA), Agência Nacional de Águas, Brasília, 222 p.
ANVISA (2001) Agência Nacional de Vigilância Sanitária -Resolução - RDC n° 12, de 2 de Janeiro de 2001.
Araújo JJ and Dallos JAG (2006) Metodología para la deter-minación de resíduos de fungicidas benzimidazólicos em fresa y lechuga por HPLC-DAD. Rev Colomb Quím 35:67-79.
Banks KE, Hunter DH and Wachal D (2005) Diazinon in surface waters before and after a federally-mandated ban. J Sci Total Environ 350:86-93.
Barbosa JS, Cabral TM, Ferreira DN, Agnez-Lima LF and Batistuzzo de Medeiros SR (2010) Genotoxicity assessment in aquatic environmental impacted by the presence of heavy metals. Ecotox Environ Saf 73:320-325.
Bianchi J, Espindola ELG and Marin-Morales MA (2011) Geno-toxicity and mutagenicity of water samples from the Monjo-linho River (Brazil) after receiving untreated effluents. Ecotox Environ Saf 74:826-833.
Christofoletti CA, Pedro-Escher J and Fontanetti CS (2013) As-sessment of the genotoxicity of two agricultural residues af-ter processing by diplopods using the Allium cepaassay. Water Air Soil poll 4:1-14.
Official Journal of the European Communities - EC (1998) Direc-tive 98/83, November 3, 1998 23p.
CETESB (2010) Companhia de Tecnologia e Saneamento Am-biental - Variáveis de qualidade das águas, São Paulo, 300 p. CONAMA (2005) Conselho Nacional do Meio Ambiente -
Reso-lução n° 357, 17 de Março de 2005, Brasília, 27 p. CONAMA (2008) Conselho Nacional do Meio Ambiente -
Reso-lução n° 396, 3 de Abril de 2008, Brasília, 11p.
Duarte IM, Dias MC, David JAO and Matsumoto ST (2012) A qualidade da água da Lagoa Jacuném (Espírito Santo, Bra-sil) em relação a aspectos genotóxicos e mutagênicos, men-surados respectivamente pelo ensaio do cometa e teste do micronúcleo em peixes da espécieOreochromis niloticus. Braz J Biosci 10:211-219.
Farias MSS, Neto JD, Lima VLA, Lira VM and Franco ES (2007) Riscos sociais e ambientais devido a presença de metais pesados nas águas superficiais no distrito industrial d man-gabeira. Qualitas Rev Elet 6:1-10.
Fernandes TCC, Mazzeo DEC and Marin-Morales MA (2007) Mechanism of micronuclei formation in polyploidizated cells of Allium cepaexposed to trifluralin herbicide. Pest Biochem Physiol 88:252-259.
Goulart MDC and CALLISTO M (2003). Use of bioindicators for assessing and monitoring pesticides contamination in streams and rivers. Revista Digital FAPAM 12:61-72. Govind P and Madhuri S (2014) Heavy metals causing toxicity in
Heddle JA, Hite M, Kirkhart B, Mavournin K, Mcgregor JT, Newell GW and Salamone NF (1983) The induction of micronuclei as a mensure genotoxicity. Mutat Res 123:61-118.
Kabata-Pendias A and Pendias H (1992) Trace elements in soils and plants.2ndEdition. CRC Press, Boca Raton, 548 p. Kataeva M, Kotseruba V, Terekhina N, Kutlunina N and Beljaeva
A (2012) Allium root-micronucleus (Allium-MCN) test on the genotoxicity of soil samples contaminated with heavy metals. World Appl Sci J 17:992-1000.
Lemos AT, Rosa DP, Rocha JAV and Vargas VMF (2009) Muta-genicity assessment in a river basin influenced by agricul-tural, urban and industrial sources. Ecotox Environ Saf 72:2058-2065.
Majer BJ, Grummt T, Uhl M and Knasmüller S (2005) Use of plant bioassays for the detection of genotoxins in the aquatic environment. Acta Hydrochim Hydrobiol 33:45-55. Manzano BC, Roberto MM, Hoshina MM, Menegário AA and
Marin-Morales MA (2014) Evaluation of the genotoxicity of waters impacted by domestic and industrial effluents of a highly industrialized region of São Paulo State, Brazil, by the comet assay in HTC cells. Environ Sci Pollut Res 22:1-9. Matsumoto ST and Marin-Morales MA (2005) Toxic and geno-toxic effects of trivalent and hexavalent chromium - a re-view. Rev Bras Toxicol 18:77-85.
Matsumoto ST, Mantovani MS, Malagutti MI, Dias AL, Fonseca IC and Marin-Morales MA (2006) Assessment of the genotoxic and mutagenic effect of chromium residues pres-ent in tannery efflupres-ents using the micronucleus and comet assay inOreochromis niloticusand chromosomes aberra-tions in ofAllium cepa. Genet Mol Biol 29:148-158. Ministério da Saúde. Portaria nº 2914 de 12 de dezembro de 2011.
Diário Oficial da União da República Federativa do Brasil, Poder Executivo, Brasília, DF, nº 239,14 de dezembro de 2011, Seção 1, pp 39-46.
Moralejo MDP and Acebal SG (2014) The transfer of Cu, Zn, Mn and Fe between soils andAlliumplants (garlic and onion), and tomato in the Southwest of the Buenos Aires Province, Argentina. Am J Plant Sci 5:480-487.
Nunes EA, Lemos CT, Gavronski L, Moreira TN, Oliveira NCD and Silva J (2011) Genotoxic assessment on river water us-ing different biological systems. Chemosphere 84:47-53. Oliveira VS, Lima JM and Carvalho RF (2009) Sorção do
inse-ticida thiametoxam em latossolo sob efeito de fosfato e vinhaça. Quim Nov 32:1432-1435.
Pereira RS (2004) Identificação e caracterização das fontes de poluição em sistemas hídricos. Rev Elet Recursos Hídricos 1:20-36.
Peron AP, Canesin EA and Cardoso CMV (2009) Potencial muta-gênico das águas do Rio Pirapó (Apucarana, Paraná, Brasil) em células meristemáticas de raízes deAllium cepa L.Rev Bras Biocienc 7:155-159.
Porto JIR, Araújo CSO and Feldberg E (2005) Mutagenic effects of mercury pollution as revealed by micronucleus test on three Amazonian fish species. Environ Res 97:287-292. Radic S, Stipanicev D, Vujcic V and Rajcic MM (2010) The
eval-uation of surface and waste water genotoxicity using the Allium cepatest. Sci Total Environ 408:1228-1233. Ramsdorf WA, Guimarães FSF, Ferraro MVM, Gabardo J,
Trin-dade ES and Cestari MM (2009) Establishment of experi-mental conditions for preserving samples of fish blood for analysis with both comet assay and flow cytometry. Mutat Res 673:78-81.
Rangel CMA, Baptista Neto JÁ, Fonseca EM, McAlister J and Smith BJ (2011) Study of heavy metal concentration and partitioning in the Estrela River: implications for the pollu-tion in Guanabara Bay - SE Brazil. Acad Bras Cienc 83:801-815.
Raposo Junior, JL, Souza JLC and Ré-Poppi N (2008) Evaluation of metal ions and nitrate levels in ground water from private wells in Culturama (State of Mato Grosso do Sul, Brazil) by flame AAS. At Spectrosc 29:137-144.
Schmid W (1975) The micronucleus test. Mutat Res 31:9-15. Šojic D, Despotovíc V, OrcicD, Szabó E, Arany E, Armakovic S,
Illés E, Gajda-Schrantz K, Dombi A, Alapi T,et al.(2012) Degradation of thiamethoxam and metoprolol by UV, O3 and UV/O3 hybrid processes: Kinetics, degradation inter-mediates and toxicity. J Hydrol 473:314-327.
Uzoekwe SA and Oghosanine FA (2011) The effect of refinery and petrochemical effluent on water quality of ubeji creek warri, Southern Nigeria. Ethiop J Environ Stud Manag 4:107-116.
Ventura BC, Angelis DF and Marin-Morales MA (2008) Mutagenic and genotoxic effects of the Atrazine herbicide in Oreochromis niloticus(Perciformes, Cichlidae) detected by the micronuclei test and the comet assay. Pestic Biochem Physiol 90:42-51.
Zegura B, Heath E, Cernosa A and Filipic M (2009) Combination ofin vitrobioassays for the determination of cytotoxic and genotoxic potential of wastewater, surface water and drink-ing water samples. Chemosphere 75:1453-1460.
Wong PK (1988) Mutagenicity of heavy metals. Bull Environ Contam Toxicol 40:597-603.
Associate Editor: Daisy Maria Fávero Salvadori