ABSTRACT:Sugarcane (Saccharum spp.) is one of the most important crops cultivated in the tropics and subtropics and plays a signifi cant economic and environmental role in Brazil. Twenty-four new clones were evaluated in different locations as potential models for recommendation as new varieties. The mixed model methodology, using the harmonic mean of the relative per-formance of genetic values (MHPRVG), facilitated the analysis of genotypic stability and adapt-ability, culminating in the recommendation of clones for each location. MHPRVG ranked clones RB92579, RB867515, SP81-3250, RB947520 and RB931530 as the best fi ve, and, addition-ally, clones with greater genotypic potential were identifi ed for each test in the six localities.
Introduction
Sugarcane (Saccharum spp.) is one of the most im-portant species cultivated in the tropics and subtropics and plays a signifi cant economic and environmental role in Brazil, occupying a total area of 8.527 million hect-ares in the agricultural years 2011/2012, according to data from the Companhia Nacional de Abastecimento (Conab, 2012) (National Supply Company).
A large number of clones are evaluated every year in sugar cane breeding programs, in experiments conducted in different harvests, seasons and regions. It is becoming increasingly diffi cult to select the best genotypes phenotypically. One of the most important aspects in genetic breeding is the prediction of the ge-netic values of genotypes, which requires estimating variance components that are either known or accu-rately estimated. Thus, the optimal procedure for pre-dicting the best linear unbiased prediction (BLUP) of genetic values and the optimal procedure for estimating the residual or restricted maximum likelihood (REML) variance components are both associated with a mixed linear model.
In studies on genetic breeding, consideration of treatment effects as random effects leads to greater pre-dictive accuracy. This is relevant in genetic breeding pro-grams and allows for genetic selection. Otherwise, the selection is phenotypic rather than genetic (Viana et al., 2011; Viana et al., 2012).
The simultaneous consideration of all environ-ments commands the use of a univariate model for selection, taking into account average productivity in the various environments. However, a more complete methodology may allow additional inferences, such as selection of the following: specifi c genotypes for each
location, stable genotypes across locations, genotypes re-sponsive to environmental improvement and selection on three attributes (productivity, stability and adaptabil-ity) simultaneously, Mendes et al. (2012).
The present study aimed to select the most pro-ductive clones of sugar cane for a region in the southeast of Brazil, through experimentation on clones in the fi nal stage of evaluation, by investigating adaptability and sta-bility parameters through mixed modeling.
Materials and Methods
In March and April of 2005, six experiments were carried out in Campos dos Goytacazes, in the state of Rio de Janeiro (21º45’15” S, 41º19’28” W - sites 1 and 2); Conceição da Barra, in the state of Espírito Santo (ES) (18º35’36” S, 39º43’56” W - site 3); Linhares-ES (19º23’28” S, 40º04’20” W - site 4); Itapemirim-ES (21º00’40” S, 40º50’02” W - site 5); and Serra dos Aimorés, in the state of Minas Gerais (17º46’57” S, 40º14’51” W - site 6).
Twenty-four clones were assessed at each site, fi ve of which were considered as standard, while the other 19 were genotypes with potential for recommendation in the regions under evaluation, some of which have al-ready been launched as varieties in other regions of the country. The relationship between the clones is set out in Table 2. The clones were grown under rainfed culti-vation and received management treatments, including fertilization and weed control, in accordance with the standard practices in force at each sugar mill fi eld.
The experiments were conducted in a random-ized block design with four replications, and each plot formed consisted of four 5-m cane furrows. The experi-ments were evaluated over three agricultural years, and the last harvest was carried out in 2008. The plots were Received April 17, 2013
Accepted September 03, 2013
1Petrobras-Biofuel, Av. República do Chile, 65 − 20031-912
− Rio de Janeiro, RJ – Brazil.
2State University of North Fluminense – Genetic and Plant
Breeding Lab., Av. Alberto Lamego, 2000 – 28015–610 – Campos dos Goytacazes, RJ – Brazil.
3Embrapa Forestry, Estrada da Ribeira, km 111, C.P. 319 −
83411-000 − Colombo, PR – Brazil. *Corresponding author <[email protected]> Edited by: Natalia de-Leon
Breeding new sugarcane clones by mixed models under genotype by environmental
interaction
harvested and evaluated prior to detrash with fi re in commercial plantations in the chosen localities. The trait tons of Pol per hectare were evaluated by the product of the variable ton of cane per hectare and the percentage of sucrose in the cane.
Estimates of the variance components and predic-tions of the genetic values were made using the REML/ BLUP procedure. The simultaneous selection for yield, stability and adaptability of clones was based on the har-monic mean of the relative performance of the predicted genetic values (MHPRVG). All these analyses were done using the model below (Mendes et al., 2012).
y = Xf + Zg + Qge + Tgm + Wgml + Sp + e (1) where "y" is the vector of data; "f" the vector of the effects of replication-environment-year combinations (assumed to be fi xed) added to the overall average; "g" the vector of the genotypic effects (assumed to be random); "ge" the vector of the effects of the interaction between genotypes and environments (random); "gm" the vector of the effects of genotype × year interaction; "gml" the vector of the effects of the genotype × environment × year triple inter-action (assumed to be random); "p" the vector of the per-manent effects of the plot within environments (assumed to be random), and "e" the vector of errors or residues (random). The capital letters refer to the matrices of inci-dence for these effects, and the adjustment of the model was derived from the following mixed model equations:
1 1 1 2 1 3 1 4 1 5 ˆ ' ' ' ' ' ' ' ˆ ' ' ' ' ' ' ' ˆ ' ' ' ' ' '
' ' ' ' ' ' ˆ
' ' ' ' ' ' ˆ
' ' ' ' ' ' ˆ
f
X X X Z X Q X T X W X S X y
g
Z X Z Z A Z Q Z T Z W Z S Z
Q X Q Z Q Q A Q T Q W Q S gl
T X T Z T Q T T A T W T S gm
W X W Z W Q W T W W A W S gml
S X S Z S Q S T S W S S A p
' ' ' ' y Q y T y W y S y (2) where: 2 1 2 e g
, 2 2 2 e g , 2 2 2 e ge , 2 3 2 e gm , 2 4 2 e gml
, 2 5 2 e p
(3)where: , the genotypic correlation
over the years was estimated by , the genotyp-ic correlation of the environments , the geno-typic correlation of the environment × year interaction
was estimated by .
The BLUP prediction of genotypic averages in each environment was estimated based on the sum of the average values and effects of genotypes and their interaction. The genotypic values predicted for clone i in each environment j used, simultaneously, the data from all the environments and were estimated by VGij = i + gi + geij + gmik + pl, where i is the average of envi-ronment j. The joint selection considering, simultane-ously, ton of Pol per hectare, stability and adaptability, was given by the statistical harmonic mean of rela-tive performance for the predicted genotypic values,
1 i n ij j= n MHPRVG = VG
, where n = number of environments in which
clone i was evaluated, and VGij is the genotypic value of clone i in the environment j, expressed as the ratio of
the average for this environment. For the analyses SELE-GEN software was used.
Results and Discussion
Estimates of average heritability of clones (h2m)
were made where averages were used as the unit of evaluation. This calculation of heritability is of great in-terest, since its prediction is based on the averages of several replications. The estimate of the index found for this study was 0.65, which is considered moderate to high, and encourages expectations of superior clone se-lection.
The genotypic correlation of the response of clones in the environments (rgl) provides a degree of reliability
with regard to how constant the ranking of clones will be in these various environments. For such, a value of 0.38 was found, suggesting a high level of genotype × envi-ronment interaction and indicates that the best clone in one environment may not be the best in another. Silva et al. (2012) found this value to be 0.635, which indicates the existence of a wide genotype × environment inter-action.
The genotypic correlation estimate of the perfor-mance of clones over the years has provided a value only marginally superior torge. However, this value (rge= 0.68) is still rated as low, which indicates interaction be-tween genotypes and harvests. Therefore, clones should be evaluated in more than one cropping season in breed-ing programs.
When the estimation of the genotypic correlation of the behavior of clones in environments and years (environments) is considered, the importance of studies on adaptability and stability becomes evident, since its value is extremely low, namely, 0.22, which indicates a complex genotype × environment interaction. In other words, the classifi cation of clones will not be the same in different environments.
The basic supposition of the analysis of variance and regression analysis, in studies on adaptability and stability, is the independence of errors, which is a a procedure that in practice, in more complex situations is imprecise; while the REML method (restricted maxi-mum likelihood) may not take this assumption into con-sideration and can be more fl exible in its application. Furthermore, the analysis of variance shows limitations in joint analyses in the case of heterogeneity of residual variances between environments, which does not occur in REML (Viana et al., 2011; Viana et al., 2012).
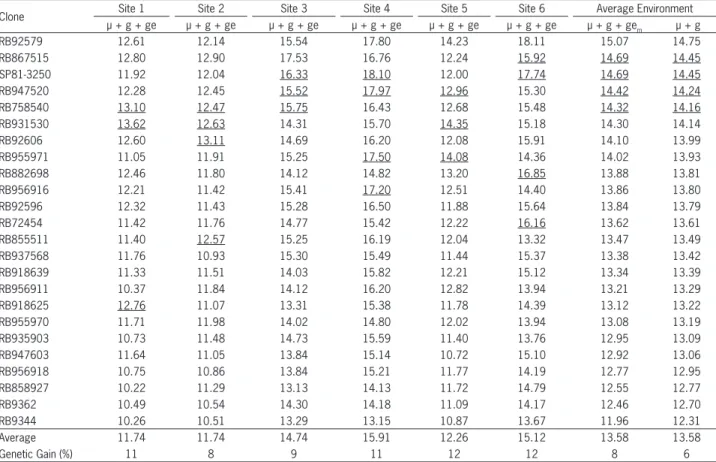
highest genotypic values. Although these two selections are identical as regards the clones selected, the predic-tions of genotypic values are higher for µ + g + gem. However, this superiority will only be capitalized if the clones are planted in areas with the same standards of interaction between genotypes and environments as the experimental network evaluated. Thus, the genotypic averages based on µ + g are more reliable.
The predicted genetic gains with the cultivation of the fi ve best clones in each location (underlined values), in relation to the average, are 11, 8, 9, 11, 12 and 12 % for sites 1, 2, 3, 4, 5 and 6, respectively. BLUP values ob-tained for each sugar mill take into account the informa-tion from the entire experimental network. Therefore, these estimates are more accurate than the calculation of BLUP values obtained through analyses per environ-ment.
The inferences previously found were applied to clone selection through genotypic values, whether the genotype × environment interaction were capitalized or not. However, when analysing adaptability and sta-bility, it was necessary to apply other methodologies. Nowadays, there are numerous methodologies that can be used to evaluate phenotypic adaptability and stabil-interaction (g × e) takes into account the heritability of
the effects of the g × e interaction, thereby eliminating noise or the residual effects of the interaction during the process of the g × e prediction.
Table 1 presents the classifi cation of the genotypic values of the 24 clones evaluated for the trait tons of pol per hectare (TPH) for the 18 environments (six locali-ties × three harvests). The clones RB92579, RB867515, SP81-3250, RB947520 and RB758540 present the highest BLUP values for genotypic values for the environment without capitalizing the genotype × environment inter-action (µ + g). When genotypic values (µ + g) are used for genotype classifi cation, they can be applied in envi-ronments different from those where they were evalu-ated, since this estimate is not capitalized with the effect of the genotype × environment interaction (Bastos et al., 2007; Maia et al., 2009). Therefore, the same response is expected for the average in different environments.
When the genotype × environment interaction (µ + g + ge) is capitalized, recommendations should be put into practice in areas of the same experimental network or in areas with the same pattern of genotype × environ-ment interaction. By applying µ + g + gem, the same fi ve clones sorted for µ + g are selected from those with the
Table 1 – Estimates of the genotypic values without capitalizing the genotype × environment (µ + g) interaction and capitalizing the average genotype × environment interaction (µ + g + gem) and capitalizing the genotype × environment interaction for each location (µ + g + ge) for the trait tons of pol per hectare evaluated in six Localities1, during three years in 24 clones of sugarcane. µ+g.
Clone Site 1 Site 2 Site 3 Site 4 Site 5 Site 6 Average Environment
µ + g + ge µ + g + ge µ + g + ge µ + g + ge µ + g + ge µ + g + ge µ + g + gem µ + g
RB92579 12.61 12.14 15.54 17.80 14.23 18.11 15.07 14.75
RB867515 12.80 12.90 17.53 16.76 12.24 15.92 14.69 14.45
SP81-3250 11.92 12.04 16.33 18.10 12.00 17.74 14.69 14.45
RB947520 12.28 12.45 15.52 17.97 12.96 15.30 14.42 14.24
RB758540 13.10 12.47 15.75 16.43 12.68 15.48 14.32 14.16
RB931530 13.62 12.63 14.31 15.70 14.35 15.18 14.30 14.14
RB92606 12.60 13.11 14.69 16.20 12.08 15.91 14.10 13.99
RB955971 11.05 11.91 15.25 17.50 14.08 14.36 14.02 13.93
RB882698 12.46 11.80 14.12 14.82 13.20 16.85 13.88 13.81
RB956916 12.21 11.42 15.41 17.20 12.51 14.40 13.86 13.80
RB92596 12.32 11.43 15.28 16.50 11.88 15.64 13.84 13.79
RB72454 11.42 11.76 14.77 15.42 12.22 16.16 13.62 13.61
RB855511 11.40 12.57 15.25 16.19 12.04 13.32 13.47 13.49
RB937568 11.76 10.93 15.30 15.49 11.44 15.37 13.38 13.42
RB918639 11.33 11.51 14.03 15.82 12.21 15.12 13.34 13.39
RB956911 10.37 11.84 14.12 16.20 12.82 13.94 13.21 13.29
RB918625 12.76 11.07 13.31 15.38 11.78 14.39 13.12 13.22
RB955970 11.71 11.98 14.02 14.80 12.02 13.94 13.08 13.19
RB935903 10.73 11.48 14.73 15.59 11.40 13.76 12.95 13.09
RB947603 11.64 11.05 13.84 15.14 10.72 15.10 12.92 13.06
RB956918 10.75 10.86 13.84 15.21 11.77 14.19 12.77 12.95
RB858927 10.22 11.29 13.13 14.13 11.72 14.79 12.55 12.77
RB9362 10.49 10.54 14.30 14.18 11.09 14.17 12.46 12.70
RB9344 10.26 10.51 13.29 13.15 10.87 13.67 11.96 12.31
Average 11.74 11.74 14.74 15.91 12.26 15.12 13.58 13.58
Genetic Gain (%) 11 8 9 11 12 12 8 6
1Localities: Sites 1 and 2: Campos dos Goytacazes-RJ; Site 3: Conceição da Barra-ES; Site 4: Linhares-ES; Site 5: Itapemirim-ES; Site 6: Serra dos Aimorés-MG.
ity, but the simplest interpretation procedures have been more appreciated. Thus, measures that incorporate both stability and adaptability in a single statistical fi gure are the prevailing ones.
Most procedures for the analysis of adaptability and stability use phenotypic averages after performing the analysis of variance, including the methodologies of Eberhart and Russell (1966) and Lin and Binns (1988), which estimate adaptability and phenotypic stability. In turn, the MHPRVG method, proposed by Mendes et al. (2012), is based on genotypic values predicted via mixed models, where the term adaptability and genotypic sta-bility can be used, which aggregates productivity, stabil-ity and adaptabilstabil-ity into a single statistical datum.
As for the inferences for expected productivity, genotypic values should be used as follows (Pedrozo et al., 2011): i) for planting in the fi eld of each sugar mill: considering genotypic values by using the genotype × environment interaction for each environment (µ + g + ge); ii) for planting in other places with the same standard of genotype × environment interaction as the experimental network: considering genotypic values by using the genotype × average environment interaction (µ + g + gem) or the adaptability of genotypic values (PRVG); iii) for planting in other unknown environments or when using a standard of genotype × environment interaction different from the experimental network or
with high environmental heterogeneity within the envi-ronment that takes into account genotypic values with-out capitalizing genotype × environment interaction (µ + g) or the stability of genotypic values (MHVG); iv) and for planting in several other environments with differ-ent standards of genotype × environmdiffer-ent interaction: considering stability and adaptability of genotypic val-ues (MHPRVG).
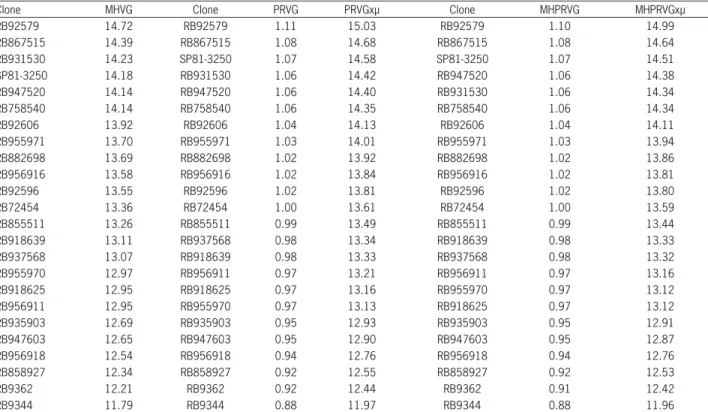
The MHPRVG method was adopted for this study. Table 2 presents the results for the stability of genotypic values (MHVG), adaptability of genotypic values (PRVG and PRVG x µ) and the stability and adaptability of ge-notypic values (MHPRVG and MHPRVG x µ) for the trait TPH, as predicted by BLUP analysis for 24 clones of sugar cane.
The harmonic mean of genetic values (MHVG) classifi es genotypes for genotypic values (productivity) and stability, the lower the standard deviation of the ge-notypic performance between environments, the higher the MHVG value. Thus, selection based on this value implies simultaneous selection for yield and stability, (Mendes et al., 2012). Bastos et al. (2007) evaluated 70 clones and two controls of sugarcane in seven environ-ments and found high correlation between the genotypic values by capitalizing the genotype × environment inte-raction with the values predicted by MHPRVG, which were effective for genotype selection.
Table 2 – Stability of genotypic values (MHVG); adaptability of genotypic values (PRVG and PRVG × µ); stability and adaptability of genotypic values (MHPRVG and MHPRVG × µ) for the trait tons of pol per hectare predicted by BLUP analysis for 24 clones of sugarcane.
Clone MHVG Clone PRVG PRVGxµ Clone MHPRVG MHPRVGxµ
RB92579 14.72 RB92579 1.11 15.03 RB92579 1.10 14.99
RB867515 14.39 RB867515 1.08 14.68 RB867515 1.08 14.64
RB931530 14.23 SP81-3250 1.07 14.58 SP81-3250 1.07 14.51
SP81-3250 14.18 RB931530 1.06 14.42 RB947520 1.06 14.38
RB947520 14.14 RB947520 1.06 14.40 RB931530 1.06 14.34
RB758540 14.14 RB758540 1.06 14.35 RB758540 1.06 14.34
RB92606 13.92 RB92606 1.04 14.13 RB92606 1.04 14.11
RB955971 13.70 RB955971 1.03 14.01 RB955971 1.03 13.94
RB882698 13.69 RB882698 1.02 13.92 RB882698 1.02 13.86
RB956916 13.58 RB956916 1.02 13.84 RB956916 1.02 13.81
RB92596 13.55 RB92596 1.02 13.81 RB92596 1.02 13.80
RB72454 13.36 RB72454 1.00 13.61 RB72454 1.00 13.59
RB855511 13.26 RB855511 0.99 13.49 RB855511 0.99 13.44
RB918639 13.11 RB937568 0.98 13.34 RB918639 0.98 13.33
RB937568 13.07 RB918639 0.98 13.33 RB937568 0.98 13.32
RB955970 12.97 RB956911 0.97 13.21 RB956911 0.97 13.16
RB918625 12.95 RB918625 0.97 13.16 RB955970 0.97 13.12
RB956911 12.95 RB955970 0.97 13.13 RB918625 0.97 13.12
RB935903 12.69 RB935903 0.95 12.93 RB935903 0.95 12.91
RB947603 12.65 RB947603 0.95 12.90 RB947603 0.95 12.87
RB956918 12.54 RB956918 0.94 12.76 RB956918 0.94 12.76
RB858927 12.34 RB858927 0.92 12.55 RB858927 0.92 12.53
RB9362 12.21 RB9362 0.92 12.44 RB9362 0.91 12.42
RB9344 11.79 RB9344 0.88 11.97 RB9344 0.88 11.96
Out of the fi ve best clones for MHVG (RB92579, RB867515, RB931530, SP81-3250 and RB947520), four are among the fi ve best clones classifi ed by joint analysis of genotypic values (excluding clone RB931530).
In relation to type of studies, Bastos et al. (2007) concluded that the MHVG method is a selection that is suffi ciently reliable where the aim is stability and pro-ductivity. However, Mendes et al. (2012) reported that this methodology cannot be considered reliable for analyzing information from unbalanced experiments where not all clones are present in all environments.
The method of relative performance of genotypic values (PRVG) estimates the adaptability of genetic val-ues in different environments. In this methodology, the predicted genotypic values are expressed as a ratio of the overall average of each location. Then, the average value of this ratio is obtained through the environments (Mendes et al., 2012). It is possible to observe that the fi ve best clones rated by MHVG were also the best using PRVG.
Estimates of MHVG, and PRVG and MHPRVG in cashew plants made by Maia et al. (2009) allowed for selection of more productive genotypes. They concluded that these methodologies can be used in breeding pro-grams for this crop. The MHPRVG method (harmonic mean of the relative performance of genetic values) pro-posed by Mendes et al. (2012) is among the mixed mod-els and allows simultaneous selection for productivity, stability and adaptability.
Clones RB92579, RB867515, SP81-3250, RB947520 and RB931530 stood out in simultaneous selection for productivity, stability and adaptability and were rated in the fi ve fi rst positions. It is possible to observe cer-tain maintenance of the order of materials in these three methodologies, which indicates that the methods MHVG, PRVG and MHPRVG have a certain degree of agreement in the positioning of genotypes.
For different strategies, a comparison between the methodologies of Lin and Binns (1988) and MHPRVG, with the selection of the ten best clones, as sorted by MHPRVG, showed that eight clones selected by MH-PRVG coincide with the ten clones selected using the methodology of Lin and Binns (1988). However, there was also some reverse order among some overlapping clones. Nevertheless, high correlation is observed be-tween the two methods, also reported by Bastos et al. (2007). Mendes et al. (2012) showed that the MHPRVG
methodology has the advantage of providing results in the very scale used for measuring the trait, which allows for calculating genetic gain with simultaneous selection for yield, adaptability and stability.
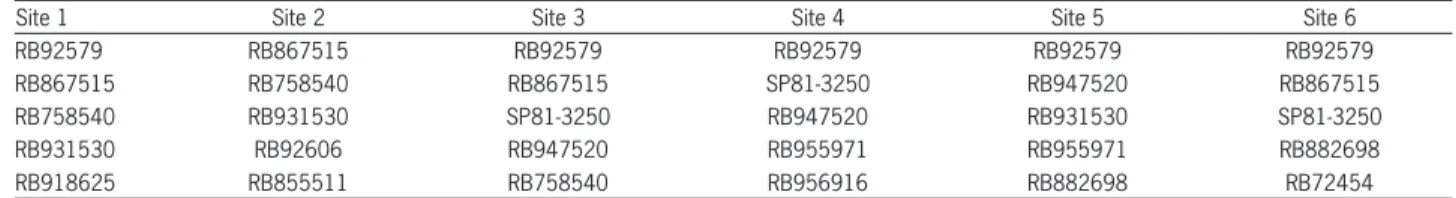
Several clones were ranked among the fi ve best for more than one of the six localities tested (Table 3), which demonstrates great productive potential. Clones RB92579 (fi ve localities), RB867515 (four localities) and clones RB758540, RB931530, SP81-3250 and RB947520 stood out and were among the most productive in three out of the six localities evaluated.
As the effects of treatments (clones) were accepted as random, tests for multiple comparisons of treatment means are inappropriate (Viana et al., 2012; Piepho, 1998). REML/BLUP (treatments as random effects) should be used, instead of a comparison of means (treat-ments as fi xed effects).
RB92579, RB867515, SP81-3250, RB947520, RB758540 and RB931530 were the best suited clones for planting in other environments with the same pattern of interaction between genotypes and the environment of the experimental network (Table 4). These clones were recommended for planting in other unknown environ-ments, or where there is a pattern of the interaction be-tween genotypes and different environments of the ex-perimental network or high environmental heterogeneity within the environment. Clones RB92579, RB867515,
Table 3 – Clones included in the fi ve highest genotypic values for sugarcane, capitalizing the genotype × environment interaction (µ + g + ge), for the six localities evaluated for the trait tons of pol per hectare.
Site 1 Site 2 Site 3 Site 4 Site 5 Site 6
RB92579 RB867515 RB92579 RB92579 RB92579 RB92579
RB867515 RB758540 RB867515 SP81-3250 RB947520 RB867515
RB758540 RB931530 SP81-3250 RB947520 RB931530 SP81-3250
RB931530 RB92606 RB947520 RB955971 RB955971 RB882698
RB918625 RB855511 RB758540 RB956916 RB882698 RB72454
1Localities: Sites 1 and 2: Campos dos Goytacazes-RJ; Site 3: Conceição da Barra-ES; Site 4: Linhares-ES; Site 5: Itapemirim-ES; Site 6: Serra dos Aimorés-MG. Table 4 – Clones included among the best fi ve genotypic values for
items ii, iii and iv for the six localities evaluated for the trait tons of pol per hectare for 24 clones of sugarcane.
Management Suggested
--- ii --- --- iii --- iv ---µ + g + gem PRVG µ + g MHVG MHPRVG
SP81-3250, RB947520 and RB758540 were selected for planting in several other environments with different patterns of genotype × environment interaction.
In conclusion, the mixed model methodology proved adequate for evaluating adaptability and stabil-ity, as well as for selecting genotypes with responsive superiority in assessments of various plantation environ-ments.
References
Bastos, I.T.; Barbosa, M.H.P.; Resende, M.D.V.; Peternelli, L.A.; Silveira, L.C.I.; Donda, L.R.; Fortunato, A.A.; Costa, P.M.A; Figueiredo, I.C.R. 2007. Assessment of genotype × environment interaction in sugar cane sugar by mixed models. Pesquisa Agropecuária Tropical 37: 195-203 (in Portuguese, with abstract in English).
Companhia Nacional de Abastecimento [CONAB]. 2012. Monitoring of the Brazilian cane sugar harvest, crop 2011/12. Available at: www.conab.gov.br [Accessed Sept 29, 2012] Eberhart, S.A.; Russel, W.A. 1966. Stability parameters for
comparing varieties. Crop Science 6: 36-40.
Lin, C.S.; Binns, M.R. 1988. A superiority measure of cultivar performance for cultivar x location data. Canadian Journal of Plant Science 68: 193-198.
Maia, M.C.C.; Resende, M.D.V.; Paiva, J.R.; Cavalcanti, J.J.V.; Barros, L.M. 2009. Simultaneous selection for yield, adaptability and genotypic stability in cashew clones by mixed models. Pesquisa Agropecuária Tropical 39: 43-50 (in Portuguese, with abstract in English).
Mendes, F.F.; Guimarães, L.J.M.; Souza, J.C.; Guimarães, P.E.O.; Pacheco, C.A.P.; Machado, J.R.A.; Meirelles, W.F.; Silva, A.R.; Parentoni, N. 2012. Adaptability and stability of maize varieties using mixed models methodology. Crop Breeding and Applied Biotechnology 12: 111-117.
Pedrozo, C.A.; Barbosa, M.H.P.; Silva, F.L.S.; Resende, M.D.V.; Peternelli, L.A. 2011. Repeatability of full-sib sugarcane families across harvests and the effi ciency of early selection. Euphytica 182: 423-430.
Piepho, H.P. 1998. Empirical best linear unbiased prediction in cultivar trials using factor analytic variance-covariance structures. Theoretical and Applied Genetics 97: 195-201. Silva, G.A.P.; Gouvêa, L.R.L.; Verardi, C.K.; Resende, M.D.V.;
Scalopi Junior, E.J.; Gonçalves, P.S. 2012. Genetic parameters and correlation in early measurement cycles in rubber trees. Available at: http//link.springer.com/article/10.1007%Fs10681-012-0751-8 [Accessed May 20, 2013]
Viana, J.M.S.; Faria, V.R.; Silva, F.F.; Resende, M.D.V. 2012. Combined selection of progeny in crop breeding using best linear umbiased prediction. Canadian Journal of Plant Science 92: 553-562.