Genotype x environment interaction in cowpea by mixed models
1Interação genótipos x ambientes em feijão-caupi via modelos mistos
Leonardo Castelo Branco Carvalho2, Kaesel Jackson Damasceno-Silva3*, Maurisrael de Moura Rocha3and Giancarlo Conde Xavier Oliveira2
ABSTRACT - Several methods have been proposed to measure effects of genotype × environment interaction (G×E) on various traits of interest of plant species, such as grain yield. Among these methods, mixed models using the Restricted Maximum Likelihood (REML)-Best Linear Unbiased Prediction (BLUP) procedure with random genotype effects have been reported as advantageous, since they allow the obtaining of actual genotypic values for cultivation and use. The objective of this work was to evaluate the response of grain yield to different locations and years, and the effects of G×E on the performance of cowpea genotypes by the methodology of mixed models. Twenty genotypes were evaluated under rainfed conditions in 47 locations in 2010, 2011 and 2012 using randomized block design. After joint analysis, the genotypes adaptability and stability patterns within and between years were tested by the Harmonic Mean of Relative Performance of Genetic Values (HMRPGV) statistics. The analysis within the years showed highly significant effects of the genotype × location interaction in all the years evaluated. The results of the joint analysis presented highly significant effects (p≤0.01) of the genotype, and triple interaction (genotype × location × year) (p≤0.001), denoting a strong effect of the G×E on the genotype performances. The HMRPGV analysis was adequate to identify superior genotypes, highlighting the MNC02-676F-3, MNC03-737F-5-1, MNC03-737F-5-9, BRS-Tumucumaque, and BRS-Guariba as the genotypes with best stability and highest grain yield. The selection of these genotypes resulted in a new average yield (1,402 kg ha-1) which is higher than
that obtained by selection based only on the phenotype (1,230 kg ha-1).
Key words:Vigna unguiculata. G × E interaction. BLUP.
RESUMO - Vários métodos têm sido propostos para medir a influência da interação genótipos por ambientes em características de interesse, tais como a produtividade de grãos. Entre estes, modelos mistos utilizando abordagens REML/BLUP com efeitos de genótipos aleatórios são apontados como vantajosos, visto que permitem obter os valores genotípicos reais de cultivo e uso. O objetivo deste estudo foi avaliar, por meio de modelos mistos, a resposta da produtividade de grãos em feijão-caupi às variações de locais e anos e a influência da interação genótipos por ambientes no desempenho dos genótipos. Vinte genótipos foram avaliados em 47 locais, sob regime de sequeiro, nos anos de 2010, 2011 e 2012, sob o delineamento de blocos casualizados. Após análise conjunta, os padrões de adaptabilidade e estabilidade dos genótipos dentro e entre anos foram testados pela estística da MHPRVG (Média Harmônica da Performance Relativa dos Valores Genotípicos). Para a análise dentro de anos, os efeitos da interação genótipos x locais foram altamente significativas para todos os anos considerados. Na análise conjunta, os efeitos de genótipos e da interação tripla (Genótipo x Local x Ano) foram altamente significativos (p≤0,01 e p≤0,001, respectivamente), indicando forte influência da interação genótipos por ambientes no desempenho dos genótipos. A avaliação por meio da MHPRVG foi adequada para identificar genótipos superiores, e destacou MNC02-676F-3, MNC03-737F-5-1, MNC03-737F-5-9, BRS Tumucumaque e BRS Guariba como os genótipos com melhor estabilidade e desempenho para a produtividade de grãos. A seleção dos genótipos mencionados resultou em uma nova média de 1.402 kg ha-1, que é maior
do que a média obtida por seleção com base apenas no fenótipo (1.230 kg ha-1).
Palavras-chave:Vigna unguiculata. Interação G x A. BLUP.
DOI: 10.5935/1806-6690.20170103 *Autor para correpondência
Recebido para publicação em 29/08/2016; aprovado em 20/03/2017
1Parte da Tese de Doutorado do primeiro autor apresentada ao Programa de Pós-Graduação em Genética e Melhoramentos de Plantas da Escola
Superior de Agricultura “Luiz de Queiroz”, Universidade de São Paulo, Piracicaba-SP, Brasil; pesquisa liderada pelo Embrapa Meio-Norte Programa de Melhoramento de Feijão-caupi.
2Programa de Pós-Graduação em Genética e Melhoramento de Plantas, Departamento de Genética da Escola Superior de Agricultura “Luiz de Queiroz”,
Universidade de São Paulo, Piracicaba-SP, Brasil, [email protected], [email protected]
INTRODUCTION
Cowpea (Vigna unguiculata (L.) Walp.) is a
legume that has great nutritional value. This species is grown mainly in Africa, and Nigeria is the world’s largest producer. It is widely cultivated in the Northeast region of Brazil, and nowadays also in the North and Center-West regions; Brazil is the world’s third largest
producer (SINGHet al., 2010; VIJAYKUMAR; SAINI;
JAWALI, 2010). Researches on cowpea breeding in Brazil have been developed by the Brazilian Agricultural Research Corporation (Embrapa) which maintains an Active Germplasm Bank for this species and has been conducting a Breeding Program led by Embrapa Mid-North since 1991.
One of the main challenges of plant breeding is the expansion of cultivation to other regions, since it requires taking into account the adaptability of the species to different environmental conditions and the maintenance of its production stability. However, no studies on cowpea using methodologies with mixed models are found in the literature. These methodologies make it possible to predict the true Values for Cultivation and Use (VCU), and in this case, the effects of the genotype need to be assumed as the random effects in the statistical model
(PIEPHO, 1997; RESENDE, 2007; ROSADO et al.,
2012; VERARDIet al., 2009).
The assumption that the effects of the genotype are random makes it possible to obtain the Best Linear Unbiased Predictions (BLUP) of effects of the genotypes and G×E, which eliminate their noise by weighing such effects through a regressing factor, which is usually referred to as repeatability, which in practice refers to the heritability of the trait, thus leading to shrinkage estimates of such effects and to prediction of genetic values (PIEPHO, 1997; RESENDE, 2007; SEARLE; CASELLA; McCULLOCH, 1992).
This concept has been used together with the Restricted Maximum Likelihood (REML) method, developed by Patterson and Thompson (1971) as the optimal procedure for the estimation of components of variance, maximizing the likelihood function of the residuals, instead of the observed data, giving an incidence matrix of the fixed effects. Therefore, the REML-BLUP analysis has been the most recommended for tests using mixed model approaches (BORGESet al.,
2010; CARBONELL et al., 2007; MAIA et al., 2009;
PIMENTAet al., 2016; RESENDE, 2007; SCHAEFFER,
2004; SILVAet al., 2011; ZENI-NETOet al., 2008).
Using this type of approach, Borges et al. (2010) found responses varying from 1.06- to 1.08-fold the overall average for rice genotypes with better performance, in
tests conducted in 11 locations and 11 years. Bastoset al. (2007) evaluated the adaptability and stability of sugarcane genotypes and also found values for the selected clones with better performance than the overall average.
In this context, the objective of this work was to evaluate the response of grain yield of 16 lines and 4 cultivars to different locations and years, and the effects of G×E on the performance of cowpea genotypes by the methodology of mixed models.
MATERIAL AND METHODS
Sixteen elite lines and four cultivars from the Embrapa Mid-North Cowpea Breeding Program were evaluated—MNC02-675F-4-9 (1), MNC02-675F-4-2 (2), 675F-9-2 (3), 675F-9-3 (4), MNC02-676F-3 (5), MNC02-682F-2-6 (6), MNC02-683F-1 (7), MNC02-684F-5-6 (8), 725F-3 (9), MNC03-736F-7 (10), MNC03-737F-5-1 (11), MNC03-737F-5-4 (12), MNC03-737F-5-9 (13), MNC03-737F-5-10 (14), MNC03-737F-5-11 (15), MNC03-737F-11 (16), BRS-Tumucumaque (17), BRS-Cauamé (18), BRS-Itaim (19), and BRS-Guariba (20). The genotypes were evaluated under rainfed conditions in 47 experimental stations distributed in Brazil (Table 1, Figure 1) in three years (2010, 2011 and 2012); considering each location × year as a combination, making 82 different environments. The tests were conducted under randomized block design with four replications, the experimental plot consisted of four 5.0-m rows spaced 0.5 m apart, with 0.25 m between plants, and the evaluation area consisted of the two central rows.
An environment was initially considered as each location × year combination, with adjustments made for each year, considering the genotype effects as random and the location effects as fixed, according to the following
model: y = Xb + Zg + Ti + e. The joint analysis was
performed within each evaluation year according to the model: y = Xb + Zg + Ti + e, wherein y is the vector of observations;b is the vector of effects of the blocks × location combinations added to the overall average (fixed effects);g is the vector of genotype effects (assumed to be random); andi is the vector of effects of the genotype × location interaction (random). Subsequently, the analysis was performed considering the entire dataset, according
to the model:y = Xb + Zg + Qm + Ti + Uq + e, wherein
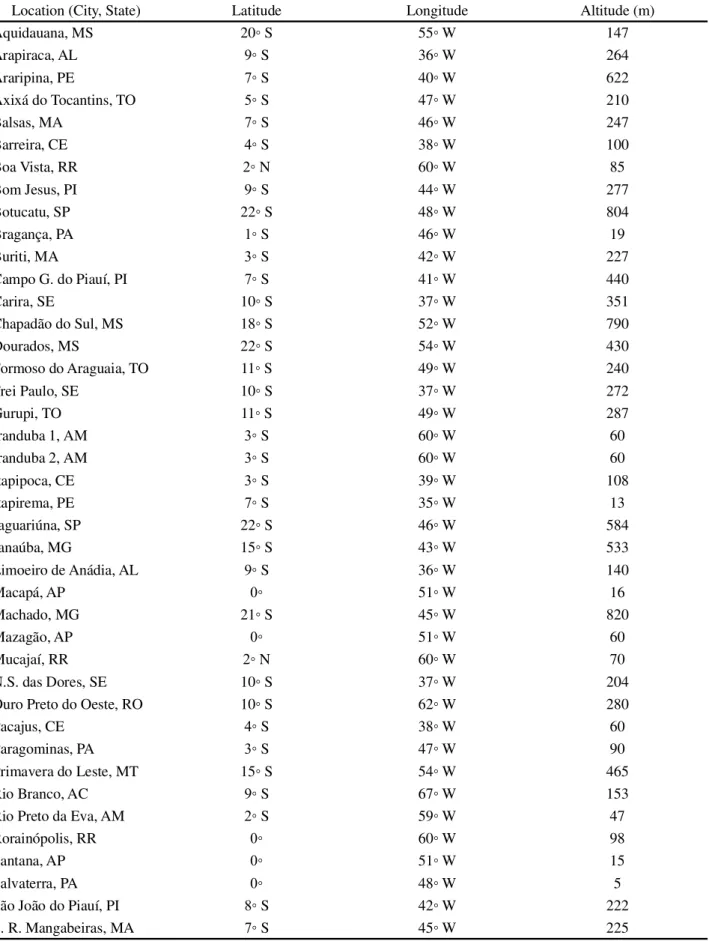
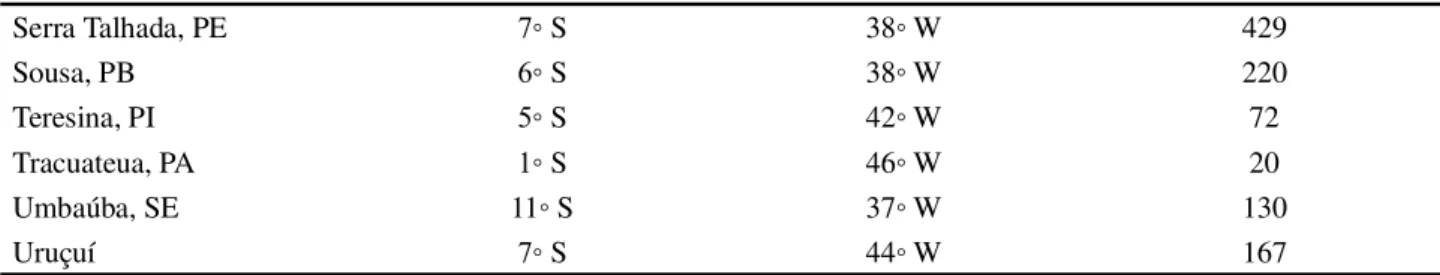
Table 1 - Locations and geographic descriptions of the experimental stations used in the Value for Cultivation and Use (VCU) tests during the period 2010-2012
Location (City, State) Latitude Longitude Altitude (m)
Aquidauana, MS 20◦ S 55◦ W 147
Arapiraca, AL 9◦ S 36◦ W 264
Araripina, PE 7◦ S 40◦ W 622
Axixá do Tocantins, TO 5◦ S 47◦ W 210
Balsas, MA 7◦ S 46◦ W 247
Barreira, CE 4◦ S 38◦ W 100
Boa Vista, RR 2◦ N 60◦ W 85
Bom Jesus, PI 9◦ S 44◦ W 277
Botucatu, SP 22◦ S 48◦ W 804
Bragança, PA 1◦ S 46◦ W 19
Buriti, MA 3◦ S 42◦ W 227
Campo G. do Piauí, PI 7◦ S 41◦ W 440
Carira, SE 10◦ S 37◦ W 351
Chapadão do Sul, MS 18◦ S 52◦ W 790
Dourados, MS 22◦ S 54◦ W 430
Formoso do Araguaia, TO 11◦ S 49◦ W 240
Frei Paulo, SE 10◦ S 37◦ W 272
Gurupi, TO 11◦ S 49◦ W 287
Iranduba 1, AM 3◦ S 60◦ W 60
Iranduba 2, AM 3◦ S 60◦ W 60
Itapipoca, CE 3◦ S 39◦ W 108
Itapirema, PE 7◦ S 35◦ W 13
Jaguariúna, SP 22◦ S 46◦ W 584
Janaúba, MG 15◦ S 43◦ W 533
Limoeiro de Anádia, AL 9◦ S 36◦ W 140
Macapá, AP 0◦ 51◦ W 16
Machado, MG 21◦ S 45◦ W 820
Mazagão, AP 0◦ 51◦ W 60
Mucajaí, RR 2◦ N 60◦ W 70
N.S. das Dores, SE 10◦ S 37◦ W 204
Ouro Preto do Oeste, RO 10◦ S 62◦ W 280
Pacajus, CE 4◦ S 38◦ W 60
Paragominas, PA 3◦ S 47◦ W 90
Primavera do Leste, MT 15◦ S 54◦ W 465
Rio Branco, AC 9◦ S 67◦ W 153
Rio Preto da Eva, AM 2◦ S 59◦ W 47
Rorainópolis, RR 0◦ 60◦ W 98
Santana, AP 0◦ 51◦ W 15
Salvaterra, PA 0◦ 48◦ W 5
São João do Piauí, PI 8◦ S 42◦ W 222
Serra Talhada, PE 7◦ S 38◦ W 429
Sousa, PB 6◦ S 38◦ W 220
Teresina, PI 5◦ S 42◦ W 72
Tracuateua, PA 1◦ S 46◦ W 20
Umbaúba, SE 11◦ S 37◦ W 130
Uruçuí 7◦ S 44◦ W 167
Continued Table 1
q is the vector of effects of the genotype × location × year triple interaction (random); e is the vector of errors (random).X,Z,Q,T andU are the incidence matrices for these effects, respectively, assuming g∼ N(0,Iσg2) ande
∼ N(0,Iσe2).
The Restricted Maximum Likelihood (REML)-Best Linear Unbiased Prediction (BLUP) procedure was used to compute the components of variance and subsequent prediction of random effects. The significance test for these effects was given by the Likelihood Ratio Test (LRT), considering theχ2. The experimental quality
of all tests was measured by the Selective Accuracy
statistics (RESENDE; DUARTE, 2007), defined as:SA =
[1 / 1 + (σe2 / r) / σ g
2]0, 5, whereinr is the number of blocks
used in the tests,σe2 is the residue variance, andσ
g
2 is the
genotypic variance.
Based on the random effects obtained through the joint analysis, the predicted genotypic values were obtained byμ +g
i, whereinμ is the mean of all locations
and g
i is the genotypic effect free from the G×E. The
criterion for the joint selection of genotypes, considering simultaneously the grain yield, stability and adaptability was given by the statistic of Mean Harmonic of Relative Performance of Genotypic Values (RESENDE, 2007): HMRPGVi = n / [∑j = 1n(1 / Vg
ij)], whereinn is the number
of locations andVgij is the genotype value for the genotype i expressed as the proportion of the mean of the location j. All analyzes in the present study were performed using the statistical program R (R 3.1.2).
RESULTS AND DISCUSSION
The experimental precision measured by the accuracy had values ranging from 0.24 to 0.98, and overall mean (considering all locations evaluated) of 0.79. According to Resende and Duarte (2007), accuracy values below 0.5 are low, from 0.5 to 0.7 are average, from 0.7 to 0.9 are high, and above 0.9 are very high, thus, 42% of the experiments presented high experimental accuracy and 38% presented very high accuracy.
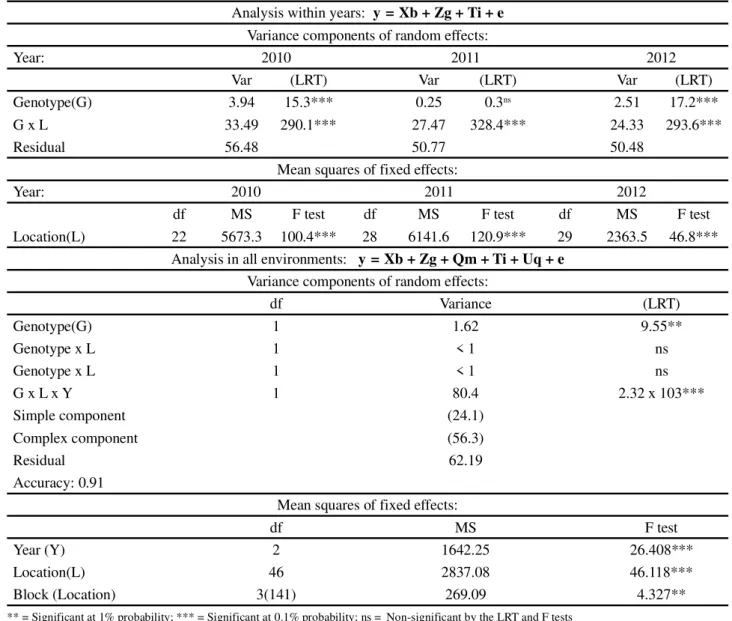
The components of variance of the random effects and mean squares of the fixed effects obtained by the analysis within each year by mixed models are presented in Table 2. All sources of variation had highly significant effects within the three years of evaluation, except the genotype effect within 2011. The mean squares for the genotype effect presented different variation patterns over the years, highlighting the variation between genotypes in 2010, which was approximately 15-fold higher than the variation within 2011. On the other hand, the mean square for the effect of locations was greater within 2011.
According to the results of the joint analysis considering the whole dataset, the effects of genotypes were significant (p<0.01) by the LRT test; and the genotype × location interaction (G×L) and genotype × year interaction (G×Y) presented no significant differences. However, the triple interaction was significant (p≤0.001), which confirms the strong effect of the G×E on the performance of the genotypes evaluated. The accuracy value was higher than 90%, indicating a satisfactory experimental accuracy for the joint analysis (RESENDE; DUARTE, 2007).
Table 2 -Analysis of variance within and between different years for grain yield of 20 cowpea genotypes evaluated in three years and 47 locations
** = Significant at 1% probability; *** = Significant at 0.1% probability; ns = Non-significant by the LRT and F tests
Analysis within years: y = Xb + Zg + Ti + e Variance components of random effects:
Year: 2010 2011 2012
Var (LRT) Var (LRT) Var (LRT)
Genotype(G) 3.94 15.3*** 0.25 0.3ns 2.51 17.2***
G x L 33.49 290.1*** 27.47 328.4*** 24.33 293.6***
Residual 56.48 50.77 50.48
Mean squares of fixed effects:
Year: 2010 2011 2012
df MS F test df MS F test df MS F test
Location(L) 22 5673.3 100.4*** 28 6141.6 120.9*** 29 2363.5 46.8***
Analysis in all environments: y = Xb + Zg + Qm + Ti + Uq + e
Variance components of random effects:
df Variance (LRT)
Genotype(G) 1 1.62 9.55**
Genotype x L 1 < 1 ns
Genotype x L 1 < 1 ns
G x L x Y 1 80.4 2.32 x 10³***
Simple component (24.1)
Complex component (56.3)
Residual 62.19
Accuracy: 0.91
Mean squares of fixed effects:
df MS F test
Year (Y) 2 1642.25 26.408***
Location(L) 46 2837.08 46.118***
Block (Location) 3(141) 269.09 4.327**
Although the effects of genotypes were not significant (p>0.05) in 2011, they were significant in 2010 and 2012. The G×L was significant within the three years evaluated, which justifies the use of all years in the overall joint analysis. According to Silva et al. (2011), the absence of significant effects of genotypes is expected in cases of tests with very contrasting environments. These results indicate that the different performances of the genotypes were caused by a combination of factors that can be represented by the G×L×E triple interaction to the detriment of the other interaction effects and the main effects of genotypes.
According to Yan and Hunt (2002), in cases where the proportion of variation explained by the interaction
component is greater than that explained by the differences between genotypes, the locations are grouped within mega-environments; this information is essential for the recommendation of cultivars. The effects of years, and locations were significant (p< 0.001), i.e., both contributed significantly to the triple interaction.
modeling may be inefficient when only fixed effects are used (BERNARDO, 2010).
The comparison between the ordering of the phenotypic mean for the trait of each genotype, the genotypic values free from the interaction (BLUP of each genotype added to the overall average) and the HMRPGV statistic is shown in Table 3. There was no differences between the classifications obtained by the phenotypic means and the genotypic values; and according to both, the five best genotypes were, in decreasing order: BRS-Tumucumaque, BRS-Guariba, MNC03-737F-5-9, MNC03-737F-5-1, and BRS-Cauamé. When the genotype performance was capitalized by the stability and adaptability (HMRPGV), the genotype 20 stood out as the one with the best performance, followed by 17, 13, 11, and 5.
The response of the genotype with the best performance, according to the HMRPGV (genotype 20), was about 1.09-fold higher than the overall average of the environments, i.e., this genotype was approximately 9% superior than the overall average of the 47 locations.
Table 3 -Response to grain yield of 20 cowpea genotypes evaluated in 47 locations and three years, according to the overall average, genotypic values free from the interactions, and Harmonic Mean of Relative Performance of Genetic Values (HMRPGV)
The use of the mixed model methodology to evaluate adaptability and stability in cowpea are scarce in the literature (SANTOS et al., 2016; TORRES et al., 2015). Torres et al. (2015) found average gains of 18% with the selection of the best genotypes, which is twice the gains obtained in the present study. However, the fact that this study considered a significantly larger number of environments, directly affected the amplitude of the recommendation of genotypes based on the GxE pattern.
Carbonellet al. (2007) evaluating adaptability and stability using mixed models in common bean (Phaseolus vulgaris L.), reported HMRPGV of 1.11-fold the overall average when considered the best bean genotype. These authors attributed this difference to a high precision of selection due to the use of HMRPGV statistics.
The selection of the five best genotypes based on HMRPGV (lines 5, 11, 13, 17 and 20) resulted in a new average of 65.4 (representing approximately 1,402 kg ha-1), which is higher than the average obtained by the
selection based only on the predicted genotypic mean value for all environments (1,230 kg ha-1). This result
Code Genotype Average μ + gi C.I (95%) HMRPGV
1 MNC02-675F-4-9 59.94 60.06 59.07 - 61.04 63.37
2 MNC02-675F-4-2 59.16 59.61 58.62 - 60.59 61.77
3 MNC02-675F-9-2 58.08 58.98 57.99 - 59.96 61.01
4 MNC02-675F-9-3 59.63 59.881 58.89 - 60.86 62.73
5 MNC02-676F-3 60.87 60.60 59.61 - 61.58 64.95
6 MNC02-682F-2-6 57.67 58.74 57.75 - 59.73 60.97
7 MNC02-683F-1 61.10 60.73 59.74 - 61.72 64.20
8 MNC02-684F-5-6 60.92 60.63 59.64 - 61.62 64.42
9 MNC03-725F-3 60.07 60.14 59.15 - 61.12 63.57
10 MNC03-736F-7 57.22 58.47 57.48 - 59.46 60.11
11 MNC03-737F-5-1 61.94 61.22 60.23 - 62.21 65.16
12 MNC03-737F-5-4 61.06 60.71 59.72 - 61.69 61.72
13 MNC03-737F-5-9 62.11 61.32 60.33 - 62.30 65.17
14 MNC03-737F-5-10 60.49 60.38 59.39 - 61.36 63.22
15 MNC03-737F-5-11 60.72 60.51 59.52 - 61.50 62.05
16 MNC03-737F-11 59.94 60.06 59.07 - 61.04 62.18
17 BRS Tumucumaque 62.78 61.71 60.72 - 62.69 65.69
18 BRS Cauamé 61.30 60.85 59.86 - 61.83 63.69
19 BRS Itaim 57.07 58.39 57.40 - 59.38 59.29
20 BRS Guariba 62.33 61.45 60.46 - 62.43 65.73
confirms the advantage of using the HMRPGV method in the recommendation of varieties, as well as in the formation of populations for breeding programs.
CONCLUSIONS
1.The genotypes MNC02-676F-3, MNC03-737F-5-1, MNC03-737F-5-9, Tumucumaque and BRS-Guariba are suitable for planting in the environments evaluated, since they have good stability combined to a superior performance compared to the other genotypes evaluated;
2. The use ofHMRPGV statistics in the evaluation of grain yield variations in cowpea is advantageous compared to the selection by phenotypic mean;
3. The present study highlights the use of this methodology (HMRPGV) when there is a need for evaluations of G×E interaction, while considering a wide spatial and temporal variation, since in these cases, an efficient analysis with simplified interpretation of the results is necessary.
REFERENCES
BASTOS, I. T.et al. Avaliação da interação genótipo x ambiente em cana-de-açúcar via modelos mistos.Pesquisa Agropecuária Tropical, v. 37, p. 195-203, 2007.
BERNARDO, R. Breeding for quantitative traits in plants. 2nd. ed. Minnesota: Stemma Press, 2010. 400 p.
BORGES, V. et al. Desempenho genotípico de linhagens de arroz de terras altas utilizando metodologia de modelos mistos. Bragantia, v. 69, n. 4, p. 833-841, 2010.
CARBONELL, S. A. M. et al. Estabilidade de cultivares e linhagens de feijoeiro em diferentes ambientes no estado de São Paulo.Bragantia, v. 66, n. 2, p. 193-201, 2007.
MAIA, M. C. C. et al. Seleção simultânea para produção, adaptabilidade e estabilidade genotípicas em clones de cajueiro, via modelos mistos. Pesquisa Agropecuária Tropical, v. 39, n. 1, p. 43-50, 2009.
PATTERSON, H. D.; THOMPSON, R. Recovery of inter-block information when inter-block sizes are unequal.Biometrika, v. 58, n. 3, p. 545-554, 1971.
PIEPHO, H. P. Analyzing genotype-environment data by mixed models with multiplicative effects.Biometrics, v. 53, p. 761-766, 1997.
PIMENTA, S.et al. Adaptabilidade e estabilidade de híbridos de pimentão nos sistemas convencional e orgânico.Horticultura Brasileira, v. 34, n. 2, 2016.
RESENDE, M. D. V. Matemática e estatística na análise de experimentos e no melhoramento genético. Colombo: Embrapa Florestas, 2007. 435 p.
RESENDE, M. D. V.; DUARTE, J. B. Precisão e controle de qualidade em experimentos de avaliação de cultivares.Pesquisa Agropecuária Tropical, v. 37, p. 182-194, 2007.
ROSADO, A. M.et al. Seleção simultânea de clones de eucalipto de acordo com produtividade, estabilidade e adaptabilidade. Pesquisa Agropecuária Brasileira, v. 47, p. 964-971, 2012. SANTOS, A. D. et al. Adaptability and stability of erect cowpea genotypes via REML/BLUP and GGE Biplot. Bragantia, v. 75, n. 3, p. 299-306, 2016.
SCHAEFFER, L. R. Application for random models in animal breeding.Livestock Production Science, v. 86, p. 35-45, 2004. SEARLE, S. R.; CASELLA, G.; McCULLOCH, C. E.Variance components. New York: John Wiley & Sons, 1992. 501 p. SILVA, G. O.et al. Verificação da adaptabilidade e estabilidade de populações de cenoura pelos métodos AMMI, GGE biplot e REML/BLUP.Bragantia, v. 70, n. 3, p. 494-501, 2011. SINGH, A.et al. Cowpea (Vigna unguiculata [L.] Walp.) genotypes response to multiple abiotic stresses.Journal of Photochemistry and Photobiology B: Biology, v. 100, p. 135-146, 2010.
TORRES, F. E. et al. Interação genótipo x ambiente em genótipos de feijão-caupi semiprostrado via modelos mistos. Bragantia, v. 74, n. 3, p. 255-260, 2015.
VERARDI, C. K. et al. Adaptabilidade e estabilidade da produção de borracha e seleção em progênies de seringueira. Pesquisa Agropecuária Brasileira, 2009.
VIJAYKUMAR, A.; SAINI, A.; JAWALI, N. Phylogenetic analysis of subgenus vigna species using nuclear ribosomal RNA ITS: evidence of hybridization among Vigna unguiculata
subspecies.Journal of Heredity, v. 101, n. 2, p. 177-188, 2010. YAN, W.; HUNT, L. A. Biplot analysis of diallel data. Crop Science, v. 42, p. 21-30, 2002.