ABSTRACT:The use of eco-friendly mulch materials as alternatives to the standard polyethylene (PE) has become increasingly prevalent worldwide. Consequently, a comparison of mulch materi-als from different origins is necessary to evaluate their feasibility. Several researchers have com-pared the effects of mulch materials on each crop variable through univariate analysis (ANOVA). However, it is important to focus on the effect of these materials on fruit quality, because this factor decisively infl uences the acceptance of the fi nal product by consumers and the industrial sector. This study aimed to analyze the information supplied by a randomized complete block experiment combined over two seasons, a principal component analysis (PCA) and a cluster analysis (CA) when studying the effects of mulch materials on the quality of processing tomato (Lycopersicon esculentum Mill.). The study focused on the variability in the quality measurements and on the determination of mulch materials with a similar response to them. A comparison of the results from both types of analysis yielded complementary information. ANOVA showed the similarity of certain materials. However, considering the totality of the variables analyzed, the fi nal interpretation was slightly complicated. PCA indicated that the juice color, the fruit fi rmness and the soluble solid content were the most infl uential factors in the total variability of a set of 12 juice and fruit variables, and CA allowed us to establish four categories of treatment: plas-tics (polyethylene - PE, oxo- and biodegradable materials), papers, manual weeding and barley (Hordeum vulgare L.) straw. Oxobiodegradable and PE were most closely related based on CA.
Introduction
Several plastic fi lms have been used as mulching in vegetable crops, with polyethylene (PE) being the most widespread. However, new materials described in detail by Martín-Closas and Pelacho (2011) and Kasirajan and Ngouajio (2012) have appeared recently due to the non-degradability of these fi lms. Most of them demonstrated satisfactory behavior in relation to weed control and crop yields (Moreno et al., 2009; Cirujeda et al., 2012). Fruit quality infl uences the degree of acceptance of the fi nal product, so some of the aspects relating to exter-nal appearance are even more important than the price for the average consumer (Shewfelt, 1990; Gómez et al., 2001). For tomatoes (Lycopersicon esculentum Mill.), taste, appearance, color and handling characteristics are cru-cial for fresh fruits, while color, consistency, soluble sol-ids, acidity, dry matter and juice content are considered for processing tomatoes (Moraru et al., 2004). Another important aspect is the concentration of lycopene, a ca-rotenoid responsible for the red fruit color with strong antioxidant activity, and, therefore, benefi cial for human nutrition and health (Leoni, 2006).
In previous studies, the effect of mulches on to-mato fruit quality has been analyzed using the analysis of variance (ANOVA) technique, which considers the variables analyzed independently (Moreno and Moreno, 2008). However, in a complete study there are several variables present together (multivariate analysis), which add a characteristic particularity to the situation under study (Bentham et al., 1992).
When establishing criteria for grouping mulch treatments, two materials will belong to the same group when they do not present signifi cant differences in any variable studied (by ANOVA). However, what happens when a material differs from another in one (or more) variables? Is it different a priori, or can it be considered to be similar? What happens with the global variability? In a previous study, from a multivariate perspective, Moreno et al. (2013) approached the behavior of the same mulch treatments but considered variables relating to yield and weed control, and also included fewer fruit quality attri-butes. In this study, we present the information provided by ANOVA in conjunction with that derived from the use of principal component analysis (PCA) and cluster analy-sis (CA) as multivariate techniques, with the aim of mod-eling the response of processing tomato fruit quality to several mulches of different composition.
Materials and Methods
Research site and fi eld design
From 2007 to 2008, fi eld trials were carried out in two adjacent plots in Ciudad Real, Spain (3º56’ W; 39º0’ N, altitude 640 m). The climate of this region is conti-nental Mediterranean. The mean, maximum and mini-mum air temperatures during the cropping periods (May to Sept) were 21.9, 30.4 and 12.6 ºC in 2007 and 22.9, 31.6 and 13.2 ºC in 2008, respectively. The soil was a Xe-ralfs, Petrocalcic Palexeralfs (USDA, 2010), moderately basic (pH1:2.5 soil:water 8.1), non-saline (Electrical Conductiv-ity, EC 0.29 dS m−1), with a loamy texture (an average of
Received August 01, 2013 Accepted October 21, 2013
1University of Castilla-La Mancha/School of Agricultural Engineering − Dept. of Mathematics.
2University of Castilla-La Mancha/School of Agricultural Engineering − Dept. of Plant Production and Agricultural Technology, Ronda de Calatrava, 7 – 13071 – Ciudad Real – Spain.
3Technical University of Madrid/E.T.S.I.A/CEIGRAM − Dept. of Applied Mathematics to Agriculture Engineering, Ciudad Universitaria, s/n − 28040 − Madrid − Spain.
*Corresponding author <[email protected]> Edited by: Thomas Kumke
Univariate and multivariate analysis on processing tomato quality under different
Carmen Moreno1, Ignacio Mancebo2, Ana María Tarquis3, Marta María Moreno2*
460 g kg−1 sand, 330 g kg−1 silt, 210 g kg−1 clay), and with
a level of organic matter around 21 g kg−1.
A randomized complete block design was adopted with four replicates and eight mulch treatments of dif-ferent natures: two biodegradable (BD1, BD2) plastic mulches composed of corn starch, one oxo-biodegrad-able (OB) material, two types of paper (PP1, PP2), one barley (Hordeum vulgare L.) straw (BS) cover, and stan-dard black polyethylene (PE) and manual weeding (MW) as control treatments. The main characteristics of the treatments used and the codes assumed in each case are summarized in Table 1. In manual weeding, weed con-trol was performed as necessary three times during each crop cycle. Each experimental plot consisted of a single crop row 23 m long by 1.5 m wide, with 0.2 m plant spacing and beds 0.8 m wide.
The processing tomato cv. “Perfect Peel F1” was transplanted into the open air on May 18, 2007 and on June 4, 2008, two days after mechanical mulching. The crops were irrigated daily by a trickle irrigation system. Irrigation amounts were estimated from the reference evapotranspiration and phenological stage of the crop (Allen et al., 1998). Fertilization was supplied as organic vermicompost and organic foliar fertilisers.
A single harvest in each treatment was carried out at the end of the growing seasons (101 to 105 days after transplanting), with ripe fruits accounting for approxi-mately 80 % of the total healthy fruits in each treatment.
Tomato quality determinations
At harvest, 20 marketable ripe fruits were selected at random from each plot and washed with distilled water. The tomatoes were then evaluated on the basis of a num-ber of physical and nutritional attributes considered to be indicators of quality in processing tomatoes: fruit and juice color, fi rmness, juice content, dry matter, soluble solids, titratable acidity, pH, consistency and lycopene content.
The external color and fi rmness of the fruits were measured at two opposite equatorial surface locations on each fruit. Tomato color was measured in the Hunter Lab color space using a Minolta Chroma Meter CR400/410 (Minolta Corp., Osaka, Japan) with the CIE illuminant
C. The L value indicates the ratio of white to black color; the a value the ratio of red to green color; and the b value the ratio of yellow to blue color. The a/b ratio (red to green component of color) is commonly used as a red-ness index to report the color quality (brightred-ness of red color) of tomatoes and tomato products (Akdeniz et al., 2012). This variable is also correlated with lycopene ac-cumulation in tomatoes (Giovanelli et al., 1999).
Fruit fi rmness was measured in the pericarp tis-sue by an FT-327 penetrometer (Bertuzzi, Facchini, Italy) with a probe 8 mm in diameter, and was expressed as kg cm–2. Then all fruits were divided into three equal parts:
one part was used to determine the dry matter content in an oven set at 70 ºC until constant weight was achieved (units expressed as grams per 100 g fresh weight), the sec-ond part to determine the juice content by using a con-ventional juicer extractor, removing the seeds and skins and measuring the juice color as previously indicated for whole fruits (units expressed as grams per 100 g fresh weight); and the third part was homogenized and used for the remaining determinations.
Soluble solids were measured using a digital re-fractometer ATAGO PR-32 (Atago Co. LTD, Tokyo, Ja-pan) with automatic temperature compensation, which provides values as °Brix. pH was determined using a pH meter, and titratable acidity was quantifi ed by titrat-ing 5 g of tomato paste with 0.1 mol L−1 NaOH to pH
8.1 with an automatic sample titrimeter (TitroMatic 1S-2B, Crison, Barcelona, Spain). Acidity was expressed as grams of citric acid equivalent per 100 g fresh weight. The consistency of the homogenate was determined by measuring the distance that the homogenate fl owed in 30 s under its own weight along a level surface (Barret et al., 1998) with a standard Bostwick consistometer (CSC Scientifi c, 1-800-458-2558, USA). Smaller Bostwick val-ues indicate a thicker, higher-consistency tomato prod-uct; therefore, smaller values are preferable in tomato processing (García and Barret, 2006).
Lycopene determination was based on a spectropho-tometric analysis using a Lambda-Bio40 spectrophotom-eter (Perkin-Elmer, Waltham, MA, USA). Lycopene extrac-tions were performed with 2 g of homogenate, which were shaken for 15 min in 50 mL of hexane, 25 mL of acetone and 25 mL of ethanol and then shaken for a further fi ve minutes after the addition of 5 mL of distilled water. Then, 5 mL of the upper layer was recovered and increased to 10 mL with hexane. The samples were shaken again, and measurements were immediately taken by the spectropho-tometer. A calibration line relating standard concentrations and absorbance at 510 nm was used to obtain lycopene concentrations (Roselló et al., 2011). Lycopene content was expressed as milligrams per 100 g fresh weight. With the exceptions of dry fruit matter and juice content, all assess-ments were carried out in duplicate.
Univariate and Multivariate analysis methods The differences among the mean values obtained in each mulch treatment in relation to the fruit and juice
Table 1 − Characteristics of the mulch treatments.
Code Treatment/Material Color
Thickness
(µm) / Weight (g m−2)
Width (m)
Supplier company
PE Polyethylene (petrochemical plastic) Black 15 µm 1.00 Siberline
OB Oxo-biodegradable plastic Black 15 µm 1.10 Genplast BD1 Biodegradable plastic1 Black 17 µm 1.40 Barbier
BD2 Biodegradable plastic1 Black 15 µm 1.20
Nova-mont PP1 Paper (recycled) Brown 140 g m−2 1.20 Saica
PP2 Paper Black 85 g m−2 1.20 Mimcord
BS Barley straw - - -
-MW Manual weeding - - -
vidual objects as separate clusters. Then, pair-wise dis-tances between clusters are computed, and the pair with the smallest distance between them is connected to form new clusters, resulting in the corresponding dendrogram. The similarities among groups were quantifi ed through the linkage distance (in x-axes). To fi nd the optimal cluster solution, approximately 50 % of the root node distance was considered as a reference value in the dendrogram, and the proximity to the value 1 of the cophenetic correla-tion coeffi cient was stated (Hair et al., 2009).
Multivariate and univariate analysis techniques were implemented by Infostat v. 2007 professional with a module taken from the R module statistical package used for estimating linear and generalized linear models.
Results and Discussion
Univariate analysis (ANOVA model)
Year and mulch treatment did not interact (see p
-value of treatment × year in Table 2); consequently, the mean of each treatment (averaged across years) in the fruit and juice variables could be used to discuss the ef-fects of treatment. ANOVA successfully refl ects the spe-cifi c response to treatments for each independent variable and shows precisely the similarities or differences among mulch materials in relation to each variable. Thus, for ex-ample, we can state for the soluble solid content that BS is different (p < 0.05) from PE, while PE is not different from OB, BD1, BD2 or MW.
Fruits obtained from BS have higher soluble solids, dry matter, lycopene and a/b juice than those from the other treatments – Table 2 (5 %, 23 %, 9 % and 34 % above the trial average, respectively), although BS was not different (p > 0.05) from all of them. The highest fruit soluble solid contents and dry matter accumulation in BS could be explained by an increase in soil salinity, as de-scribed by Moreno et al. (2013) and Dorais et al. (2001a, quality variables analyzed were evaluated by univariate
analysis at level of signifi cance 0.05. The data correspond-ing to these variables were analyzed with an ANOVA mixed model by using a factorial nested design (Mont-gomery, 2012), including mulch treatments and years taken into consideration the blocks nested in years, both as random effects, as indicated by McIntoch (1983). Ana-lyzing the effect of one variable at a time with the ANOVA technique can provide useful information, and in some cases, the univariate approach is the best and easiest tool. The multivariate response of the treatments was evalu-ated following guidelines prescribed by Hair et al. (2009) using a principal component analysis (PCA) and a cluster analysis (CA).
PCA is a statistical technique that transforms a set of interrelated variables into a set of uncorrelated vari-ables. The newly formed variables (PCs) are linear com-binations of the original variables. This tool can indicate the variables that are the most infl uential on system vari-ability. The fi rst principal component, PC1, given by the eigenvector associated with the highest eigenvalue of the
p × p correlation matrix, l
1, explains the highest percent-age of the system variability, l1/p %. The second principal component, PC2, corresponds to a lower proportion of the variance, l2/p %, and so on.
In this study, a PCA was performed on the eight treatments defi ned by the corresponding average val-ues in each of the variables considered. The number of extracted components (PCs) was determined by using scree plots (Hair et al., 2009). Then, a CA considering the PCs extracted by the PCA as variables was performed. By defi ning a metric, CA points to the proximity among mulches to categorize mulch treatments into possible groups. A hierarchical clustering method (UPGMA, Un-weighted Pair Group Method with Arithmetic Mean) was used to identify clusters of treatments with similar behaviour. The grouping process fi rst considers the
indi-Table 2 − Univariate analysis. Effect of mulch treatments on tomato quality variables (years 2007 and 2008) and summary of the analysis of variance.
Treatment1 Soluble solids Acidity pH Juice Dry matter Firmness Consistency Lycopene L fruit a/b fruit L juice a/b juice oBrix % --- % --- kg cm–2 cm mg 100 g–1
PE 4.27 c 0.30 a 4.30 a 50.08 bc 5.24 c 4.37 bc 6.90 a 11.71 ab 32.21 c 1.67 a 33.51 bc 2.94 bc OB 4.23 c 0.33 a 4.20 a 50.57 bc 5.29 c 4.13 c 6.75 a 11.62 ab 32.51 c 1.68 a 32.52 bc 3.19 ab BD1 4.38 bc 0.34 a 4.30 a 55.24 ab 5.77 ab 4.19 c 6.21 a 10.49 b 32.46 c 1.68 a 34.69 abc 2.92 bc BD2 4.42 bc 0.33 a 4.31 a 50.16 bc 5.46 bc 4.13 c 6.90 a 11.23 ab 32.58 bc 1.67 a 33.83 abc 2.87 bc PP1 4.53 ab 0.34 a 4.25 a 53.80 abc 5.36 bc 4.47 abc 6.18 a 12.29 a 33.99 a 1.62 a 35.86 ab 2.73 bc PP2 4.58 ab 0.30 a 4.34 a 48.89 c 5.72 abc 4.26 bc 7.05 a 11.66 ab 33.65 ab 1.67 a 37.08 a 2.52 c BS 4.68 a 0.32 a 4.32 a 58.20 a 6.98 a 4.55 ab 7.56 a 12.72 a 33.44 ab 1.68 a 33.38 bc 4.08 a MW 4.44 abc 0.36 a 4.25 a 49.84 bc 5.24 c 4.76 a 6.19 a 11.05 ab 33.67 a 1.68 a 31.37 c 3.06 abc
Average 4.44 0.325 4.28 52.09 5.63 4.36 6.72 11.59 33.03 1.66 34.03 3.04
Source ANOVA
Probability p < 0.05
Treatment 0.0048 0.4145 0.6569 0.0003 0.0003 0.0094 0.7076 0.0885 <0.0001 0.3111 0.0194 0.0035 Year 0.0040 0.6834 0.0804 0.0356 0.0460 0.0044 0.0010 0.4536 0.0009 0.4198 0.0001 0.0210
Treat × Year 0.0954 0.3705 0.3084 0.2227 0.1166 0.9506 0.3749 0.5841 0.0981 0.0860 0.1773 0.2579
b). The high lycopene content in BS and, consequently,
the a/b color variable, also coincide with the results
ob-tained by Kubota et al. (2006) and Urbanonoviciene et al. (2012). This trend is in agreement with Amans et al. (2011), who concluded, in a study on the nutritional prop-erties of tomato fruits with different mulch materials and environments, that the fruits obtained using rice (Oryza sativa L.) straw as a mulch had higher dry matter and carbohydrate contents than those harvested from black PE mulch. In an analysis of other fruit parameters, Hong et al. (2000) found that the fi rmness and soluble solids of red-ripe tomatoes were higher (p < 0.05) for plants grown with vegetable mulch compared to black PE as result of greater leaf carbohydrate content derived from a higher photosynthesis rate.
The principal limitation of the use of univariate analysis resides in the ignoring of overall behavioral re-sponses (considering the totality of variables) of the dif-ferent mulch materials, and therefore does not consider the possibility of grouping mulch treatments with similar behaviors. ANOVA shows, for example, that PE, OB and BD2 would be similar (no different letters in the columns of the Table 2). However, observing the results in Table 2, leads us to the following questions:
(i): regarding variables, how important are the quality variables to the global system variability?
(ii): in terms of grouping mulch treatments, would BD1 be similar to both PE and OB differing from them only in fruit dry matter content? What about PP1 and PE, if they are only different in soluble solids and L fruit? Ad-ditionally, what about PP1 and MW, if they differ only in terms of L juice? Which treatment is more similar to PE: BD1, PP1 or MW? Is BS so different from the other mulch treatments as ANOVA shows?
PCA and CA can address these questions.
Multivariate analysis
In general, to obtain a correct assessment in an integrated descriptive study, the appropriate method should take several variables into account together (D’Andrea et al., 2008). This approach is especially valu-able in observational studies, in which total control is never possible (White, 1993). Even in fi eld studies, in which the researcher can exercise some control over the experiment, total control is never truly possible. Multi-variate data analysis uses mathematical and statistical techniques to extract information from complex data sets, and computer advances have facilitated their use (Cozzolino et al., 2009).
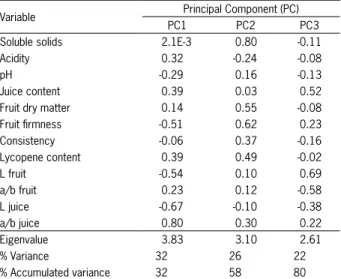
In this study, the scree plot related to PCA, ob-tained as in Hair et al. (2009), suggested that the fi rst three principle axis explained a suffi cient amount of variance. These components explained approximately 80 % of the total variability. The results of this analysis are shown in Table 3, where we can see the percentage of variance explained by each PC (32, 26 and 22,
respec-tively), the accumulated variance and the total accumu-lated variance (80).
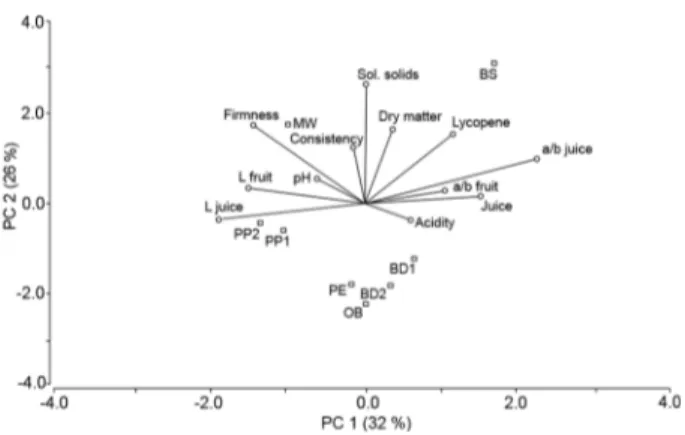
The values shown in each of the three columns (PCs) of Table 3 indicate the correlations of the sponding variables with these PCs. In the biplot corre-sponding to the scores of the treatments in the fi rst two axes (58 % of the variance) (Figure 1), and according to Table 3, we can see that the most infl uential variables on total variability, corresponding to the longest vectors, were L and a/b juice, soluble solids and fi rmness (see also their high coeffi cient values in Table 3), and to a lesser extent, lycopene and L fruit. The smaller the an-gle between two vectors, the greater the positive correla-tion between the variables represented (i.e. L fruit and L juice; a/b fruit and a/b juice; total soluble solids and dry matter; lycopene and a/b measurements). If the angle is close to 180º, the correlation is negative (i.e. L fruit and L juice with a/b fruit and a/b juice, respectively; acidity with pH).
The infl uence of the L color variable on total vari-ability was observed in a previous study by Moreno et al. (2013), in line with Ordóñez-Santos et al. (2008). The current study also shows the great infl uence of both juice color and lycopene and the expected relationship between them (Gómez et al., 2001), the importance of the fi rmness and the relationships among the different quality variables and mulches (Table 3, Figure 1).
A dendrogram was obtained in the CA from the factor scores relative to the CPs extracted (Figure 2) to divide mulch treatments into possible groups. Regarding the grouping of mulch treatments, now, consulting the biplot and dendrogram (Figures 1, 2), one can more ac-curately interpret the results derived from the ANOVA (Table 2) and delineate the groups of mulch treatments. The following groups of mulch materials can be clearly established: plastics (PE, OB, BD1 and BD2), papers
Table 3 − Component analysis factor matrix on the adjusted means of the quality variables on the treatments. Principal component extraction method.
Variable Principal Component (PC)
PC1 PC2 PC3
Soluble solids 2.1E-3 0.80 -0.11
Acidity 0.32 -0.24 -0.08
pH -0.29 0.16 -0.13
Juice content 0.39 0.03 0.52
Fruit dry matter 0.14 0.55 -0.08
Fruit fi rmness -0.51 0.62 0.23
Consistency -0.06 0.37 -0.16
Lycopene content 0.39 0.49 -0.02
L fruit -0.54 0.10 0.69
a/b fruit 0.23 0.12 -0.58
L juice -0.67 -0.10 -0.38
a/b juice 0.80 0.30 0.22
Eigenvalue 3.83 3.10 2.61
% Variance 32 26 22
(PP1 and PP2), bare ground with manual weeding (MW) and cereal straw (BS).
Fruit quality is affected by environmental factors, such as temperature, solar radiation, irrigation regime, pH and electrical conductivity of the nutritive solution (Battilani, 2008). In this study we consider that the for-mation of the previous groups could be explained by the similar environmental conditions surrounding different treatments belonging to the same group, especially soil temperature (data not shown).
Figure 1 − Principal component (PC) plot with quality variables on processing tomato and mulch treatments (PE, Polyethylene; OB, oxo-biodegradable material; BD1 and BD2, biodegradable plastics; PP1 and PP2, papers; BS, barley straw; MW, manual weed control) (biplot).
Temperature has a direct infl uence on metabo-lism and, thus, indirectly affects cellular structure and other components which determine fruit texture (Sams, 1999). In this experiment, the mean soil temperature averaged across years increased in the order MW (21.9 ºC) < BS (22.2 ºC) < papers (22.3 ºC) < plastics (23.5 ºC), while fruit fi rmness, one of the most important factors of total variability (Table 3, Figure 1), varied in the opposite order (Table 2). This fi nding is in agree-ment with Sams (1999), who maintains that fi rmness is higher at lower temperatures because tissue density would be higher.
BD1 can be considered similar to both PE and OB, as they all belong to the same group. PP1 is similar to neither PE nor MW. Considering BD1, PP1 and MW, the most similar to PE is BD1 because they belong to the same group, and the most different from PE of the three treatments is MW (see distances of link in the dendro-gram shown in Figure 1). The proximity of OB, BD1 and BD2 to PE (especially OB) indicates that they are similar to PE in relation to the overall quality of the fruit, but they have the advantage of being much more environ-mentally friendly.
Both papers, PP1 and PP2, were also grouped together, contrary to those obtained by Moreno et al. (2013), who found that PP2 was more closely associated with the group of the plastic mulches including PE, OB and BD2, whereas PP1 was more similar to MW. This fi nding confi rms the discriminant effect of the variables related to weed control and, consequently, to yield, on both papers. On the other hand, the distancing of the mulch straw (BS) from the rest of the treatments be-comes especially noticeable; thus, it could be considered as an atypical mulch.
Based on the results obtained in PCA and CA (Ta-ble 3; Figures 1, 2), the previously asked questions relat-ing to global system variability and to grouprelat-ing mulch
treatments can now be answered (see Univariate analysis
section), and it is possible to more easily interpret the information derived from univariate analysis.
Conclusions
The most infl uential variables on the total variabil-ity are L and a/b juice, soluble solids and fi rmness, and to a lesser extent, lycopene and L fruit. Two groups of mulch materials could be established: plastics (PE, OB, BD1 and BD2) and papers (PP1 and PP2). Cereal straw (BS) could be considered as an atypical mulch. There-fore, the oxo- and biodegradable materials tested here constitute a proper alternative to polyethylene in rela-tion to the global fruit quality in processing tomato.
Acknowledgements
This study was funded by the Project INIA RTA2005-00189-C05-04, Spain. Materials were gener-ously provided by Novamont S.p.A., Saica S.A., Mimcord
S.A., Barbier S.A. and Genplast S.A companies. We thank Ramón Meco, Jaime Villena, Lorenzo Gómez and Javier Casanova for their assistance over the study period.
References
Akdeniz, B.; Kavak, D.D.; Bagdatlioglu, N. 2012. Use of factorial experimental design for analyzing the effect of storage conditions on color quality of sun-dried tomatoes. Scientifi c Research and Essays 7: 477-489.
Allen, R.G.; Pereira, L.S.; Raes, D.; Smith, M. 1998. Crop Evapotranspiration: Guidelines for Computing Crop Water Requirements. FAO, Rome, Italy.
Amans, E.B.; Abubakar, I.U.; Babaji, B.A.; Samaila, A. 2011. Nutritional quality of tomato (Lycopersicon esculentum Mill) as infl uenced by mulching, nitrogen and irrigation interval. Journal of Agricultural Science 3: 266-270.
Barret, D.M.; García, E.; Wayne, J.E. 1998. Textural modifi cation of processing tomatoes. Critical Reviews in Food Science and Nutrition 38: 173–258.
Battilani, A. 2008. Manipulating quality of horticultural crops with fertigation. Acta Horticulturae 792: 47-60.
Bentham, H.; Harris, J.A.; Birch, P., Short, K.C. 1992. Habitat classifi cation and soil restoration assessment using analysis of soil microbiological and physicochemical characteristics. Journal of Applied Ecology 29: 711-718.
Cirujeda, A.; Aibar, J.; Anzalone, A.; Martín-Closas, L.; Meco, R.; Moreno, M.M.; Pardo, A.; Pelacho, A.M.; Rojo, F.; Royo-Esnal, A.; Suso, M.L.; Zaragoza, C. 2012. Biodegradable mulch instead of polyethylene for weed control of processing tomato production. Agronomy for Sustainable Development 32: 889-897.
Cozzolino, D.; Cynkar, W.U.; Shah, N.; Damberg, R.G.; Smith, P.A. 2009. A brief introduction to multivariate methods in grape and wine analysis. International Journal of Wine Research 1: 123-130. D’Andrea, K.E.; Otegui, M.E.; De La Vega, A.J. 2008. Multiattribute
responses of maize inbred lines across managed environments. Euphytica 162: 381-394.
Dorais, M.; Papadopoulus, A.P.; Gosselin, A. 2001a. Greenhouse tomato fruit quality: the infl uence of environmental and cultural factors. Horticultural Reviews 26: 239-349.
Dorais, M.; Papadopoulus, A.P.; Gosselin, A. 2001b. Infl uence of electrical conductivity management on greenhouse tomato yield and fruit quality. Agronomie 21: 367-383.
García, E.; Barret, D.M. 2006. Assessing lycopene content in California processing tomatoes. Journal of Food Processing and Preservation 30: 56-70.
Giovanelli, G.; Lavelli, V.; Peri, C.; Nobili, S. 1999. Variation in antioxidant components of tomato during vine and post-harvest ripening. Journal of the Science of Food and Agriculture 79: 1583-1588.
Gómez, R., Costa, J.; Amo, M.; Alvarruiz, A. 2001. Physicochemical and colorimetric evaluation of local varieties of tomato grown in SE Spain. Journal of the Science of Food and Agriculture 81: 1101-1105. Hair, J.F.; Anderson, R.E.; Tatham, R.L.; Black, W.C. 2009. Multivariate
Data Analysis. 6ed. Prentice Hall, New York, NY, USA.
Hong, J.H.; Mills, D.J.; Coffman, C.B.; Anderson, J.D.; Camp, M.J.; Gross, K.C. 2000. Tomato cultivation systems affect subsequent quality of fresh-cut fruit slices. Journal of the American Society for Horticultural Science 125: 729-735.
Kasirajan, S.; Ngouajio, M. 2012. Polyethylene and biodegradable mulches for agricultural applications: a review. Agronomy for Sustainable Development 32: 501-529.
Kubota, C.; Thomson, C.A.; Wu, M.; Javanmardi, J. 2006. Controlled environments for production of value-added food crops with high phytochemical concentrations: lycopene in tomato as example. HortScience 41: 522-525.
Leoni, C. 2006. Content, behaviour and bioavailability of lycopene in processed tomatoes. p. 29-37. In: Venket, A., ed. Tomatoes, lycopene and human health: preventing chronic diseases. Caledonian Science Press, Badalona, Spain.
Martín-Closas, L.; Pelacho, A.M. 2011. Agronomic potential of biopolymer fi lms. p. 277-299. In: Plackett, D., ed. New materials for sustainable fi lms and coating: biopolymers. Wiley, New York, NY, USA.
McIntoch, M.S. 1983. Analysis of combined experiments. Agronomy Journal 75: 153-155.
Montgomery, D.C. 2012. Design and Analysis of Experiments. 8ed. Wiley, New York, NY, USA.
Moraru, C.; Logendra, L.; Lee, T.-Ch.; Janes, H. 2004. Characteristics of 10 processing tomato cultivars grown hydroponically for the NASA Advanced Life Support (ALS) Program. Journal of Food Composition and Analysis 17: 141-154.
Moreno, M.M.; Moreno, A. 2008. Effect of different biodegradable and polyethylene mulches on productivity and soil thermal and biological properties in a tomato crop. Scientia Horticulturae 116: 256-263.
Moreno, M.M.; Moreno, A.; Mancebo, I. 2009. Comparison of different mulch materials in a tomato (Solanum lycopersicum L.) crop. Spanish Journal of Agricultural Research 7: 454-464. Moreno, M.M.; Moreno, C.; Tarquis, A.M. 2013. Mulch materials
in processing tomato: a multivariate approach. Scientia Agricola 70: 250-256.
Ordóñez-Santos, L.E.; Arbones, E.; Vázquez-Oderiz, L.; Romero-Rodríguez, A.; Gómez, J.; López, M. 2008. Use of physical and chemical properties of commercial tomato (Lycopersicon esculentum Mill.) products for monitoring their quality. Journal of the Association of Offi cial Agricultural Chemists 91: 112-122. Roselló, S.; Adalid, A.M.; Cebolla-Cornejo, J.; Nuez, F. 2011.
Evaluation of the genotype, environment and their interaction on carotenoid and ascorbic acid accumulation in tomato germplasm. Journal of the Science of Food and Agriculture 91: 1014–1021.
Sams, C.E. 1999. Preharvest factors affecting postharvest texture. Postharvest Biology and Technology 15: 249–254.
Shewfelt, R.L. 1990. Quality of fruits and vegetables. Food Technology 44: 99-106.
United States Department of Agriculture [USDA]. 2010. Keys to Soil Taxonomy. USDA-Soil Survey Staff, Washington, DC, USA. Urbanonoviciene, D.; Viskelis, P.; Viskelis, J.; Jankauskiene, J.;
Bobinas, C. 2012. Lycopene and b-carotene in non-blanched and blanched tomatoes. Journal of Food Agriculture and Environment 10: 142-146.