www.eerp.usp.br/rlae
Corresponding Author: Paulo Carlos Garcia
Universidade de São Paulo. Hospital Universitário Av. Professor Lineu Prestes, 2565
Bairro: Butantã
CEP: 05508-000, São Paulo, SP, Brasil E-mail: [email protected]
Nursing care time and quality indicators for adult intensive care:
correlation analysis
1Paulo Carlos Garcia
2Fernanda Maria Togeiro Fugulin
3The objective of this quantitative, correlational and descriptive study was to analyze the
time the nursing staff spends to assist patients in Adult Intensive Care Units, as well as to
verify its correlation with quality care indicators. The average length of time spent on care
and the quality care indicators were identified by consulting management instruments the
nursing head of the Unit employs. The average hours of nursing care delivered to patients
remained stable, but lower than official Brazilian agencies’ indications. The correlation
between time of nursing care and the incidence of accidental extubation indicator indicated
that it decreases with increasing nursing care delivered by nurses. The results of this
investigation showed the influence of nursing care time, provided by nurses, in the outcome
of care delivery.
Descriptors: Nursing; Nursing Administration of Human Resources; Workload; Quality
Indicators in Health Care.
1 Paper extracted from Master’s Thesis “Tempo de assistência de enfermagem em UTI e indicadores de qualidade assistencial: análise correlacional” presented to Escola de Enfermagem, Universidade de São Paulo, Brazil.
2 RN, MSc, Hospital Universitário, Universidade de São Paulo, Brazil.
Tempo de assistência de enfermagem em unidade de terapia intensiva adulto e indicadores de qualidade assistencial: análise correlacional
Trata-se de studo de abordagem quantitativa, correlacional e descritivo, elaborado com
o objetivo de analisar o tempo utilizado pela equipe de Enfermagem para assistir aos
pacientes internados em unidade de terapia intensiva adulto, bem como veriicar sua correlação com os indicadores de qualidade assistencial. A identiicação do tempo médio
de assistência despendido e dos indicadores de qualidade assistencial foi efetivada por
meio de consulta aos instrumentos de gestão, utilizados pela cheia de Enfermagem da unidade. O tempo médio de assistência despendido com os pacientes manteve-se equilibrado, porém, inferior aos indicados pelos órgãos oiciais brasileiros. A correlacão
entre o tempo de assistência de Enfermagem despendido por enfermeiros e o indicador
incidência de extubação acidental indicou que a incidência de extubação acidental
diminui, à medida que aumenta o tempo de assistência de Enfermagem despendido por
enfermeiros. Os resultados desta investigação demonstram a inluência do tempo de
assistência de Enfermagem, provido por enfermeiros, no resultado do cuidado ministrado.
Descritores: Enfermagem; Administração de Recursos Humanos em Enfermagem; Carga
de Trabalho; Indicadores de Qualidade em Assistência à Saúde.
Tiempo de atención de enfermería en la unidad de cuidados intensivos de adultos y los indicadores de atención de calidad: análisis de correlación.
Un estudio de enfoque cuantitativo, de correlación y descriptiva, elaborado con objetivo
de analizar el tiempo empleado por equipo de enfermería para asistir pacientes
hospitalizados en Unidad de Cuidados Intensivos de Adultos y veriicar su correlación con indicadores de calidad de la atención. La identiicación del promedio de tiempo de
cuidados y de indicadores de calidad asistencial fue realizada por medio de consulta a las
herramientas de gestión utilizadas por el jefe de enfermería de la Unidad. El promedio de
tiempo de cuidado ministrado a los pacientes se mantuvo equilibrado, pero inferior a los
indicados por organismos oiciales en Brasil. La correlación entre tiempo de cuidados de enfermería e indicador de incidencia extubación accidental indicó que esta disminuye con aumento de tiempo de atención de enfermería utilizado por enfermeras. Los resultados de esta investigación demuestran la inluencia del tiempo de atención de enfermería por las enfermeras, en los resultados de la atención prestada.
Descriptores: Enfermería; Gestión de Recursos Humanos en la Carga de Trabajo de Enfermería; Los Indicadores de Calidad en la Atención de la Salud.
Introduction
In the global context, the challenge of improving
the safety and quality of patient care delivery in health
services is not new.
According to the campaign launched by the World
Health Organization(1), we are in the “Age of Safety” and, since 2002, the organization has addressed this theme
as a priority issue. The program was strengthened in
2004, through the creation of the Global Patient Safety
Alliance, with a view to promoting and developing patient
safety health practices and policies at global level(2). A document the International Council of Nurses
published also considers that the improvement of nursing
practice can guarantee patient safety and constitutes a
global priority goal(3).
The same document(3) highlights that organizational
reached in health institutions. Quality in the nursing
work environment, in turn, interferes in the quality and
safety of patient care and is inluenced by the size of the
nursing staff, the number of professionals according to
professional category and the nursing/patient rate.
In that context, it is veriied that issues related to
the nursing staff dimensioning process gain relevance
and are under investigation to produce technical and
scientiic evidence to enhance awareness of the meaning
of health staff that sees not only to patients and health
institutions’ needs, but also to patients and nursing
team professionals’ safety.
A systematic literature review(4) appoints that concerns with patient safety and care quality are
determining the accomplishment of research on clinical
practice and the cost-effectiveness relation of health
interventions are care, including the distribution of
human resources. This is particularly important in
intensive care, where a large part of hospitals’ inancial
resources are consumed and the nursing staff represents
the main cost item.
Another literature review(5) indicates that research done in recent decades shows an association between
the nursing staff and patient care outcomes. Most of
these studies were developed at intensive care units
and picture the direct relation between nursing staff and
increased infection rates, postoperative complications,
mortality and accidental extubation, also described as
unplanned extubation.
The author of that research(5) concluded that the analysis of nursing staff needs at intensive care units is
important, mainly for the managers of these units, to
the extent that they have the power to make decisions
and distribute resources.
Thus, the challenge for intensive care nurses is
to develop and quantify evidence to demonstrate that
a larger proportion of nurses positively inluences the
outcomes of care delivery to patients and their families,
through studies that relate staff number with quality
care indicators(6).
In this perspective, the use of quality care indicators
represents a powerful management instrument
for nurses, as it permits showing the relevance of
quantitative and qualitative staff dimensioning with
a view to the promotion of excellent care delivery to
health service users.
The use of clinical or quality indicators to assess
the care offered represents an important approach to
document attendance. In addition, when the indicators
are validated and tested with transparency and scientiic
rigor, they permit comparative analyses among health
services, with a view to planning quality improvements
in care delivery to patients/service users(7).
The analysis of Brazilian literature, however, shows
a lack of studies that demonstrate the relation between
nursing staff conformity and care indicators. In that
sense, the aim of this study is to analyze the time the
nursing team uses to see to patients/clients hospitalized
at the Adult Intensive Care Unit (AICU) of the University
of São Paulo Teaching Hospital (HU-USP), as well as to
check its correlation quality care indicators.
Method
A quantitative and descriptive correlation study
was developed at the AICU of the HU-USP.
The AICU offers 12 beds. Four of these are
structured and preferably reserved for the hospitalization
of patients who need isolation. It should be highlighted
that the Unit elaborates monthly reports, as a
management instrument, which are forwarded to the
Nursing Department (ND), informing on the number
of care hours delivered to hospitalized patients during
the period, with a view to supporting human resource
management decisions, so as to maintain quality care.
The nursing time spent is calculated with the help
of an electronic worksheet called “Worksheet to calculate
the mean nursing care time spent”(8).
Another characteristic of the Unit where the
research was accomplished is the use of care quality
indicators. The selected indicators, according to the
Institution’s Group of Quality Indicators, are: Incidence
of nasogastric tube loss for nutrition; Incidence of
central venous catheter loss; Incidence of accidental
extubation; Incidence of pressure ulcer; Incidence of
fall; Incidence of medication error.
These indicators represent care practice at the
Institution and are validated and recommended in
Brazilian(9) and international literature(10). One exception is the central venous catheter loss indicator, which was
developed according to the need evidenced at HU-USP.
In addition, these indicators are frequently used in the
Brazilian hospital network, permitting intra and
extra-institutional comparability.
Data collection procedures
Data were collected monthly from the management
instruments the Unit nursing head uses: “Worksheet
to calculate the mean nursing care time spent”, and
Rev. Latino-Am. Enfermagem 2012 July-Aug.;20(4):651-8.
Unit”, with the approval of the HU-USP Research Ethics
Committee (CEP) (registration CEP-HU/USP: 982/10 –
Registration SISNEP – CAAE: 0009.0.198.196-10).
Identiication of the mean care time spent on patients hospitalized at the AICU of the HU-USP
The “Worksheets to calculate the mean nursing
care time spent”, which are part the Unit head nurse’s
monthly reports, were consulted to identify the mean
monthly care time spent on patients hospitalized at
the Adult ICU of the HU-USP, between 01/01/2008 and
12/31/2009.
The mean nursing care time was calculated
electronically, using the worksheet developed in
Microsoft Excel®, with the help of equation (1)(11):
qk.pk.tk
n hk= (1)
Where: hk = mean nursing care time per patient, spend
by workers from professional category k;
k = professional category;
qk= mean number of nursing staff members in professional category k;
pk = mean productivity of professional category k (85%);
tk = work journey of professional category k (six hours);
n = mean daily number of patients attended.
Survey of quality care indicators at the AICU of the HU-USP
The choice of the quality indicators used in this
research was based on the criteria recommended in
literature(7) and on data accessibility at the Unit.
Among the indicators assessed at the HU-USP,
the decision was made to use those inherent in the
intensive care context: incidence of nasogastric tube
loss for nutrition; incidence of central venous catheter
loss, incidence of accidental extubation and incidence of
pressure ulcer.
Thus, the quality care indicators were collected
monthly from the “Worksheet to obtain nursing quality
indicator data, AICU Unit”, which the Unit nursing head
uses to make calculations according to the equations
indicated in the Manual of Nursing Indicators(9). One exception is the central venous loss indicator, whose
equation the institution developed by itself.
Incidence of central venous catheter loss =
No. of central venous catheter losses
No. of patients with central venous catheter/day x 100
Data treatment and analysis
The results were presented through tables with
central trend and variability measures. To correlate the
mean care time spent on AICU patients with the quality
care indicators, initially, the Kolmogorov-Smirnov test
was applied to assess the normality distribution. It
was ascertained that the central venous catheter loss
indicator showed no normal distribution. Thus, for
this variable, correlation analysis was developed using
Variables
Mean Time (2008) Mean Time (2009)
Total Nurses Nursing
Technician Total Nurses
Nursing Technician
(h) (%) (h) (%) (h) (%) (h) (%) (h) (%) (h) (%)
January 14.5 100 4.2 28.9 10.4 71.1 13.5 100 4.2 31.1 9.3 68.9 February 13.8 100 3.9 28.2 9.8 71.8 15.1 100 4.7 31.1 10.4 68.9 March 13.5 100 3.9 28.8 9.6 71.2 14.7 100 4.6 31.3 10.1 68.7 April 13.3 100 4.1 30.8 9.2 69.2 13.1 100 4.1 31.3 9.1 68.7 May 13.3 100 3.7 27.8 9.5 72.2 13.4 100 4.2 31.3 9.3 68.7
Spearman’s correlation coeficient, while Pearson’s correlation coeficient was used for the other quality
indicators.
Results
Table 1, presented next, demonstrates the mean
care time spent on patients hospitalized at the Adult ICU
of the HU-USP between 01/01/2008 and 12/31/2009.
Table 1 – Mean Nursing Care Time spend on AICU patients at HU-USP, between Jan/2008 and Dec/2009. São Paulo,
SP, Brazil, 2011
Table 1 - (continuation)
Variables
Mean Time (2008) Mean Time (2009)
Total Nurses Nursing
Technician Total Nurses
Nursing Technician
(h) (%) (h) (%) (h) (%) (h) (%) (h) (%) (h) (%)
June 14.0 100 4.4 31.4 9.6 68.6 13.3 100 4.3 32.3 9.0 67.7 July 13.3 100 4.1 30.8 9.2 69.2 13.9 100 4.5 32.4 9.4 67.6 August 14.5 100 4.6 31.7 9.9 68.3 15.4 100 4.8 31.1 10.6 68.9 September 13.8 100 4.4 31.8 9.3 68.2 14.0 100 4.3 30.7 9.7 69.3 October 13.6 100 4.6 33.8 9.0 66.2 14.0 100 4.3 30.7 9.7 69.3 November 14.6 100 4.9 33.5 9.6 66.5 14.7 100 4.7 32.0 10.0 68.0 December 14.1 100 4.4 31.2 9.7 68.8 13.7 100 4.6 33.5 9.2 66.5 Mean 13.9 100 4.3 30.9 9.6 69.1 14.1 100 4.4 31.2 9.6 68.9
sd 0.48 0.35 0.36 0.73 0.24 0.53
VAR. C.(%) 3.49 8.13 3.79 5.22 5.44 5.50
Slight variations were observed in the time spent
during the study period (minimum 13.3 hours and
maximum 14.6 hours in 2008 and minimum 13.1 hours
and maximum 15.4 hours in 2009). The mean number of
nursing care hours spent on the patients during the two
years studied is practically equivalent (13.9 h/patient/
day in 2008 and 14.1 h/patient/day in 2009), with a
difference of only 0.2 hours, i.e. 12 minutes.
As for the distribution of nursing care time between
professional categories, the mean care hours both
nurses and nursing technicians spent remained the
same in 2008 and 2009 (4.3 and 4.4 hours, respectively,
for nurses and 9.6 for technicians). On average, the
proportion of nurses’ care time corresponded to 31%
and that of nursing technicians to 69%.
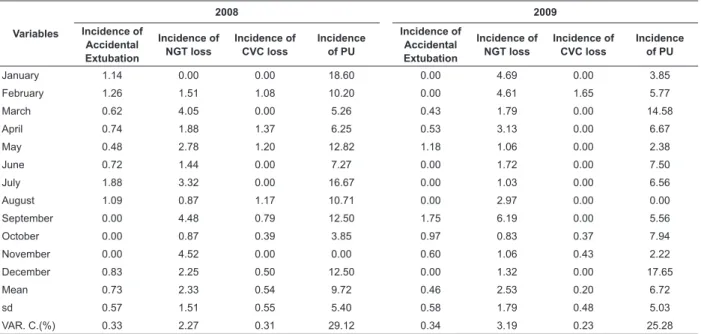
Table 2 – Mean scores of Nursing quality care indicators at AICU of HU-USP between Jan/2008 and Dec/2009. São
Paulo, SP, Brazil, 2011
Variables
2008 2009
Incidence of
Accidental Extubation
Incidence of
NGT loss
Incidence of
CVC loss
Incidence
of PU
Incidence of
Accidental Extubation
Incidence of
NGT loss
Incidence of
CVC loss
Incidence
of PU
January 1.14 0.00 0.00 18.60 0.00 4.69 0.00 3.85
February 1.26 1.51 1.08 10.20 0.00 4.61 1.65 5.77
March 0.62 4.05 0.00 5.26 0.43 1.79 0.00 14.58
April 0.74 1.88 1.37 6.25 0.53 3.13 0.00 6.67
May 0.48 2.78 1.20 12.82 1.18 1.06 0.00 2.38
June 0.72 1.44 0.00 7.27 0.00 1.72 0.00 7.50
July 1.88 3.32 0.00 16.67 0.00 1.03 0.00 6.56
August 1.09 0.87 1.17 10.71 0.00 2.97 0.00 0.00
September 0.00 4.48 0.79 12.50 1.75 6.19 0.00 5.56
October 0.00 0.87 0.39 3.85 0.97 0.83 0.37 7.94
November 0.00 4.52 0.00 0.00 0.60 1.06 0.43 2.22
December 0.83 2.25 0.50 12.50 0.00 1.32 0.00 17.65
Mean 0.73 2.33 0.54 9.72 0.46 2.53 0.20 6.72
sd 0.57 1.51 0.55 5.40 0.58 1.79 0.48 5.03
VAR. C.(%) 0.33 2.27 0.31 29.12 0.34 3.19 0.23 25.28
Table 2 shows the performance of nursing quality
care indicators used at the AICU of the HU-USP during
the study period. The CVC loss incidence indicator
showed the smallest variation coeficient (0.31% in 2008
and 0.23% in 2009), while the PU incidence indicator
showed the highest coeficient (29.12% in 2008 and
25.28% in 2009).
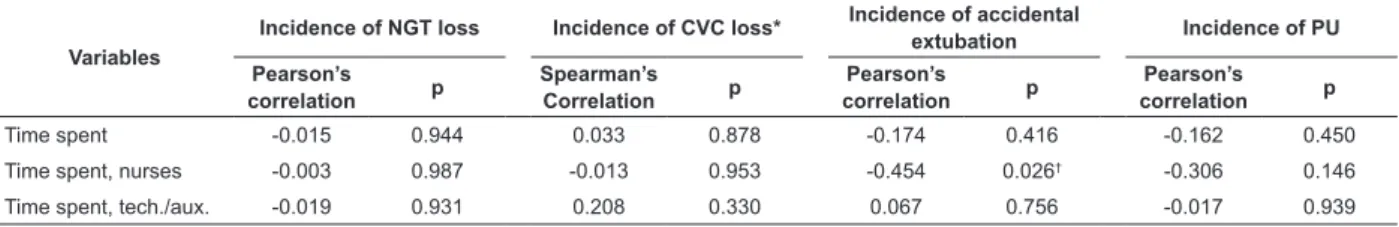
Data in Table 3 demonstrate that the nursing care
time nurses spent and the quality indicator incidence of
accidental extubation showed a Pearson’s correlation
coeficient of (r =- 0.454), with p=0.026. For the other
variables, no statistically signiicant correlations were
Rev. Latino-Am. Enfermagem 2012 July-Aug.;20(4):651-8.
Table 3 - Correlation between mean care time spent, according to professional category, and quality care indicators
at the Adult ICU of HU-USP, between January 1st 2008 and December 31st 2009. HU-USP, São Paulo, Brazil, 2011
Variables
Incidence of NGT loss Incidence of CVC loss* Incidence of accidental extubation Incidence of PU Pearson’s
correlation p
Spearman’s
Correlation p
Pearson’s
correlation p
Pearson’s
correlation p
Time spent -0.015 0.944 0.033 0.878 -0.174 0.416 -0.162 0.450 Time spent, nurses -0.003 0.987 -0.013 0.953 -0.454 0.026† -0.306 0.146
Time spent, tech./aux. -0.019 0.931 0.208 0.330 0.067 0.756 -0.017 0.939
* The CVC loss incidence variable shows no normal distribution, so that Spearman’s non-parametric correlation was used. † Signiicance level for p < 0.05.
Discussion
The mean care time spent on patients hospitalized
at the AICU of the HU-USP between 01/01/2008 and
12/31/2009 corresponded to approximately 14 hours.
Based on the comparison between the present research
results and those of a study(12) that identiied the mean nursing care hours at the AICU of the HU-USP between
2001 and 2005, it was ascertained that less nursing
care hours were spent on AICU patients in 2008 and
2009 than in the years the author analyzed (mean 15.4
hours), although the percentage distribution the same
researcher found did correspond (30% for nurses and
70% for nursing technicians)(12).
Concerning the times established by the Federal
Nursing Council(13) (COFEN) (17.9 h) and the National Health Surveillance Agency(14) (ANVISA) (15 h), the mean nursing care hours spent on patients hospitalized
at the AICU of HU-USP, except in February and August
2009, remained below these entities’ indications.
This result suggests the possibility that the
nursing team is overburdened and evidences the need
to revise the Unit’s existing staff. Nevertheless, the
workload patients demand should also be assessed
through the application of speciic instruments(15-16), as
the care time patients demand can differ from oficial
entities’ indications and their use in putting in practice
dimensioning methods could cause an over or
under-dimensioning of nursing staff.
As for the percentage distribution of care time
between the professional categories who are part of
the nursing team, it is observed that the proportion of
time AICU nurses spent remains below the minimum
percentage recommended in COFEN Resolution(13) 293/2004 (52%).
An exploratory and descriptive study(17) developed in fourteen hospitalization units of seven hospitals
in São Paulo City, aimed at assessing the parameters
recommended in COFEN Resolution(13) 293/04, as
an oficial reference for nursing staff dimensioning
at hospital institutions, found that, at the six ICUs
studies, the proportion of hours attributed to the
nurses was smaller than that attributed to nursing
technicians and auxiliaries, remaining far below COFEN
recommendations(13).
The percentage of nursing care time AICU nurses
spent, however, is higher than that identiied in RDC(14) No. 7, proposed by the Joint Board of ANVISA(14) (20%). In that sense, studies available in international
literature demonstrate an inverse relation between the
number of nurses and the occurrence of adverse events
in patients, correlating the number of care hours these
professionals spend with the quality of care delivery,
concluding that a larger number of care hours delivered
by nurses is associated with a drop in mortality and
adverse event rates (urinary tract infection, pressure
ulcer, hospital pneumonia, wound infections, central
venous access complications, shock, thrombosis,
medication errors, postoperative complications), as well
as with a decrease in mortality rates deriving from these
events(18-20).
This scenario evidences that improving the
percentage distribution of care hours attributed to
nurses represents not only a perspective for the AICU at
HU-USP, but also a challenge for Brazilian nursing.
The analysis of AICU indicators suggests improved
care quality at the Unit in 2009, when compared with
2008, as the mean incidence levels of accidental
extubation, CVC loss and PU dropped. Due to the absence
of Brazilian research and the lack of international studies,
however, which used the same indicators and method
as adopted in the present research, AICU/HU-USP data
could not be confronted with those of other services.
Concerning the analysis of the correlation between
nursing care time spent by nurses and the incidence of
accidental extubation quality indicator, it can be inferred
that the incidence of accidental extubation decreases
studies were found with similar methods to the present
study. Some studies describe the inluence of the nursing
staff variable on the incidence of unplanned extubation
and support the results found.
A study(21) that assessed the association between the nursing workload and the probability of unplanned
extubations at a Pediatric Intensive Care Unit appointed
that the logistic regression model revealed positive
associations between unplanned extubations and the
patient/nurse ratio. In the same study, it was concluded
that the number of unplanned extubations may increase
in situations when the patient/nurse ratio is higher.
A research(22) aimed at exploring the effects of nursing care on the occurrence and consequences of
unplanned tracheal extubation at adult Intensive Care
Units reported that self-extubations were more frequent
at night and under routine care of nurses with less
professional experience. Those authors concluded that
an adequate patient/nurse ratio can generate better
work and safety conditions during nursing procedures.
A study developed to identify high-risk patients
for unplanned extubation and determine professionals’
beliefs on perceived unplanned extubation risks revealed
that 60% of the interviewed professionals believe that
the nursing staff or the patient/nurse ratio are closely
related with accidental extubation cases(23).
A recent publication(24) aimed at assessing risk factors and outcomes after unplanned extubation at ICU
indicated that non-accidental extubation is a frequent
event during mechanical ventilation in critically ill
patients and can be associated with increased morbidity
and mortality. In the same study, the incidence of
extubation was considered relatively low (2.1% for
patients under mechanical ventilation and 0.4% per
ventilation day), due to the high nurse/patient ratio in
the units where the ield research was accomplished.
Thus, the present research results demonstrate the
inluence of nursing care time, provided by nurses, on
the outcomes of care delivered to patients attended at
AICU.
Conclusion
As a result of this study, the mean nursing care time
spent on patients hospitalized at the AICU of the HU-USP
could be identiied and analyzed, between 01/01/2008
and 12/31/2009, and its correlation with quality care
indicators used at the Unit could be ascertained.
The nursing care hours spent on AICU patients at
the HU-USP between January 1st 2008 and December
31st 2009 remained below COFEN and ANVISA recommendations.
The nursing care time spent by nurses and the
incidence of accidental extubation quality indicator
showed a negative Pearson’s correlation coeficient,
indicating that the incidence of accidental extubation
drops as the number of nursing care hours spent
by nurses increases. Concerning the other quality
indicators assessed in this study, i.e. the incidence of
nasogastric tube loss for feeding, incidence of central
venous catheter loss and incidence of pressure ulcer, no
statistically signiicant correlations were found.
The limitations of the present research, i.e. the
fact that it was accomplished at a single unit of a single
institution, put constraints on its generalization. It does
offer support and equips nurses though, through the
presentation of a systematic method and the indicator
time series, with a view to reproducing the study in
different contexts, contributing to the validation of this
inding and to comparability among health services, as
no studies have been published that correlate these
variables in the Brazilian context.
The accomplishment of this study also contributes
to understand the importance and impact of the nursing
staff on care outcomes and patient safety, supporting
nurses’ administrative and political decisions, as well as
staff negotiations with hospital managers, with a view to
the excellence of care offered to these services’ users.
References
1. World Health Organization (WHO). World Alliance for
Patient Safety. Forward program 2006- 2007. [acesso 13
jan 2011]. Disponível em: www.who.int/patientesafety
2. Pedreira MLG, MJCS Harada. Enfermagem dia a dia:
segurança do paciente. São Caetano do Sul: Yendis
Editora; 2009.
3. Braumann A. Positive practice environments:
quality workforce, quality patient care. Geneva (SZ):
International Council of Nurses; 2007. 65 p.
4. West E, Mays N , Rafferty AM , Rowan K , Sanderson
C. Nursing resources and patient outcomes in intensive
care: A systematic review of the literature. Int J Nurs
Stud. 2009;46:993-1011.
5. Penoyer DA. Nurse staffing and patient outcomes
in critical care: A concise review. Crit Care Med.
2010;38(7):1521-8.
6. Bray K, Wren I, Baldwin A, Ledger US, Gibson V,
Goodman S, Walsh D. Standards for nurse staffing in
Rev. Latino-Am. Enfermagem 2012 July-Aug.;20(4):651-8.
Received: May 5th 2011 Accepted: Apr. 3th 2012 Critical Care Nurses, The Critical Care Networks National
Nurse Leads. Nurs Crit Care.2010;15(3):109-11.
7. Mainz J. Developing evidence-based clinical indicators:
a state of the art methods primer. Int J Qual in Heal
Care. 2003;15 Suppl 1:i5-i11.
8. Gaidzinski RR, Fugulin FMT, Castilho V. O uso
de ferramentas tecnológicas no processo de
dimensionamento de pessoal. In: Prado C, Peres HHC,
Leite MMJ. Tecnologia da informação e comunicação na
enfermagem. São Paulo: Atheneu; 2011. p. 35-43.
9. CQH. Programa de Qualidade Hospitalar: manual de
indicadores de enfermagem NAGEH. São Paulo: APM/
CREMESP; 2006.
10. American Nurses Association. National Database
of Nursing Quality Indicators (NDQI 2003-2011)
.[acesso 13 jan 2012]. Disponível em: https://www.
nursingquality.org/
11. Gaidzinski RR, Fugulin FMT. Dimensionamento
de pessoal de enfermagem em unidade de terapia
intensiva. In: Associação Brasileira de Enfermagem.
Programa de atualização em Enfermagem: Saúde do
adulto (PROENF) – Ciclo 3 – Módulo 3. Porto Alegre:
Artmed/Panamericana; 2008. p. 65-96.
12. Rogenski KE, Fugulin FMT, Gaidzinski RR, Rogenski
NMB. Tempo de assistência de enfermagem em
instituição hospitalar de ensino. Rev Esc Enferm USP.
2011;45(1):223-9.
13. Conselho Federal de Enfermagem (BR). Resolução
n. 293, de 21 de setembro de 2004. Fixa e Estabelece
parâmetros para Dimensionamento do Quadro de
Profissionais de enfermagem nas Unidades Assistenciais
das Instituições de Saúde e Assemelhados [Internet].
[acesso 13 jan 2012]; Rio de Janeiro; 2004. Disponível
em: http://corensp.org.br/072005/
14. Agência Nacional de Vigilância Sanitária (BR).
RDC nº 7 de 24 de fevereiro de 2010. [acesso 13 jan
2012]; Disponível em: http://www.brasilsus.com.br/
legislacoes/rdc/102985-7.html
15. Miranda DR, Rijk AD, Schaufeli W, Iapichino G. Nursing
activities score. Crit Care Med. 2003;31(2):374-82.
16. Panunto MR, Guirardello EB. Nursing workload at
a gastroenterology unit. Rev. Latino-Am. Enfermagem.
2009;17(6):1009-14.
17. Fugulin FMT. Parâmetros oficiais para o
dimensionamento de profissionais de enfermagem em
instituições hospitalares: análise da resolução COFEN nº
293/04. [tese Livre-docência]. São Paulo : Escola de
Enfermagem da Universidade de São Paulo; 2010.
18. Aiken LH, Clarke SP, Cheung RB, Sloane DM, Silber
JH. Educational Levels of Hospital Nurses and Surgical
Patient Mortality. JAMA. 2003;290(12):1617-23.
19. Needleman J, Buerhaus P, Matte S, Stewart M,
Zelevinsky K. Nurse-staffing levels and the quality of
care in hospitals. N Engl J Med. 2002;346(22):1715-22.
20. Needleman J, Buerhaus P, Pankratz SV, Leibson
CL, Stevens SR, Harris M. Nurse Staffing and Inpatient
Hospital Mortality. N Engl J Med. 2011;364(11):1037-45.
21. Silva PSL, Carvalho BW. Unplanned extubation in
pediatric critically ill patients:
A systematic review and best practice recommendations.
Pediatr Crit Care Med. 2010;11(2):287-94.
22. Yeh SH, Lee LN, Ho TH, Chiang MC, Lin LW.
Implications of nursing care in the occurrence and
consequences of unplanned extubation in adult intensive
care units. Int J Nurs Stud. 2004;41:255-62.
23. Tanios MA, Epstein SK, Livelo J, Teres D. Can We
Identify Patients at High Risk for Unplanned Extubation?
A Large-Scale Multidisciplinary Survey. Respir Care.
2010;55(5):561-8.
24. Groot RI, Dekkers OM, Herold IHF, Jonge E,
Arbous MS. Risk factors and outcomes after unplanned
extubations on the ICU: a case-control study. Crit Care.