(1) Associação de Pais Amigos dos Excepcionais de São Paulo, APAE, Bauru, São Paulo, Brasil.
(2) Departamento de Fonoaudiologia da Faculdade de Odontologia de Bauru, Universidade de São Paulo - USP, Bauru, São Paulo, Brasil.
Source of fomentation: National Council of Science and Technology (CNPq), scientiic initiation scholarship program
Conlict of interest: non-existent
Predicting signs of depression in children
with specific learning disorders
Sinais preditores de depressão em escolares com transtorno
de aprendizagem
Isabelle Ortigosa Rodrigues(1)
Thaís Freire(1)
Thaís dos Santos Gonçalves(1)
Patrícia de Abreu Pinheiro Crenitte(2)
Received on: December 17, 2015 Accepted on: April 23, 2016
Mailing address:
Patrícia de Abreu Pinheiro Crenitte Departamento de Fonoaudiologia da FOB – USP
Alameda Dr. Octávio Pinheiro Brisolla,
ABSTRACT
Purpose: to compare signs of depression among children with and without learning disorders, and also to investigate whether there are gender-based differences in depressive signs between these groups. Methods: 20 children with learning disorder and 20 children with typical school performance, aged between 9 and 12 years old, were studied. The investigation of the depression signs was performed by applying the Child Depression Inventory.
Results: children diagnosed with learning disorder have a higher frequency of depressive symptoms compared to children without learning dificulties.
Conclusion: the signs of depression varied according to age. Gender comparison revealed that girls had a higher incidence of depressive symptoms, especially in the group of children with the disorder.
Keywords: Learning Disorders; Depression; Learning
RESUMO
Objetivo: comparar os sinais de depressão entre crianças com e sem transtornos de aprendizagem, e ainda, investigar se há diferenças nos sinais depressivos em relação ao gênero entre os grupos. Métodos: participaram do estudo 20 crianças com transtorno de aprendizagem e 20 crianças com desempenho escolar típico, entre 9 e 12 anos de idade. A investigação dos sinais de depressão foi reali-zada por meio da aplicação do Inventário de Depressão Infantil.
Resultados: veriicou-se que as crianças diagnosticadas com transtorno de aprendizagem apresentam maior frequência de sintomas depressivos em relação às crianças sem diiculdades escolares.
gêne-Rev. CEFAC. 2016 Jul-Ago; 18(4):864-875 Depression in learning disorders | 865
INTRODUCTION
For the Diagnostic and Statistical Manual of Mental Disorders - 5th Edition (DSM-5)1, the term Speciic
Learning Disorder is deined as dificulties in learning
and use of academic skills, characterized by reading
words of inaccurate or slow manner and effort, dificulty understanding the meaning of what is read, dificulties in spelling, dificulties with written expression (e.g.
commits multiple errors in grammar or punctuation in the sentence, inadequate organization of paragraphs
and written expression of ideas without clarity), difi -culties to master the number sense, numerical facts
or calculation and dificulties in reasoning. For the
diagnosis, the presence of at least one of the cited symptoms is indicated which had persisted for at least 6 months, despite interventions targeting these problems.
These learning dificulties cannot be explained by intel -lectual disabilities, visual or hearing uncorrected acuity, other mental or neurological disorders, psychosocial
adversity, lack of proiciency in academic language of
instruction or inadequate educational instruction1. In
this study, the term disorder learning will be adopted
to refer to individuals with speciic learning disorder
according to DSM-51 criteria.
The inability to read and understand is one of the biggest obstacles to learning, with serious educational, social and emotional consequences, being associated
with varied levels of anxiety and depression2,3.
Considering the relationship between depression and cognitive functions, a shortage of studies carried out with individuals with learning disabilities was observed, as there are few records of Brazilian studies on the prevalence of depressive symptoms in children who have these disorders. International studies are not recent and there are currently few studies addressing this topic. The studies were initiated between the decades of 1970-1980, indicating that students with learning disabilities have higher rates of depression than other groups4.
About 5% of children and adolescents in the general population suffer from depression at some
point. Children under stress, who have had bad experi
-ences or have attention, learning, conduct or anxiety
disorders, have great risk for depression5, but the
diagnosis of childhood depression is still dificult to
perform due to its functional variables and similarities presenting with other childhood psychopathology6.
According to DSM-57, depression is diagnosed in the
presence of ive (or more) of the following symptoms:
depressed mood in most parts of day, nearly every
day (children and adolescents can be irritable mood); markedly diminished interest or pleasure in all or almost all activities in most parts of the day, nearly
every day; loss or signiicant weight gain; insomnia or
hypersomnia nearly every day; psychomotor agitation or retardation nearly every day; fatigue or energy loss
nearly every day; feelings of worthlessness or excessive
or inappropriate guilt (which may be delusional) nearly every day; diminished ability to think or concentrate, or indecisiveness, nearly every day; recurrent thoughts of death (not just fear of dying). Furthermore, at least one of the symptoms must be depressed mood or loss of interest or pleasure. The symptoms cause clinically
signiicant distress or impairment in social, occupa -tional or other important areas of the individual’s life7.
The diagnosis of depression in childhood is quite
complex, because most of the time, the child does
not have the resources to recognize their emotions and thoughts. Thus, the most appropriate way for the
identiication of children with depressive symptoms is
the watchful eye of parents and teachers as they have
signiicant relationships in the child’s life and possibly
follow their daily activities8, being of great
impor-tance these observations, since the depression has a negative impact on social, academic and family of this group9.
The association between childhood depression and school performance has been evaluated by some authors10-13. These studies point to a higher incidence
of depression among children with learning problems. Although the relationship between school perfor-mance and depression have been addressed by the cited studies, the research does not describe a causal relationship between the two variables, not making clear whether depression causes a drop in child’s
school performance, or otherwise, if a school dificulties
would lead to depressive feelings14. Still, depression
can affect school performance to the extent that it impairs the child’s self-eficacy, i.e. when in depressive
process, the child can not believe his own performance, tending to present even lower academic achievement,
exacerbating thus the depression15, and the greater the
number of symptoms of depression, the lower the use of learning strategies16.
and on neuropsychological function. Given the above, the objective of this study is to compare the signs of depression among children with and without learning disorders, and also investigate whether there are differ-ences in depressive signs in relation to gender between the groups.
METHODS
This study was approved by the Research Ethics Committee of Bauru Dental School, University of São Paulo (FOB-USP), protocol number 012713/2013.
Participants
20 children diagnosed with learning disorder by an interdisciplinary team at the Clinic of Speech Pathology, Bauru Dental School, University of São Paulo (FOB-USP), were recruited and formed the group I (GI), and another 20 children without any learning problem constituted the group II (GII). Therefore, the total sample consisted of 40 children. All selected participants were 9 to 12 years old, of both genders and were regularly enrolled in primary education at public institutions.
The guardians of children diagnosed with learning disorder by FOB-USP were contacted and invited to participate in the study and were informed about the objectives and procedures of the research. After accep-tance to participate in the study, parents and guardians
signed the Terms of Free and Clariied Consent (TFCC).
Children of GII formed the control group and were paired with GI about age and education. For the recruitment of GII participants, we initially held contact
with the coordination of primary schools in two cities in the countryside of São Paulo to present the project and
explanation of the study objectives and procedures.
Four schools agreed and signed a term authorizing the research in the school environment (two schools in each city). Then teachers were asked to indicate children
without complaints/history of learning dificulties. From this statement of teachers, guardians were notiied and
invited to participate in the study by signing the Terms
of Free and Clariied Consent by parents or guardians.
Then these participants underwent a speech-language
pathology screening to conirm the absence of learning
problems.
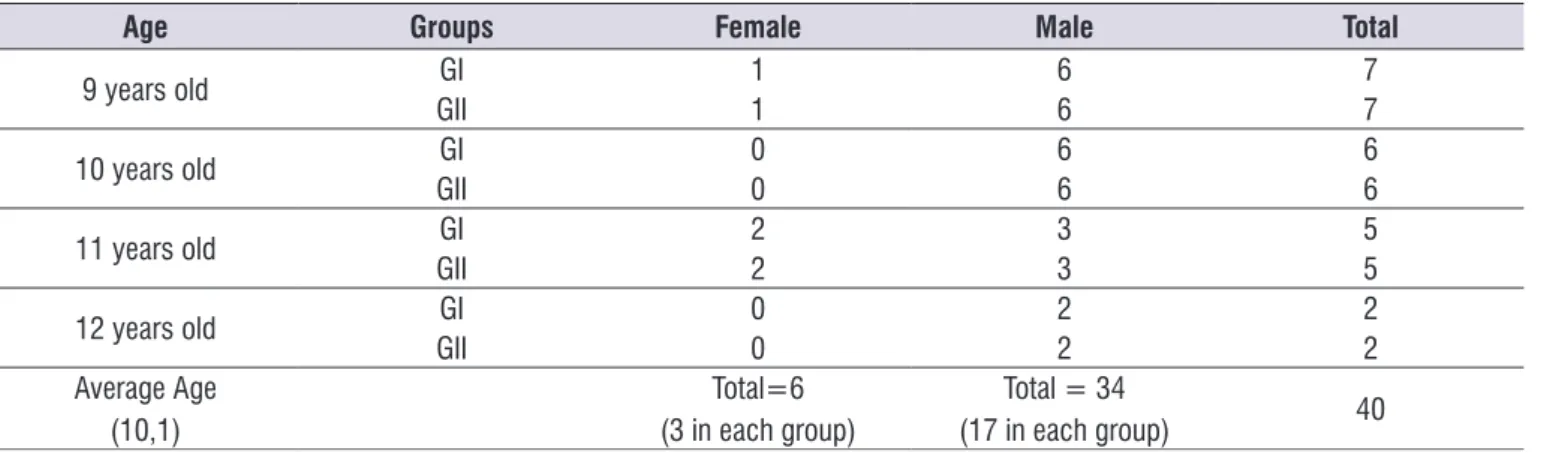
Table 1 shows the characterization of participants in groups according to age and gender. The prevalence of male subjects (n = 34) is noted when compared to females (n = 6) and predominance of children aged 9 years.
Inclusion and exclusion criteria
For the GI the following inclusion criteria were adopted: (a) parental authorization by signing the TFCC, according to the National Council of Health 196/969; (b) interdisciplinary diagnosis of learning disorder by an interdisciplinary team of FOB-USP; (c) absence of hearing disorders proven by audiological evaluation; (d) absence of complaint for visual acuity;
(e) absence of intellectual deicit, veriied by neuropsy -chological evaluation; (f) not make use of psychotropic
medication or exhibiting other neurological symptoms
already diagnosed or according to complaints by the parents.
Table 1. Distribution of students by age, gender and group
Age Groups Female Male Total
9 years old GI 1 6 7
GII 1 6 7
10 years old GI 0 6 6
GII 0 6 6
11 years old GI 2 3 5
GII 2 3 5
12 years old GI 0 2 2
GII 0 2 2
Average Age (10,1)
Total=6 (3 in each group)
Total = 34
Rev. CEFAC. 2016 Jul-Ago; 18(4):864-875 Depression in learning disorders | 867
cognitive and behavioral) in children and adolescents 7-17 years of age. It was adapted for the Brazilian population by Gouveia et al.18. For the present study,
we used the version with 20 items indicated in other studies15,18.
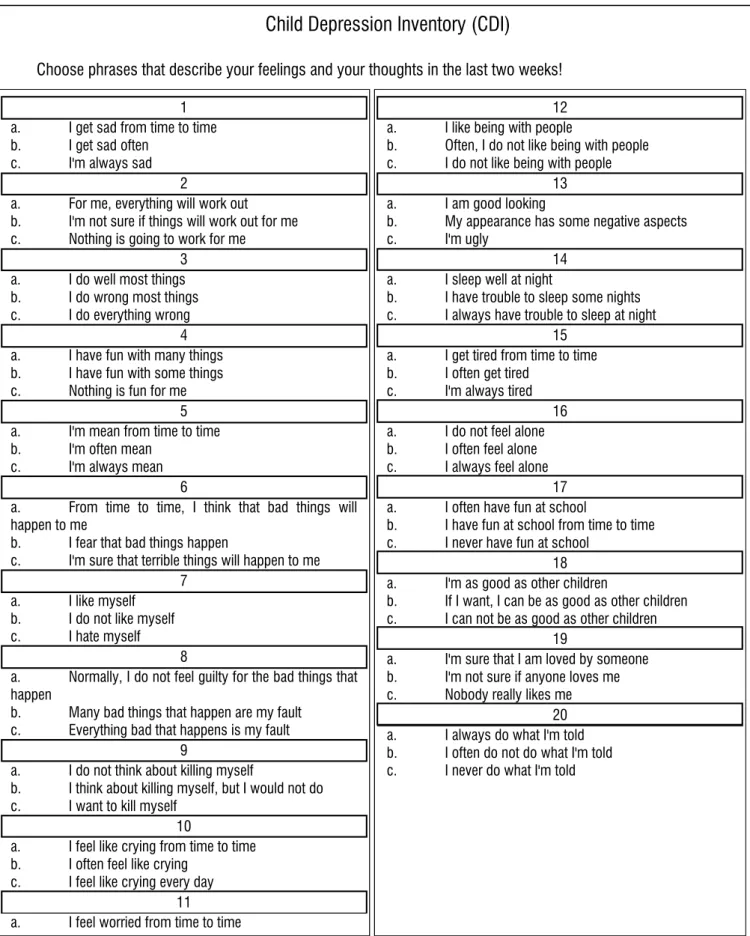
In its application, the child should indicate one of three alternatives from the answers to each item (shown in Figure 1), whose scores are: 0 points for the alter-native (a) (no symptom), 1 point for the alteralter-native (b) (symptom present) or 2 points to alternative (c) (serious symptom). The total score was obtained by summing the scores for each item, ranging from 0 to 40. In the adaptation and standardization study of CDI in Brazil, Gouveia et al.18 adopted the cut at seventeen points for
signiicant of depressive symptoms, also established in
this study.
Whereas children of GI group have dificulties
in reading, the application of the instrument was monitored, that is, each sentence was read to the child and he was told to indicate which of the best alterna-tives described their feelings, thoughts and behaviors in the last 2 weeks.
The application of the above instruments in GI was held in individual sessions, at care rooms from Clinic of Speech Pathology and Audiology of University of São
Paulo, and following speciic instructions from them.
We used a session of 30-40 minutes long for the appli-cation, individually, without the presence of parents in the application area.
In children from GII, the instrument was applied individually, without parents, at school, in an appro-priate room assigned by the principals, and was also used for a session of 30-40 minutes.
The CDI analysis was accompanied by a psychol-ogist at the Clinic of Speech Pathology and Audiology.
GI children with other diagnoses were excluded:
genetic syndromes, neurological or
neuropsychi-atric conditions, such as attention deicit disorder or attention deicit hyperactivity disorder (ADD/ ADHD); mixed disorder of scholastic skills, school dificulties of
pedagogical origin.
For the GII it was adopted the following inclusion criteria: (a) parental authorization by signing the TFCC; (b) absence of complaints regarding eyesight, hearing and intellectual; (c) statement by the teachers not to
present complaints of learning dificulties with school performance as expected; (d) not to make use of
psychotropic medication; (e) absence of any neuro-logical disorder and developmental delay, as reported by parents.
Excludes from GII children who have dificulty
in reading and writing according to the results of the speech-pathology screening.
Materials and Procedures
In order to achieve the proposed goals, it was applied the instruments described below:
• SPT - School Performance Test17
This instrument was used to perform the screening of learning problems in GII. The test measures skills in three academic areas: reading, writing and arithmetic in children from 7 to 12 years old. The procedure was performed in 30-40 minutes, individually, in an appro-priate room in the participants’ school, assigned by the principal. All the children selected for the GII obtained scores within the average or higher in each of the three areas, according to age and education.
• Children’s Depression Inventory - CDI18
This is a self-rating scale developed by Kovacs19
Child Depression Inventory (CDI)
Choose phrases that describe your feelings and your thoughts in the last two weeks!
1 a. I get sad from time to time b. I get sad often
c. I'm always sad 2
a. For me, everything will work out b. I'm not sure if things will work out for me c. Nothing is going to work for me
3 a. I do well most things b. I do wrong most things c. I do everything wrong
4 a. I have fun with many things b. I have fun with some things c. Nothing is fun for me
5 a. I'm mean from time to time b. I'm often mean
c. I'm always mean 6
a. From time to time, I think that bad things will happen to me
b. I fear that bad things happen
c. I'm sure that terrible things will happen to me 7
a. I like myself b. I do not like myself c. I hate myself
8
a. Normally, I do not feel guilty for the bad things that happen
b. Many bad things that happen are my fault c. Everything bad that happens is my fault
9
a. I do not think about killing myself
b. I think about killing myself, but I would not do c. I want to kill myself
10
a. I feel like crying from time to time b. I often feel like crying
c. I feel like crying every day 11
a. I feel worried from time to time
12 a. I like being with people
b. Often, I do not like being with people c. I do not like being with people
13 a. I am good looking
b. My appearance has some negative aspects c. I'm ugly
14 a. I sleep well at night
b. I have trouble to sleep some nights c. I always have trouble to sleep at night
15 a. I get tired from time to time b. I often get tired
c. I'm always tired 16 a. I do not feel alone b. I often feel alone c. I always feel alone
17 a. I often have fun at school
b. I have fun at school from time to time c. I never have fun at school
18 a. I'm as good as other children
b. If I want, I can be as good as other children c. I can not be as good as other children
19
a. I'm sure that I am loved by someone b. I'm not sure if anyone loves me c. Nobody really likes me
20 a. I always do what I'm told b. I often do not do what I'm told c. I never do what I'm told
Rev. CEFAC. 2016 Jul-Ago; 18(4):864-875 Depression in learning disorders | 869
Data analysis
Data were tabled and statistically analyzed (descriptive and inferential analysis). The SPT and CDI test were scored according to the criteria of the authors of each instrument. The Kolmogorov-Smirnov test was initially used to verify the normality of the variables and choice of statistical tests. The “t” Student test and Anova-Levene’s test were used for comparison of data between the groups. Analyses was performed in the
Statistica Software, version 10.0, adopting a signii -cance level of 5%.
RESULTS
Table 2 shows the mean values representing the obtained score by the participants to answer each of the 20 questions. The comparison between the groups shows that the GI had higher scores on all issues and
reveals a statistically signiicant difference in items
number 1 (sadness frequency), 2 (if everything will be solved well), 6 (if you think bad things will happen ), 11 (how often is concerned), 14 (quality of sleep), 15 (tiredness frequency) and 16 (feeling of loneliness). Also
statistically signiicant differences were found between
the groups in the total score of the questionnaire. Table 3 shows the comparison between the mean values of points of GI and GII, in each age group. To
the age of 9 years there was a statistically signiicant
result in Items 14 and 15 (highest score in GI), which refer to the aspects of sleep quality and fatigue, as well as the total score of the inventory. For the age of 10,
there was a statistically signiicant result in question
18 referred to the aspect of self-perception as “good” (with the highest average in the GII, the only issue in
which a statistically signiicant difference showed lower
average in GI). At the age of 11 years, there is a
statisti-cally signiicant result in question number 6 concerning
the terms of negative feelings (fear that something bad might happen), with the highest average in GI. Despite the difference in the total score between the groups at the ages of 11 and 12 years (with the highest average in
the GI), and statistically signiicant differences between
children 12 years were recorded, there were no
statis-tically signiicant differences in any matter. These indings may be justiied because of the small number
of individuals in the sample with 11 years (n = 5) and 12 years (n = 2).
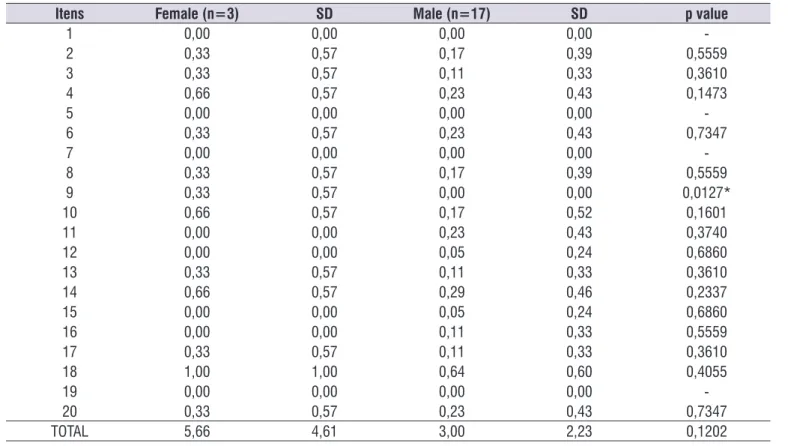
Tables 4, 5 and 6 make the comparison between
genders. There is a statistically signiicant difference
in GI in the number 7 questions (if you like yourself),
9 (one thinks of killing themselves), 15 (how often gets tired), 18 (if you think you are “good”) and 19 (feel loved), with higher average for females, with the
exception of item 15 (Table 4).
The comparison between genders, GII (Table 5)
revealed a statistically signiicant difference only in
the question number 9, related to the desire of death, showing higher scores achieved by girls compared to boys.
The comparison between groups (Table 6) shows that GI girls got double the score obtained by GII girls.
However, statistically signiicant differences were not recorded. This inding may be explained by the small
sample (n = 6). The comparison with the male gender,
on the other hand, revealed a statistically signiicant
difference. The GI score was also higher than the GII, surpassing double points of GII.
DISCUSSION
There is a lack of national studies investigating the relationship between the incidences of depressive symptoms in children with learning disorders compared with children with good academic performance. In the international literature, although they are found in greater numbers, the studies are not current.
Regarding the distribution of participants, it is apparent that the number of male subjects was higher than female. This fact shows higher prevalence of diagnosed boys with a learning disorder, as described in the literature20.
The total score obtained by children with a learning disorder was higher than that presented by the children without learning disabilities, with a statistically signif-icant difference. The highest score in the CDI question-naire indicates higher frequency of complaints related to depression symptoms. Therefore, the results of our sudy demonstrate that children with poor school perfor-mance have a larger number of predictive depression signals, consistent with other studies in the literature21-25.
A study26 that evaluated the prevalence of depressive
symptoms using CDI instrument in 53 children with learning disorders, with ages ranging from 8 to 11
years, revealed that 19 children (35.85%) exceeded
the cutoff score for the presence of these symptoms. This data indicates that children may have depressive
disorders. In this study, another inding was that none
of the participant children in the GI presented total
score above the threshold considered for signiicant
Table 2. Comparison between GI and GII as their scores in the inventory of childhood depression in each question
Itens GI GII p value
1 Average
SD
0,35 0,00
0,0112*
0,58 0,00
2 Average
SD
0,60 0,20
0,0183*
0,59 0,41
3 Average
SD
0,50 0,15
0,0518
0,68 0,36
4 Average
SD
0,45 0,30
0,3891
0,60 0,47
5 Average
SD
0,15 0,00
0,0749
0,36 0,00
6 Average
SD
0,70 0,25
0,0083*
0,57 0,44
7 Average
SD
0,05 0,00
0,3236
0,22 0,00
8 Average
SD
0,10 0,20
0,3888
0,30 0,41
9 Average
SD
0,20 0,05
0,1593
0,41 0,22
10 Average
SD
0,30 0,25
0,7795
0,57 0,55
11 Average
SD
0,60 0,20
0,0302*
0,68 0,41
12 Average
SD
0,20 0,05
0,1593
0,41 0,2
13 Average
SD
0,25 0,15
0,4421
0,44 0,36
14 Average
SD
0,95 0,35
0,0029*
0,68 0,48
15 Average
SD
0,85 0,05
0,0004*
0,74 0,23
16 Average
SD
0,45 0,10
0,0266*
0,60 0,30
17 Average
SD
0,35 0,15
0,2040
0,58 0,36
18 Average
SD
0,80 0,70
0,6758
0,83 0,65
19 Average
SD
0,05 0,00
0,3236
0,22 0,00
20 Average
SD
0,35 0,25
0,5472
0,58 0,44
TOTAL Average SD
8,25 3,40
0,0002*
4,59 2,72
Student’s t test - *p<0,05 – statistically signiicant / SD= Standard Deviation
Re
v. C
E
F
A
C
. 2
0
1
6
J
u
l-A
g
o;
1
8
(4
):
8
6
4
-8
7
5
De
p
re
ss
ion
in
le
arn
in
g
d
is
ord
e
rs
|
871
Table 3. Comparison between GI and GII groups’ average considering the age
9 years 10 years 11 years 12 years
Questions GI
(n=7) SD GII
(n=7) SD p
GI
(n=6) SD GII
(n=6) SD p
GI
(n=5) SD GII
(n=5) SD p
GI (n=2) SD
GII
(n=2) SD p
1 0,42 0,53 0,00 0,00 0,05 0,16 0,40 0,00 0,00 0,34 0,60 0,89 0,00 0,00 0,17 0,00 0,00 0,00 0,00
-2 0,71 0,75 0,28 0,48 0,23 0,50 0,54 0,16 0,40 0,25 0,60 0,54 0,20 0,44 0,24 0,50 0,70 0,00 0,00 1,00
3 0,57 0,78 0,14 0,37 0,21 0,16 0,40 0,16 0,40 1,00 0,80 0,83 0,20 0,44 0,19 0,50 0,70 0,00 0,00 1,00
4 0,28 0,48 0,28 0,48 1,00 0,33 0,51 0,16 0,40 0,54 0,60 0,54 0,40 0,54 0,57 1,00 1,41 0,50 0,70 0,69
5 0,00 0,00 0,00 0,00 - 0,16 0,40 0,00 0,00 0,34 0,20 0,44 0,00 0,00 0,34 0,50 0,70 0,00 0,00 1,00
6 0,71 0,75 0,14 0,37 0,09 0,50 0,54 0,33 0,51 0,59 1,00 0,00 0,20 0,44 0,00* 0,50 0,70 0,50 0,70 1,00
7 0,00 0,00 0,00 0,00 - 0,00 0,00 0,00 0,00 - 0,20 0,44 0,00 0,00 0,34 0,00 0,00 0,00 0,00
-8 0,00 0,00 0,28 0,48 0,14 0,16 0,40 0,16 0,40 1,00 0,00 0,00 0,20 0,44 0,34 0,50 0,70 0,00 0,00 1,00
9 0,14 0,37 0,14 0,37 1,00 0,16 0,40 0,00 0,00 0,34 0,40 0,54 0,00 0,00 0,14 0,00 0,00 0,00 0,00
-10 0,57 0,78 0,42 0,78 0,73 0,16 0,40 0,00 0,00 0,34 0,20 0,44 0,20 0,44 1,00 0,00 0,00 0,50 0,70 1,00
11 0,42 0,53 0,14 0,37 0,27 0,66 0,51 0,33 0,51 0,28 0,60 0,89 0,00 0,00 0,17 1,00 1,41 0,50 0,70 0,69
12 0,28 0,48 0,00 0,00 0,14 0,16 0,40 0,16 0,40 1,00 0,20 0,44 0,00 0,00 0,34 0,00 0,00 0,00 0,00
-13 0,42 0,53 0,14 0,37 0,27 0,00 0,00 0,16 0,40 0,34 0,20 0,44 0,20 0,44 1,00 0,50 0,70 0,00 0,00 1,00
14 1,14 0,37 0,14 0,37 0,00* 0,83 0,98 0,33 0,51 0,29 1,20 0,44 0,60 0,54 0,09 0,00 0,00 0,50 0,70 1,00
15 0,85 0,69 0,00 0,00 0,00* 1,00 0,89 0,16 0,40 0,06 0,80 0,83 0,00 0,00 0,06 0,50 0,70 0,00 0,00 1,00
16 0,57 0,78 0,14 0,37 0,21 0,33 0,51 0,16 0,40 0,54 0,40 0,54 0,00 0,00 0,14 0,50 0,70 0,00 0,00 1,00
17 0,42 0,53 0,00 0,00 0,05 0,16 0,40 0,33 0,51 0,54 0,60 0,89 0,20 0,44 0,39 0,00 0,00 0,00 0,00
-18 0,71 0,75 0,28 0,48 0,23 0,16 0,40 0,83 0,40 0,01* 1,20 0,83 1,00 1,00 0,74 2,00 0,00 1,00 0,00
-19 0,00 0,00 0,00 0,00 - 0,00 0,00 0,00 0,00 - 0,20 0,44 0,00 0,00 0,34 0,00 0,00 0,00 0,00
-20 0,42 0,78 0,42 0,53 1,00 0,16 0,40 0,16 0,40 1,00 0,40 0,54 0,20 0,44 0,54 0,50 0,70 0,00 0,00 1,00
TOTAL 8,71 4,23 3,00 1,63 0,00* 5,83 3,76 3,66 2,94 0,27 10,40 6,06 3,60 4,33 0,07 8,50 2,12 3,50 2,12 0,14
Student’s t test - * p <0.05 - statistically signiicant / SD = Standard Deviation
Table 4. Comparison of the total score by gender of the subjects of GI
Itens Female (n=3) SD Male (n=17) SD p value
1 0,33 0,57 0,35 0,60 0,9591
2 0,66 0,57 0,58 0,61 0,8406
3 1,00 0,00 0,41 0,71 0,1788
4 1,00 0,00 0,35 0,60 0,0874
5 0,33 0,57 0,11 0,33 0,3610
6 1,00 0,00 0,64 0,60 0,3372
7 0,33 0,57 0,00 0,00 0,0127*
8 0,00 0,00 0,11 0,33 0,5559
9 0,66 0,57 0,11 0,33 0,0282*
10 0,33 0,57 0,29 0,58 0,9161
11 1,00 1,00 0,52 0,62 0,2811
12 0,33 0,57 0,17 0,39 0,5559
13 0,66 0,57 0,17 0,39 0,0771
14 1,00 0,00 0,94 0,74 0,8954
15 0,00 0,00 1,00 0,70 0,0276*
16 0,66 0,57 0,41 0,61 0,5157
17 0,33 0,57 0,35 0,60 0,9591
18 1,66 0,57 0,64 0,78 0,0475*
19 0,33 0,57 0,00 0,00 0,0127*
20 0,33 0,57 0,35 0,60 0,9591
TOTAL 12,00 1,73 7,58 4,56 0,1224
Student’s t test - *p<0,05 – statistically signiicant SD= Standard Deviation
Table 5. Comparison of the total score by gender of the subjects GII
Itens Female (n=3) SD Male (n=17) SD p value
1 0,00 0,00 0,00 0,00
-2 0,33 0,57 0,17 0,39 0,5559
3 0,33 0,57 0,11 0,33 0,3610
4 0,66 0,57 0,23 0,43 0,1473
5 0,00 0,00 0,00 0,00
-6 0,33 0,57 0,23 0,43 0,7347
7 0,00 0,00 0,00 0,00
-8 0,33 0,57 0,17 0,39 0,5559
9 0,33 0,57 0,00 0,00 0,0127*
10 0,66 0,57 0,17 0,52 0,1601
11 0,00 0,00 0,23 0,43 0,3740
12 0,00 0,00 0,05 0,24 0,6860
13 0,33 0,57 0,11 0,33 0,3610
14 0,66 0,57 0,29 0,46 0,2337
15 0,00 0,00 0,05 0,24 0,6860
16 0,00 0,00 0,11 0,33 0,5559
17 0,33 0,57 0,11 0,33 0,3610
18 1,00 1,00 0,64 0,60 0,4055
19 0,00 0,00 0,00 0,00
-20 0,33 0,57 0,23 0,43 0,7347
Rev. CEFAC. 2016 Jul-Ago; 18(4):864-875 Depression in learning disorders | 873
A Mexican study22 compared the severity and the risk
for depression in 130 children with learning disorders
and 130 with normal development, being the irst study to explore the emotional dificulties of Mexican children
with a learning disorder. In the study the CDI inventory was used, and a higher percentage of children with a learning disorder at risk for depression was observed, compared with children with typical development (32%
vs. 18%). The results showed that Mexican children
with learning disorder have higher risk of depression compared to children with typical development and highlight possible comorbidity between depression and
learning problems, the need to promote early identii -cation and effective interventions for emotional support to children with a learning disorder.
Two studies25,27 conducted to investigate depressive
symptoms in children with speciic reading impairment (dyslexia), also the CDI showed that none of the children exceeded the cutoff point for signiicant symptoms,
although the group with the disorder display the highest score for individuals with good academic performance
in most matters, which corroborates the indings of
our study. In the second study, the main symptoms reported by sample members were: comparing with peers their performance; their pessimism about the future; fear that bad things will happen and worry. In our study, the main complaints related to depressive symptoms were the aspects of affectivity, in the form of sadness and loneliness (I get sad often / I feel alone often), cognition, related to lack of motivation and uncertainties (I’m not sure things will work out for me), fears (I fear that bad things happen), guilt (I’m
often worried), vegetative, relecting trouble sleeping (I
have trouble sleeping some nights) and psychomotor,
expressed by fatigue reports (I often get tired).
A study24 that aimed to investigate different proiles
of children with learning problems (nonverbal learning disorder, reading disorder) and with a typical devel-opment, ages 8 up to 11, showed that children with
reading disorders had worse depression symptoms than those with non-verbal learning disabilities and typical development.
By dividing the sample by age, it was observed in
this study statistically signiicant differences in some
respects. For the age group 9 years, these aspects relate to sleep and fatigue (most points in GI). At the
age of 10 years, the relevant aspect was self-eficacy
(the fact that he could be as good as the other children), with higher scores for GII, which is the only item that showed higher scores of children without the disorder, showing concern of these children in relation to their performance. For the age of 11, aspect related to the negative feelings (feeling that something bad can
happen to them) was signiicant and at the age of 12 years, there were no signiicant values according to
the statistical analysis, probably by the small number of participants. Such information is relevant from a clinical point of view, because the importance of early detection of depression symptoms. In routine care, reports are constantly received from patients and their families about the suggestive signs of emotional changes, though, they do not often receive proper attention, since these symptoms can be very subtle6
and confused with other behaviors such as coping, laziness, etc.
Regarding the prevalence of symptoms in both gendes, in the group with disorder there were signif-icant differences in items related to self-esteem (if you like yourself), desire to kill yourself, get tired often,
self-eficacy and feels loved, with a higher score for females, except for the fact of feeling loved, where the
boys had a higher average. In GII, the total shown is
more balanced, where signiicant difference was found
only in the item related to the desire of death, showing higher scores of girls.
Suicidal intent is just one of the present symptoms in depression, it is necessary to evaluate the set of symptoms that the person has and their persistence 28. Table 6. Comparison of the total score between the groups, considering genres
Genre GI GII p value
Female (n=6)
Average 12,00 5,67 0,0900
SD 1,73 4,61
Male (n=34)
Average 7,59 3,00 0,0010*
SD 4,57 2,23
Student’s t test - *p<0,05 – statistically signiicant SD= Standard Deviation
Still, when comparing the groups, girls from GI had higher scores, double points in relation to GII. However,
no statistically signiicant differences were recorded,
probably due to the small number of female subjects. As for the male, on the other hand, there was a
statisti-cally signiicant difference, with higher scores in GI. A
study29 showed that there was no statistical difference
between the genders in relation to children with and without a learning disorder for signs of depression. However, for the results of our study to be conclusive in relation to gender, a sample with a higher number of girls in groups is required.
To investigate the relationship between emotional aspects and learning is essential to understand the impacts that these can promote, especially at school. Thus, this study provided contributions to describe the main predictors’ signs for depression in children with a learning disorder.
CONCLUSION
In this study it was found that children diagnosed
with speciic learning disorders have higher frequency
of depressive symptoms compared to children without
learning dificulties. The main complaints related to
depressive symptoms were the aspects of feeling sad and alone, discouraged and pessimistic, develop fears that bad things can happen, always feel guilty and have
dificulty to sleep.
The signs of depression varied according to age and the gender comparison reveals that girls tend to have more depressive symptoms, especially in the
group of children with speciic learning disorders.
Limitations
The results of this study should not be generalized, because there are some limitations found in this research. Firstly, the sample size for each age group was not regular because there was a small number of participants for the age group of 11 to 12 years, and it is not possible to infer in the relationship between age and predictive signs for depression. Furthermore, a larger number of girls to make the comparison between genders in the groups with and without learning disorder is necessary. Secondly, the study included only self-report measures, that is, only about the
subjective experience of children. Children may ind it dificult to report their thoughts and emotions accurately
future studies are suggested to have a greater control of these variables.
ACKNOWLEDGEMENT
To the National Council for Scientiic and
Technological Development (CNPq), for granting the
scientiic initiation scholarship, enabling the execution
of this study.
REFERENCES
1. Donald W, Black JEG. Guia Para o DSM-5: Complemento essencial para o Manual Diagnóstico e Estatístico de Transtornos Mentais. São Paulo: Artmed; 2015.
2. Pinto NALG. Annual research review: the nature and
classiication of reading disorders - a commentary
on proposals for DSM-5. Rev soc bras fonoaudiol. [serial on the internet]. 2012 [cited 2015 Out 25]; 17(3):370-1. Available from: http://www.scielo.
br/scielo.php?script=sci_arttext&pid=S1516-80342012000300022&lng=en.
3. Siqueira CM, Gurgel-Giannetti, J. Mau desempenho escolar: uma visão atual. Rev Assoc Med Bras. 2011;57(1):78-87.
4. Bender WN, Rosenkrans CB, Crane MK. Stress, depression, and suicide among students with learning disabilities: assessing the risk. Learn Disabil Q. 1999;22(2):143-56.
5. American Academy of Child and Adolescent Psychiatry. Washington: American Academy of Child and Adolescent Psychiatry; 2008.
6. Pereira DAP, Amaral VLAR. Escala de avaliação de depressão para crianças: um estudo de validação. Estud Psicol. 2004;21(1):5-23.
7. American Psychiatry Association. Diagnostic and Statistical Manual of Mental disorders - DSM-5. 5th
ed. Washington: American Psychiatric Association; 2013.
8. Cruvinel M. Correlatos cognitivos e psicossociais de crianças com e sem sintomas depressivos [tese]. Campinas (SP): Universidade Estadual de Campinas; 2009.
Rev. CEFAC. 2016 Jul-Ago; 18(4):864-875 Depression in learning disorders | 875
11. Soares MU. Estudos das variáveis do
desenvolvimento infantil em crianças com e sem o diagnóstico de depressão [tese]. Santa Maria (RS): Universidade Federal de Santa Maria; 2003.
12. Pérez MV, Urquijo S. Depresión en adolescentes. Relaciones com el desempenõ académico. Psicol Esc Educ. 2001;5(1):49-58.
13. Palladino P, Poli P, Masi G, Marcheschi M. The relation between metacognition and depressive symptoms in preadolescents with learning disabilities: data in support of Borkowski’s Model. Learn Disabil Res Pract. 2000;15(3):142-8.
14. Cruvinel M, Boruchovitch E. Depressão infantil: uma contribuição para a prática educacional. Psicol Esc Educ. 2003;7(1):77-84.
15. Cruvinel M, Boruchovitch E. Sintomas Depressivos, estratégias de aprendizagem e rendimento escolar de alunos do ensino fundamental. Psicologia. 2004;9(3):69-378.
16. Fernandes AM, Milan RG. A depressão infantil, o
rendimento escolar e a autoeicácia: uma revisão
da literatura. Rev Cesumar. 2010;15(2):381-403.
17. Stein LM. TDE-Teste de desempenho escolar: manual para aplicação e interpretação. São Paulo: Casa do Psicólogo; 1994.
18. Gouveia VV, Barbosa GA, Almeida HJF, Gaião AA. Inventário de depressão infantil - CDI: estudo de adaptação com escolares de João Pessoa. J bras psiquiatr. 1995;44(7):345-9.
19. Kovacs M. Children Depression Inventory CDI: Manual. New York: Multi-Health Systems, Inc.; 1992.
20. Ciasca SM. Distúrbios e diiculdades de
aprendizagem: questão de nomenclatura. In: Ciasca SM. Distúrbios de aprendizagem: proposta de avaliação interdisciplinar. São Paulo: Casa do Psicólogo; 2003. p. 19-32.
21. Enumo SRF, Ferrão ES, Ribeiro MPL. Crianças com
diiculdade de aprendizagem e a escola: emoções
e saúde em foco. Estud psicol. 2006;23(2):139-49.
22. Gallegos J, Langley A, Villegas D. Anxiety, Depression, and Coping Skills Among Mexican
School Children: A Comparison of Students With and Without Learning Disabilities. Learn Disabil Q. 2012;35(1):10.
23. Hall CW, Haws D. Depressive symptomatology in learning-disabled and nonlearning-disabled students. Psycho. Schs. 1989;26:359-64.
24. Mammarella IC, Ghisi M, Bomba M, Bottesi G,
Caviola S, Broggi F. Anxiety and Depression in
children with Nonverbal Learning Disabilities, Reading Disabilities or Typical Development. J Learn Disabil. 2014;47(6) 1-10.
25. Lima RF, Salgado CA, Ciasca SM. Associação da
dislexia do desenvolvimento com comorbidade
emocional: um estudo de caso. Rev. CEFAC. 2011;13(4):756-62.
26. Wright-Strawderman C, Watson BL. The prevalence of depressive symptoms in children with learning disabilities. J Learn Disabil 1992;25(4):258-64. 27. Lima RF, Salgado CA, Ciasca SM. Desempenho
neuropsicológico e fonoaudiológico de crianças
com dislexia do desenvolvimento. Rev psicopedag.
2008;25(79):226-35.
28. Carmo AL, Silva APB. Depressão infantil:
Uma realidade presente na escola. Nucleus. 2009;6(2)333-44.
29. Lima RF, Ciasca SM. Depression Symptoms
and Neuropsychological Functions in Children
with Learning Dificulties. Rev Neurocienc.