(1) Faculdade de Medicina da Universidade de São Paulo, Campus Ribeirão Preto, São Paulo, Brasil.
(2) Faculdade de Filosofia e Ciências - FFC, UNESP, Marília, São Paulo, Brasil. (3) Universidade Estadual de Campinas -
UNICAMP, Campinas, São Paulo, Brasil.
Conflict of interests: Nonexistent
Vectoelectronystagmography in children
with dyslexia and learning disorder
Ana Carla Romero Leite(1) Mariana Banzato Stenico(2) Letícia Sampaio de Oliveira(2) Eloisa Sartori Franco(3) Simone Aparecida Capellini(2) Ana Claudia Figueiredo Frizzo(2)
Received on: August 28, 2017 Accepted on: July 12, 2018
Corresponding author:
Letícia Sampaio de Oliveira Av. Higino Muzi Filho, 737, Mirante CEP: 17525-900 - Marília, São Paulo, Brasil
E-mail: leticiaoliveira.fono@gmail.com
ABSTRACT
Objective: to describe and compare the results of ocular (saccadic, screening, and optokinetic) tests of vectoelectronystagmography among the groups with dyslexia, learning disorder and control.
Methods: 28 male and female students aged 8 to 11 years participated in this study. They were divided into three groups: Group I, 10 students with dyslexia, Group II, 9 students with learning disorders and Group III, 9 students with no learning disorders. In this research, digital vectoelectronystagmography - ocular test – was performed. Results: saccadic movement, optokinetic nystagmus, and pendular tracking tests were found to show subtle differences among the three groups. Comparing the sac-cadic eye movements and the optokinetic nystagmus tests, it was observed that the movement in the left eye was slower for Group I, and even slower for Group II. It was also observed that GI and GII were slower for the pendular tracking of luminous stimu-lus in relation to the control group.
Conclusion: in general, there are differences among the groups in the vectoelectronys-tagmography, which indicated slower tracking and vestibulo-ocular reflex in children with dyslexia and learning disorders.
INTRODUCTION
Digital vectoelectronystagmography is one of the most used methods reported in the literature to evaluate vestibular function, the exam has greater diagnostic sensitivity as it allows to measure the parameters of the vestibulo-oculomotor function through the comparison between the stimuli and the responses, in addition to identifying the direction of ocular phenomena1-3.
The Diagnostic and Statistical Manual of Mental Disorders (DSM-V) aims to help in the diagnosis of mental and neurodevelopment disorders by describing the most common characteristics and symptoms of a particular disease. According to the DSM-V, a learning
disorder consists of a wide range of specific disorders
of hearing, speech, reading, writing and mathematics, and is most prevalent among the diagnoses of learning disabilities4,5.
Dyslexia is a developmental disorder characterized
by significant and specific difficulties in reading and writing, such as difficulties in acquiring basic skills such as reading words and spelling and decoding skills, resulting in phonological deficit, changes in lexical
development, and executive functions, in addition to
low performance in tasks of sustained visual attention6-8. According to the literature9, two factors seem to explain learning disorders: inability with coordination movements and absence of perception of their spatial position. Most of the children are not able to practice physical exercises, have abnormal head positions during writing, distort the size and weight of their own body and objects around them.
The literature10,11 reports the relation between
dyslexia and learning disorders with fine motor
coordination changes, as well as the relation between perceptual-motor changes and the reading perfor-mance of these children. The literature highlights the importance of understanding these relationships at the time of evaluation and diagnosis.
In clinical practice, children with visual and auditory
attention difficulties are often observed; and as they need to follow the teacher in their visual field in the classroom, they need to make copies, to read the book’s tasks, and to concentrate, their oculomotor
functions and vestibular interconnections need to be sound12.
The saccadic pathway involves several regions of the cerebral cortex, cerebellum, and brain stem. The parameters latency, velocity and accuracy of saccadic
movements evaluate the efficiency of central nervous
system (CNS) control over rapid eye movements13.
Thus, such information may be extremely important for the evaluation and intervention of children with dyslexia.
Authors14 claim that early identification of vestibular disorders in children and initiation of their treatment is essential to prevent and solve school complications, which often occur.
Therefore, this study aims to describe and compare the results of ocular tests (saccadic movement,
pendular tracking, and optokinetic nystagmus) among
the groups with dyslexia, learning disorders and control group.
METHODS
The study was carried out after the approval by the
Ethics Committee in Research of Faculdade de Filosofia
e Ciências, UNESP, under number: 0694/2013. All subjects were invited to participate in the study and signed the Informed Consent.
A total of 28 schoolchildren of both genders, aged 8 to 11 years, attending the 3rd to 5th year of municipal public schools in a city in the state of São Paulo, were divided into three groups.
Group I (GI): Composed of 10 students, four female and six male schoolchildren, with the interdisciplinary diagnosis of Dyslexia, according to the DSM-V4 criteria, enrolled in a municipal school in a city in the State of São Paulo and in a waiting list for care service in the Rehabilitation Specialized Center.
Group II (GII): Composed of nine students, four
female and five male schoolchildren, with an interdis -ciplinary diagnosis of Learning Disorder, according to DSM V4 criteria, enrolled in a municipal school in a city in the State of São Paulo, in a waiting list for care service in the Rehabilitation Specialized Center.
Group III (GIII): Composed of nine students without
learning difficulties from a municipal public school in
a city in the state of São Paulo, matched according to gender and age with groups I and II.
Participants from groups I and II were diagnosed at school and had a persistent documented history of school impairment. All participants had mean perfor-mance on WISC-II intelligence tests (80 was chosen as the cutoff point). Reading and writing tests were carried out to measure reading speed and spelling to charac-terize the groups, as well as spelling and phonological awareness tests.
The students in GIII were referred by the school teachers based on the information contained in the school records and the performance report of the
year, and those who presented satisfactory perfor-mance in two consecutive bimesters in Portuguese language tests were considered as students with good academic performance; those who presented unsat-isfactory performance in two consecutive bimesters in Portuguese Language tests were discarded from this study.
None of the participants had previous history of neurological diseases, psychiatric disorders or hearing problems. In addition, participants with comorbidities regarding attention and/or behavior issues were excluded from the study.
All children included in the study underwent previous screening procedures: (1) Inspection of the auditory canal; (2) Tonal threshold audiometry; (3) Logoaudiometry; (4) Acoustic immitance measurements.
For the present study, the following procedures were used:
Firstly, regular calibration and absence of sponta-neous and semi spontasponta-neous nystagmus with open and closed eyes were observed, to exclude the presence of primary vestibular pathology.
Next, an evaluation of the digital
vectoelectronys-tagmography was performed with the equipment
Neurograff - Eletromedicina Ind. & Com. Ltda. Surface electrodes were attached with adhesive tape together with a paste for conducting the electrical signal in the
periorbital region of the subject, after cleaning the skin with abrasive substance (gauze soaked in alcohol),
as described in the literature9, to form a 30o isosceles triangle.
Electrodes 1 and 2 were placed in the outer corner of the right eye and the left eye, respectively, and electrode 3 was placed on the forehead to form the
apex of the triangle. The ground electrode was fixed in
the frontal region to ease possible interference in the recording. All data collection was performed
individ-ually in a 60-minute session in the Institution’s Auditory
Objective Assessment Laboratory (Laboratório de Avaliação Objetiva da Audição da Instituição).
Previous guideline to the exam: Selected subjects were instructed to avoid foods containing caffeine and non-essential drugs for 72 hours prior to the test. The test was performed with a four-hour fasting.
Calibration of eye movements: The children were instructed to stand with their heads upright and still,
sitting on the chair, and looking alternately at the light
points that appeared on the bar placed in the horizontal
plane in front of them, in order to make a deviation
of 10º to the right and to the left, for 20 seconds at 0.30Hz, according to the parameters suggested in the Neurograff version 3.0 user manual. Previous training was carried out with the subjects and the vectoelect-ronystagmography measurement was started when the
ideal - reference tracing configuration was reached.
Saccadic movement tests: The children were instructed to follow the light point on the bar, which ignited randomly for 20 seconds at 0.70 Hz, evaluating the integrity of the CNS for rapid movements.
Pendular tracking tests: The children were instructed
to follow the light point in the horizontal plane, which glided along the bar forming a sinusoidal curve at the
frequencies of 0.10 Hz 0,20 Hz and 0,40 Hz.
Optokinetic nystagmus tests: The children were
instructed to count the points that appeared in the
horizontal plane for 30 seconds at 1.00 Hz clockwise and counterclockwise, thus producing a nystagmus by
the visual follow-up of the light points that moved from one side to the other.
Statistical analysis
Descriptive analyzes of the test results were performed, from the construction of tables with mean values and standard deviation, by group, ear and eye.
Shapiro-Wilk test was applied to verify data normality.
The comparison of the numerical variables between the studied groups was carried out through the analysis of variance – F-Test (ANOVA), parametric test to compare means using the variance in data which
necessarily configure normal distribution.
The result was described as p value, and the level
of significance was always 5% or 0.05 (p ≤ 0.05). The
statistics software was SPSS® 9.0.
RESULTS
Table 1 shows the mean values, standard deviation and comparison (p value) between dyslexia and control groups from ocular evidence of saccadic eye
movements and optokinetic nystagmus test of the right
eye.
When comparing GI and GIII for the saccadic eye
movement tests and optokinetic nystagmus analysis, no statistically significant differences were observed
Table 1. Mean, Standard Deviation and comparison (p value) between dyslexia and control groups of ocular tests of saccadic eye movements and optokinetic nystagmus of the right eye
Variable Mean SD P Value
Sac. Mov. RE
Lat GI 163.81 47.95
0.78
GIII 169.65 43.07
Vel GI 91.36 12.83
0.32
GIII 104.16 36.88
Accuracy GI 104.71 32.10
0.64
GIII 111.23 28.01
Optok. RE
S-VEL GI 11.60 3.30
0.62
GIII 10.60 2.12
Gain GI 0.93 0.28
0.93
GIII 0.92 0.19
DP GI 5.86 4.90
0.98
GIII 6.12 4.15
Caption: SD = standard deviation; Sac. Mov. = saccadic movement; RE = right eye; Lat = latency; Vel = velocity; S-VEL = slow-phase velocity of nystagmus; DP = directional preponderance.
(F-Test ANOVA – significance level p ≤ 0.05.)
In the comparison of GII and GIII for the results
of saccadic eye movement tests and optokinetic nystagmus tests, there was also no significant
difference (Table 2).
There was no significant difference between GI and
GIII in the comparison of saccadic eye movements
and optokinetic nystagmus tests, except for the slower
movement velocity of the left eye in the group with dyslexia (Table 3).
Table 2. Mean, Standard Deviation and comparison (p value) between the learning disorder and control groups of ocular tests of saccadic eye movements and optokinetic nystagmus of the right eye
Variable Mean SD P Value
Sac. Mov. RE
Lat GII 157.72 36.51
0.53
GIII 169.65 43.07
Vel GII 84.84 38.75
0.29
GIII 104.16 36.88
Accuracy GII 86.58 33.53
0.11
GIII 111.23 28.01
Optok. RE
S-VEL GII 10.04 3.31
0.91
GIII 10.60 2.12
Gain GII 0.79 0.27 0.52
GIII 0.92 0.19
DP GII 4.84 0.27
0.78
GIII 6.12 4.15
Caption: SD = standard deviation; Sac. Mov. = saccadic movement; RE = right eye; Lat = latency; Vel = velocity; S-VEL = slow-phase velocity of nystagmus; DP =
directional preponderance.
Table 3. Mean, Standard Deviation and comparison (p value) between the dyslexia and control groups of ocular tests of saccadic eye movements and optokinetic nystagmus of the left ey
Variable Mean SD P Value
Sac. Mov. LE
Lat GI 175.54 36.68
0.80
GIII 171.70 30.67
Vel GI 94.89 19.40
0.06
GIII 118.31 31.10
Accuracy GI 99.97 17.43
0.25
GIII 111.66 25.96
Optok. LE
S-VEL GI 10.69 2.90
0.92
GIII 10.53 3.87
Gain GI 0.90 0.28
0.93
GIII 0.95 0.27
DP GI 5.86 4.90
0.98
GIII 6.12 4.15
Caption: SD = standard deviation; Sac. Mov. = saccadic movement; LE = left eye; Lat = latency; Vel = velocity; S-VEL = slow-phase velocity of nystagmus; DP =
directional preponderance.
(F-Test ANOVA – significance level p ≤ 0.05.)
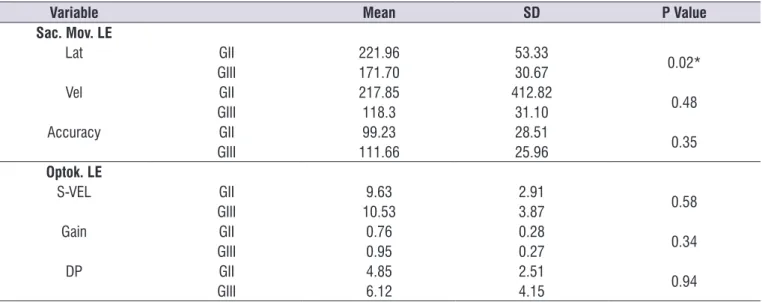
In the comparison between GII and GIII in the
saccadic eye movement tests compared to optokinetic nystagmus tests, there was no significant difference,
except for the latency of the saccadic movement of the left eye, which had the longest latency in the group with learning disorder (Table 4).
In general, GI and GII were slower for the pendular
tracking with light stimulus in relation to the control
group (Table 5 and 6).
Table 4. Mean, Standard Deviation and comparison (p value) between the learning disorder and control groups of ocular tests of saccadic eye movements and optokinetic nystagmus of the left eye
Variable Mean SD P Value
Sac. Mov. LE
Lat GII 221.96 53.33
0.02*
GIII 171.70 30.67
Vel GII 217.85 412.82
0.48
GIII 118.3 31.10
Accuracy GII 99.23 28.51
0.35
GIII 111.66 25.96
Optok. LE
S-VEL GII 9.63 2.91
0.58
GIII 10.53 3.87
Gain GII 0.76 0.28
0.34
GIII 0.95 0.27
DP GII 4.85 2.51
0.94
GIII 6.12 4.15
Note:*p < 0.05
F-Test ANOVA – significance level p ≤ 0.05.
Caption: SD = standard deviation; Sac. Mov. = saccadic movement; LE = left eye; Lat = latency; Vel = velocity; S-VEL = slow-phase velocity of nystagmus; DP =
Table 5. Mean, SD and comparison (p value) between dyslexia and control groups of ocular tests of pendular tracking
Variable Mean SD P Value
Pendular Tracking
Gain 0.10 GI 1.01 0.28
0.98
GIII 1.02 0.70
Gain 0.20 GI 1.11 0.28
0.41
GIII 1.26 0.28
Gain 0.40 GI 0.98 0.28
0.04*
GIII 1.30 0.24
Note: *p>0.05.
F-Test ANOVA – significance level p ≤ 0.05. Caption: SD= standard deviation.
Table 6. Mean, SD and comparison (p value) between learning disorder and control groups of ocular tests of pendular tracking
Variable Mean SD P Value
Pendular Tracking
Gain 0.10 GII 0.65 0.18
0.20
GIII 1.01 0.70
Gain 0.20 GII 0.86 0.31
0.02*
GIII 1.26 0.28
Gain 0.40 GII 1.03 0.26
0.14
GIII 1.30 0.24
Note: *p>0.05.
F-Test ANOVA – significance level p ≤ 0.05. Caption: SD= standard deviation.
DISCUSSION
From the results of the present study and the liter-ature, it is possible to conclude that otoneurological evaluation should always be indicated for patients with suspected or diagnosed with learning disorders and/ or poor school performance, as patients often present vestibular alteration with evident repercussion in their postural balance, which often causes changes in the notion of laterality and space, in addition to causing inattention in the classroom15.
The literature has reported that the spatial perception of children with vestibular disorder is worse than in children without this disorder in relation to the use of a sheet of paper when drawing and the proportion between objects. However, if the otoneurological evalu-ation is not performed, the poor spatial perception may be confused with other disorders, especially in
the school phase when the child is asked to perform
this type of activity. It is concluded, therefore, that early diagnosis of vestibulopathy is important to initiate treatment/rehabilitation; and symptoms, such as spatial
disorientation, do not influence learning16 or is not confused with learning disorders and/or dyslexia.
Thus, professionals in the field should better under -stand the occurrence of vestibular system disorders in childhood, which can cause changes in motor
devel-opment and acquisition of oral and written languages, affecting communication skills, psychological behavior
and school performance17. They also cause difficulties
in oral and written language as a consequence of
compromising posture and body balance, as well as motor coordination, and interfere with spatial
relation-ships and adequate contact with the environment, also changing children’s learning and ability to
communicate18.
It is noteworthy that other authors found that
approx-imately 56.8% of the students with some kind of otoneu -rological complaint have poor school performance. On the other hand, the same unsatisfactory performance
reaches 63.6% of the students who reported having no
comparing children suspected or diagnosed with a language disorder with children with typical devel-opment, to investigate the prevalence of vestibular disorders in schoolchildren with language impairment.
In this study, after vectoelectronystagmography,
it was verified that the saccadic movement, optoki
-netic nystagmus and pendular tracking tests showed
subtle differences among the groups of children with dyslexia and learning disorder in relation to the control
group. For the saccadic eye movement and optokinetic nystagmus tests, there was no statistically significant
difference in any group, except for the movement velocity of the left eye which was slower in both patho-logical groups.
These results are similar to those found in the literature in which otoneurological changes were also observed in children with developmental disorders,
such as attention deficit hyperactivity disorder, dyslexia,
and learning disorders19,20. Such changes may be
related to a possible inefficiency of the central nervous
system control on the rapid movements of the eyes,
a function which is compromised in children with diffi -culty in reading and writing15, as the ocular movement
required for reading requires alternating saccadic
movements and the eye control during periods of
fixation, requiring perfect integrity of the vestibular
apparatus and its saccadic movements16,17.
The findings on pendular tracking, in general,
indicate that the groups with dyslexia and learning disorder were slower than the control group, which, according to the literature, is related to the incom-plete maturation of the pathways controlling the
slow-tracking ocular movements, and/or poor attention span
of children in the pathological group, and may only
result in slower trackings16,17.
It is believed that otoneurological evaluation can
become a more efficient instrument in the evaluation
and possible diagnosis in these children, and may also aid in speech-language intervention5,21, which, from the otoneurological results, can focus on activities that train notions of laterality and space, in addition to reading and writing, or even the joint activities. Therefore, it is suggested that this subject be approached in future studies, as the national literature investigating the evaluations of vectoelectronystagmography in children with dyslexia and learning disorders is scarce.
CONCLUSION
In general, significant differences were observed
among the groups for the vectoelectronystagmography
measurement, which indicate slower vestibular-ocular
reflexes and tracking in children with dyslexia and
learning disorders.
REFERENCES
1. Mor R. Fragoso M. Vestibulometria na prática fonoaudiológica. São José dos Campos, São Paulo: Pulso Editorial; 2012.
2. Caovilla HH, Ganança MM, Munhoz MSL, Silva MLG,
Frazza MM. Body equilibrium and its disorders:
Part V: value of computed nystagmography. Braz J Otorhinolaryngol. 1997;4(5):158.
3. Soriano-Ferrer M. Implicaciones educativas del
deficit cognitivo de la dislexia evolutiva. Rev Bras
Neurol. 2004;38(1):47-52.
4. American Psychiatric Association. DSM-5 Development [Internet]. 2011 [cited 2012 Aug 27]. Available from: http://www.dsm5.org/Pages/ Default.aspx.
5. Ganança MM, Caovilla HH. A múltipla abordagem terapêutica. In: Ganança MM (org). Vertigem tem cura? São Paulo: Lemos; 1998. p.59-61.
6. Lyon GR, Fletcher JM, Barnes MC. Learning
disabilities. In: Mash EJ, Barkley RA (ed). Child
Psychopathology: Guilford Press. 2003; 2nd edition. p.157-79.
7. Oliveira AM, Germano GD, Capellini SA. Comparação por sexo do desempenho em leitura de escolares com dislexia do desenvolvimento. Paidéia. 2017;27(68):306-13.
8. Mc Hugh HE. Auditory and vestibular disorders in children. Laryngoscope. 1962;72:555-65.
9. Silva NSM, Crenitte PAP. Linguistic, familial and
gender profile of students diagnosed with dyslexia
of a school clinic. Rev. CEFAC. 2014;16(2):463-71. 10. Shawitz SE. Dyslexia. N Engl j med.
1998;338(5):307-12.
11. Shaywitz BA, Shaywitz SE, Pugh KR, Mencl WE,
Fullbright RK, Skudlarski P et al. Disruption of
posterior brain systems for reading in children with developmental dyslexia. Biol Psychiatry. 2002;52(2):101-10.
12. Mathes PG, Denton CA. The prevention and
identification of reading disability. Semin pediatr
neurol. 2002;9(3):185-91.
13. Ventura DFP, Ganato L, Mitre EI, Mor R. Parâmetros
de oculomotricidade à nistagmografia digital em
14. Mor R, Fragoso M, Taguchi CK, Figueiredo JFFR. Vestibulometria & Fonoaudiologia - Como realizar e interpretar. São Paulo: Lovise; 2001.
15. Marchesin VC, Caovilla HH, Ganança MM. Saccadic eye movements in children with auditory processing disorders. Acta ORL. 2005;23(2):7-12. 16. Santos MTM, Behlau MS, Caovilla HH. Dyslexic
children: nystagmographic evaluation of eye movement in reading. Rev Bras Med. Otorrinolaringol. 1995;2(2):100-7.
17. Franco ES, Panhoca I. Otoneurologic evaluation
in children with school difficulties: vestibular
function investigation. Rev Bras Otorrinolaringol. 2007;73(6):803-15.
18. Pereza MLD, Lemosb NF, Aprilea MR, Branco-Barreiro FCA. Sintomas otoneurológicos em
escolares. Rev. Equilíbrio Corporal Saúde.
2014;6(2):48-53.
19. Aksoy S, Akdogan O, Gediklil Y, Belgin E. The extent
and levels of tinnitus in children of central Ankara.
Int J Pediatric Otorhinolaryngol. 2007;1(2):263-8 20. Mangabeira PLA, Gananca MM, Caovilla HH, Ito YI,
Casto HD. Atlas de vecto-electronistagmografia.
São Paulo, Ache; 1984.