Volume 30, número 1, 2005
www.scielo.br/eq
Use of experimental design in the optimisation of a solid phase
preconcentration system for Cobalt determination by GFAAS
G. D.Matos1, C. R. T. Tarley1, S. L. C. Ferreira2 e M. A. Z. Arruda 1*
1Departamento de Química Analítica, Universidade Estadual de Campinas (Unicamp), Campus Universitário
Zeferino Vaz, P.O. Box, 6154, 13084-971, Campinas, São Paulo, Brasil
2Departamento de Química Analítica, Universidade Federal da Bahia (UFBA),
Campus Universitário da Ondina, 40170-290, Salvador, Bahia, Brasil
*To whom correspondence should be addressed.
E-mail: [email protected]
Abstract: In this work is proposed a solid phase preconcentration system of Co2+ ions and its posterior
determination by GFAAS in which fractional factorial design and response surface methodology (RSM) were used for optimization of the variables associated with preconcentration system performance. The method is based on cobalt extraction as a complex Co2+-PAN (1:2) in a mini-column of polyurethane foam (PUF) impregnated with 1-(2-pyridylazo)-naphthol (PAN) followed by elution with HCl solution and its determination by GFAAS. The chemical and flow variables studied were pH, buffer concentration, eluent concentration and preconcentration and elution flow rates. Results obtained from fractional factorial design 25-1 showed that only the variables pH, buffer concentration and interaction (pH X buffer concentration) based on analysis of variance (ANOVA) were statistically significant at 95% confidence level. Under optimised conditions, the method provided an enrichment factor of 11.6 fold with limit of detection and quantification of 38 and 130 ng L-1, respectively, and linear range varying from 0.13 to 10 µg L-1. The precision (n = 9) assessed by relative standard deviation (RSD) was respectively 5.18 and 2.87% for 0.3 and 3.0 µg L-1 cobalt concentrations.
Keywords: Experimental Designs; preconcentration system; polyurethane foam; cobalt.
Introduction
Cobalt is considered an essential element for living organisms in which present important role in metabolic process mainly those involving the vitamin B12 [1]. Due to its low concentration mainly in na-tural water samples (0.1-0.5 µg L-1) [2] analytical methods with high sensitivity for its determination are required. In this way, in atomic spectrometry including flame atomic absorption spectrometry (FAAS) and graphite furnace atomic absorption spectrometry (GFAAS), the methods for cobalt determinations commonly are accomplished by inserting preconcentration step previous to measurements. In GFAAS, the methods are more
promising due to higher power of detection than FAAS, thus indicating that preconcentration systems associate with GFAAS is an attractive approach to enhance its performance based on sensitivity.
approach for metal determination, many procedures are still optimised using univariate methodology. Particularly, in flow system in which several chemical and flow variables are optimised, the univariate methodology process may lead to erroneous conclusions when the effect of one par-ticular variable is dependent to others [7]. Furthermore, such optimisation presents time consuming and is less economical. In this way, in order to circumvent this drawbacks, experimental designs based on multivariate optimisation seems the most useful tool for searching those optimum conditions in an analytical method.
The first step of multivariate optimisation is accomplished screening the factors studied (full factorial or fractional factorial) in order to obtain their significant effects in the analytical system. In a full factorial the combination of K variables is investigated by two levels, thereby this design will consist of 2K experiments. Thus, to evaluate 7 variables 128 experiments will be need; for 8 variables 256 experiments have to be carried out; therefore it is obvious that the number of experiments depends on the number of variables. The fractional factorial design has successfully been used when several variables need to be optimised. It is based on a fraction (1/2, 1/4, 1/8……1/2p) of the full factorial and establish that the effect of third order or higher are negligible; so the number of experiments assume 2K-p experiments whereas p is the size of the fraction [8]. Hence, if p = 1, the screening of 7 variables by using a fractional factorial design is accomplished with only 64 experiments. After established the significant factors from full or fractional design the optimum operation conditions is attained by using simultaneous designs more complete such as Doehlert designs, central composite and star design plus central point [9-12]. With these designs, quadratic function as below demonstrated are obtained, in which describe the presence of surfaces being possible to attain the optimum condition.
Y = b0 +b1X1 + b2X2 + b1X12 + b 2X2
2 + b 12X1X2
where X1 and X2 are the factors studied; b0
is an independent term; b1 and b2 are the coefficients of the linear terms and b12 is the coefficient involved with the interactions between the factors.
Several studies involving experimental
designs have been employed for achieve optimum condition in solid phase preconcentration procedures for organic and inorganic species determination [13,14].
Thus, the aim of this work was to establish a multivariate methodology based on fractional factorial designs 25-1 and star design plus central point for optimisation of variables associated to solid phase preconcentration of cobalt onto a polyurethane foam mini-column impregnated with 1-(2-pyridylazo)-naphthol (PAN) with posterior determination by GFAAS. PAN was chosen due to remarkable capacity to complex transitions metals. In addition, this reagent has been immobilized on Dowex 50W X4-400 cation-exchange resin on solid phase spectrophotometry procedures for copper determination [15] Also, it has been impregnated on Amberlite XAD-2 [16] and Ambersorb 563 resin [17] in procedures for trace metals determination by FAAS.
Experimental
Instrumentation
The absorbance measurements based on peak area were performed in a Perkin-Elmer AAnalyst 600 atomic absorption spectrometer equipped with a longitudinal Zeeman-effect background correction system, as well as graphite atomiser tube with integrated L’vov platforms. Cobalt hollow cathode lamp used as radiation source was operated at standard conditions as recommended by manufacturer. For preconcentration system, a home-made injector commutator was used to select preconcentration/elution steps while all solutions were propelled by an Ismatec Model IPC peristaltic pump with Tygon tubes and connections made of Teflon. The mini-column used for packing the polyurethane foam impregnated with 1-(2-pyridylazo)-naphthol (PAN) was made in polyethylene tube (6 cm length and 4 mm i.d.). The pH of solutions was measured with a Digimed DM 20 pH meter.
Reagents and solutions
standard solutions were prepared immediately before use, by dilution of a 1000 mg L-1 stock standard solutions (Merck). Stock solutions of phosphate and borate buffer (Merck) were, respectively, prepared from KH2PO4 and Na2B4O7.10H2O salts dissolved in 1000 mL of deionised water and pH adjusted with 1.0 mol L-1 HCl solution or 1.0 mol L-1 NaOH solution.
For preparing the 1-(2-pyridylazo)-naphthol solution at 0.05 % (w/v) concentration, 0.025 g of the reagent was dissolved in 50 mL of ethanol (99.5% v/v) (J. T. Baker).
Commercial polyurethane foam open-cell polyether-type (PUF) was used as a support materi-al to PAN provided 10-12 cells per linear cm resilience and had a density of 23 mg cm–3. Before packing into mini-column, PUF was submitted to the treatment as previously described [18].
Preparation of mini-column of PUF impregnated with PAN
The loading of PAN onto PUF was performed by percolating the 0.05 % (w/v) PAN solution through a mini-column packed with 100 mg of polyurethane foam at a flow rate of 2.5 mL min-1 for 5 min. Then, a 10% (v/v) sodium hydroxide solution was percolated through mini-column in order to remove the excess of PAN until effluent became colourless. Afterwards, at the same flow rate, the mini-column was washed with 5% (v/v) nitric acid solution and deionised water to prevent any metal contamination.
Preconcentration system
The preconcentration step was accomplished by propelling a cobalt solution buffered at pH 8.2 with borate buffer through 100 mg of PUF-PAN packed into mini-column at flow rate of 5.0 ml min-1, where Co2+ ions were retained by complex formation as Co2+-PAN (1:2). After preconcentration, the elution step was made by switching the position of injector whose Co2+ ions were displaced from mini-column by 1.0 mL of 0.1 mol L-1 HCl at the same preconcentration flow rate. The eluate colleted in flasks was then analysed by GFAAS. The graphite furnace program applied for cobalt determination was carried out by recommendation of manufactures.
Optimisation strategy
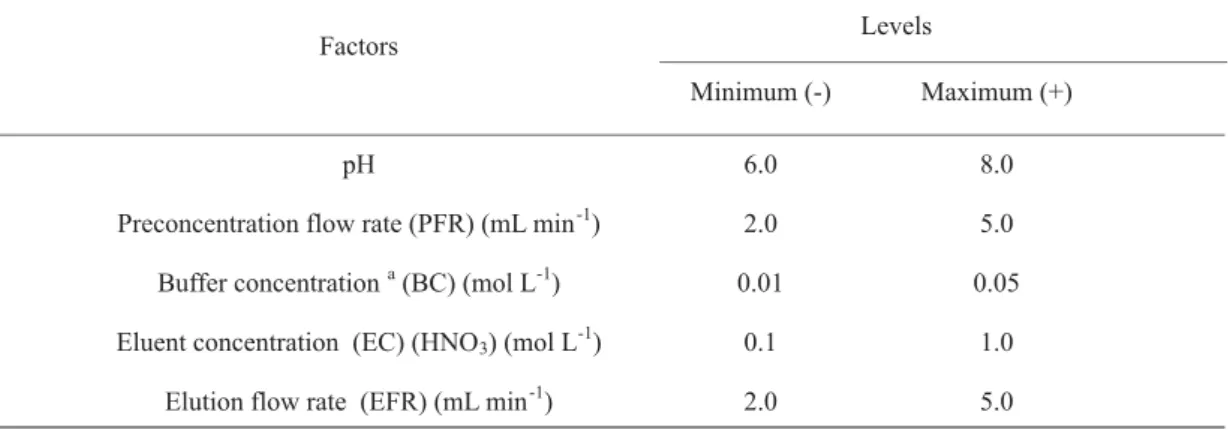
The first step of the multivariate studies was carried out aiming to screen the effect of five factors in the preconcentration system. For this task, a fractional factorial design 25-1 without replicates was conducted with only 16 experiments. In order to analyse which effects from factors and their interactions that possibly to be confounded, the generator I= abcde of fractional factorial design was adopted. The flow and chemical variables including sample pH, preconcentration and elution flow rates, buffer and eluent concentration in which commonly affect the solid phase preconcentration were evaluated. Minimum and maximum levels of these variables are summarised in Table 1.
Table 1. Factors and experimental domain used in the fractional factorial design 25-1 for multivariate
analyses of the cobalt preconcentration system
These experiments were performed under a random order by preconcentration 25 mL of cobalt solution 2.0 µg L-1 followed by elution with 1.0 mL of HCl solution.
After establishing the significant factors in the preconcentration system, assays based on design 22 plus central point were carried out in order to achieve the best results in central point. Additional design based on EVOP (Evolution Operation) was made by shifting the direction of factors so that higher analytical response could be obtained in central point. Once obtained such conditions, the star design plus central point, in which makes possible to achieve the quadratic function was
performed. Finally, from quadratic function as well as the respectively response surface, the optimum values of the factors studied were obtained.
Results and Discussion
Fractional Factorial design for assessing the effect of experimental variables
The fractional factorial design 25-1 performed without replicates was employed as the first screening to evaluate the result and estimate of the main effects (in this case called as estimate of the contrast) to the preconcentration system of cobalt. The experimental results are shown in Table 2.
Table 2. Fractional factorial design 25-1 and the results obtained for cobalt determination after
preconcentration onto PUF-PAN. The generator of fractional factorial design is I = abcde
A briefly evaluation from data shown in Table 2, demonstrate that higher analytical response are obtained in the runs 2, 4, 10 and 12, thus previously indicating that only pH and buffer concentration factors are significant. The significance of factors can be confirmed by probability cumulative plot displayed in Fig. 1. As can be illustrates, all points nearly on a linear curve on probability cumulative plot are not significant, thus attesting that only pH, buffer concentration and interaction (pH X buffer concentration) are statistically significant at 95% confidence level.
As a chemical evaluation, the positive contrast obtained for pH indicates that cobalt complexation with PAN reagent takes place in pH range above the experimental domain i.e, its complexation is favored at pH higher than 8. On the other hand, negative contrast obtained for buffer concentration shows that higher concentration provides a decrease in the analytical signal probably due to competition between phosphate anions with PAN for cobalt ions. The effects for preconcentration and elution flow rate factors, as well as its interactions were not significant, thus indicating that a fast kinetic process is involved in the formation of the Co2+-PAN (1:2) complex. The insignificance of eluent concentration factor indicates that 0.1 mol L-1 HCl solution is enough to release the cobalt retained by PAN in the mini-column.
After establishing pH and buffer concentration as statistically significant factors, a new factorial design based on 22 plus central point was evaluate. These experiments were performed setting all the other factors fixed: 5.0 mL min-1 preconcentration flow rate, 0.1 mol L-1 HCl as eluent and 5.0 mL min-1 elution flow rate. Maximum and minimum levels, central point and results are showed in Table 3.
Figure 1. Probability cumulative plot , BC =
phosphate buffer concentration.
Table 3. Design 22 plus central point using KH
2PO4/NaOH as buffer solution
As one can see, it is possible to note that in the central point does not present the best analytical response. Therefore, a new experiment using EVOP based on design 22 plus central point was performed so that an optimum region was attained. However,
for these experiments the phosphate buffer was changed to a borate buffer because it provides a much better buffering capacity in this new pH ran-ge (7.0-9.0). The results obtained are shown in Table 4, together with the corresponding matrix design.
As one shown, in the range tested for these factors the best results were observed in central point. According to these data, it was necessary to evaluate the significance of linear regression model for further application of star design plus central point. Thus, test for significance of the regression model and test for lack of fit were performed by analysis of variance (ANOVA). In this sense, according to F-test, the ratio between medium quadratic of lack of fit (lof) and pure experimental error (pe) was compared to tabled values of F-distribution. Hence, as Flof/pe (368.7) exceeded the critical F2,2,95% (19.0), the linear model presents lack of fit and obviously it is considered unsatisfactory. Once known that the best results were obtained around central point as well as the linear model was not satisfactory, the star design plus central point (three measurements) was carried out in order to
obtain a quadratic function. The levels used and respectively responses are summarized in Table 5. The ANOVA results obtained from this design showed that the quadratic model did not show lack of fit since Flof/pe (10.86) was less than the critical
F3,2,95% (19.16), thus emphasizing that the model is significant. Moreover, the regression component explained by 97.83% also corroborates the significance of quadratic model. The ratio between medium quadratic of regression component and re-sidual component (45.05) was also compared to tabled values of F-distribution, whose value was higher than the critical (F5,5,95% = 5.05 - significant regression). Overall the results indicated that the quadratic model was satisfactory as can be observed by equivalent results between experimental response and expected response by quadratic model (Table 6).
Table 4. Design 22 plus central point using Na
2B4O7/HCl as buffer solution
Table 5. Factorial design 22 plus central point plus star using Na
2B4O7/HCl as buffer solution
Levels –1.4142, (-), (0), (+) and 1.4142 are attributed, respectively for pH values of 5.6, 6.0, 7.0, 8.0 and 8.4 and for buffer concentration 0.0018, 0.0100, 0.0300, 0.050 and 0.0582 mol L-1.
Table 6. Validation of the method for cobalt determination in spiked mineral water samples
The Eq.(2) of the quadratic model was following:
(a)
Figure 2. Response surface (a) and contour plot (b) obtained under optimised conditions.
(b)
v = 0,1865 + 0,0241pH - 0,0068BC - 0,0541pH2 - 0,0254BC2 - 0,0104pHBC Eq.(2) The response surface as well as contour plot
This response surface has a maximum, whose coordinate is calculated by solving the system of equation:
δ v / dpH = 0 and δ v/ dBC = 0
The critical point is located at the position given by 8.2 in pH and 9.3 x 10⁻³ mol L-1 in borate buffer concentration.
Analytical features and validation of the cobalt preconcentration method
According to results obtained from linear range, cobalt can be determined in the 0.13 to 10 mg L-1 range whose linear regression was 0.997. As 5.0 mL min-1 sampling flow rate was used in this procedure, 25 mL of sampling volume require a sampling time of 5 min.
The preconcentration factor (PF) was calculated by slope ratio of the calibration curves obtained with and without the preconcentration step. This procedure is the most used to evaluate the sensitivity obtained by insert a preconcentration step previous measures. So, the preconcentration factor obtained in this work was 11.6. Although preconcentration factor is considered the most usual procedure to evaluate the performance of preconcentration system, this concept cannot be used alone because, in general, higher preconcentration factors are obtained when high sample volume preconcentration are employed. In this situation, the sample throughput, which is an important factor on preconcentration system, is not considered. Therefore, as the present preconcentration procedure is accomplished by off-line mode, the sample consumption based on consumptive index (CI) becomes an efficient way to evaluate the performance of preconcentration system [19]. Consumptive index is expressed by volume of analyte solution Vs and the PF ratio (CI = Vs/PF), thus indicating the necessary volume to attain one unit of preconcentration factor. In this way, consumptive index obtained in the present work was 2.15 mL in which is much less than previous works [20-26].
The limits of detection (LOD) as quantification (LOQ) were obtained by means of literature [27], in which was defined, respectively, as the ratio of three and ten times the standard deviation of the blank solution (n=20) by slope of the analytical curve. The respectively LOD and LOQ for cobalt were 38 and 130 ng L-1, respectively.
The precision, calculated as relative standard deviation (RSD) for 9 replicates, was 5.2 and 2.9 % for 0.3 and 3.0 mg L-1, respectively. As an application, the method was employed for cobalt determination in mineral waters. As one can see in Table 6, the cobalt concentration in analysed samples was below to the limit of quantification (130 ng L-1). Thus, the accuracy of the method was carried out from test of addition and recovery, whose results ranging from 94 to 106% makes possible to confirm the accuracy of the method. It is important to emphasize that although cobalt was not directly determined in these samples the limit of quantification of the present method shows that cobalt can be determined in natural water according to common levels (0.1 to 0.5 mg L-1) [2].
Conclusions
Acknowledgements
The authors acknowledge the FAPESP (grant number 01/05614-0) and CAPES for financial support. G. D. M, S. L. C. F and M. A. Z. A are grateful
to CNPq for scholarships. Authors also thank to Prof. Carol H. Collins for language assistance.
Recebido em: 09/11/2004 Aceito em: 21/12/2004
G. D. Matos, C. R.T. Tarley, S. L. C. Ferreira e M. A. Z. Arruda.Uso de planejamento experimental na otimização de um sistema de pré-concentração em fase sólida para a determinação de cobalto por GFAAS
Resumo: No presente trabalho é proposto um sistema de pré-concentração em fase sólida de íons Co2+ com
posterior determinação por GFAAS, cuja otimização das variáveis associadas ao desempenho do sistema de pré-concentração foi realizada por planejamento fatorial fracionário e metodologia de superfície de respos-ta (MSR). O método é baseado na extração de cobalto como um complexo Co2+-PAN (1:2) em uma mini-coluna de espuma de poliuretano (EPU) impregnada com 1-(2-piridilazo)-naftol (PAN) seguido pela eluição com solução de HCl e determinação por GFAAS. As variáveis químicas e de fluxo estudadas foram pH, concentração do tampão, concentração do eluente e vazões de pré-concentração e eluição. Os resultados obtidos a partir do planejamento fatorial fracionário 25-1 mostraram, com base na análise de variância (ANOVA), que apenas as variáveis pH, concentração do tampão e a interação (pH X concentração do tampão) foram estatisticamente significativas com nível de 95% de confiança. Nas condições otimizadas, o método forneceu um fator de enriquecimento de 11,6 vezes com respectivos limites de detecção e quantificação de 38 e 130 ng L-1 e faixa linear variando de 0,13 a 10 mg L-1. A precisão (n=9) avaliada em termos de desvio padrão relativo (DPR) foi respectivamente de 5,18 e 2,87% para concentrações de cobalto de 0,3 e 3,0 mg L-1.
Palavras-chave: Planejamento Experimental; sistema de pré-concentração; espuma de poliuretano; cobalto.
References
[1] C. C. Nascentes, M. A. Z. Arruda, Talanta 61 (2003) 759.
[2] T. Braun, M. N. Abbas, Anal. Chim. Acta 119 (1980) 113.
[3] S. L. C. Ferreira, H. C. dos Santos, R. C. Campos, Talanta 61 (2003) 789.
[4] M. Hiraide, Z. S. Chen, H. Kawaguchi, Talanta 43 (1996) 1131.
[5] X. P. Yan, W. VanMol, F. Adams, Lab. Robotics Automat. 9 (1997) 191.
[6] V. A. Lemos, R. E. Santelli, M. S. Carvalho, S. L. C. Ferreira, Spectrochim. Acta Part B 55 (2000) 1497. [7] J. M. Bosque Sendra, M. Nechar, M. F. Molina, Microchim. Acta 134 (2000) 43.
[8] T. Lundstedt, E. Seifert, L. Abramo, B. Thelin, A. Nystrom, J. Pettersen, R. Bergman, Chemo. Intell. Lab. Syst 42 (1998) 3. [9] P. W. Araujo, R. G. Brereton, Trends Anal. Chem. 15 (1996) 26.
[10] P. W. Araujo, R. G. Brereton, Trends Anal. Chem.15 (1996) 63.
[11] E. R. Pereira-Filho, R. J. Poppi, M. A. Z. Arruda, Quim. Nova 25 (2002) 246.
[12] M. Nechar, M. F. Molina, J. M. Bosque-Sendra, Anal. Chim. Acta 382 (1999) 117.
[13] S. L. C. Ferreira, A. S. Queiroz, M. S. Fernandes, H. C. Santos, Spectrochim. Acta Part B 57 (2002) 1939.
[14] C. Huang, Y. Su, Y. Hsieh, J. Chromatography A 977 (2002) 9.
[15] F. Lazaro, M. D. Luque de Castro, M. Valcarcel, Anal. Chim. Acta 214 (1998) 217.
[16] S. L. C. Ferreira, A. F. Dantas, N. M. L. Araújo, A. C. S. Costa, Talanta 48 (1999)1173.
[17] I. Narin, M. Soylak, Talanta 60 (2003) 215.
[18] S. L. C. Ferreira, D. S. De Jesus, R. J. Cassella, A. C. S. Costa, M. S. Carvalho, R. E. Santelli, Anal. Chim. Acta 378 (1999) 287.
[19] E. N. V. M. Carrilho, J. A. Nóbrega, T. Gilbert, Talanta 60 (2003) 1131.
[20] A. Alexandrova, S. Arpadjan, Analyst 118 (1993) 1309. [21] M. Kumar, D. P. S. Rathore, A. K. Singh, Analyst 125 (2000) 1221.
[22] M. Kumar, D. P. S. Rathore, A. K. Kingh, Fresenius J. Anal. Chem.370 (2001) 377.
[23] G. Chakrapani, D. S. R. Murty, P. L. Mohanta, R. Rangaswamy, J. Geochem. Explor.63 (1998) 145. [24] M. Kumar, D. P. S. Rathore, A. K. Singh, Microchem. Acta 137 (2001) 127.
[25] A. Ramesh, K. R. Mohan, K. Seshaiah, N. D. Jeyakumar, Anal. Lett. 34 (2001) 219.
[26] D. Atanasova, V. Stefanova, E. Russeva, Talanta 45 (1998) 857.