Article
J. Braz. Chem. Soc., Vol. 24, No. 11, 1808-1817, 2013. Printed in Brazil - ©2013 Sociedade Brasileira de Química 0103 - 5053 $6.00+0.00
A
*e-mail: [email protected], [email protected]
Spectrophotometric Determination of Trace Amounts of Uranium(VI)
using Modified Magnetic Iron Oxide Nanoparticles in
Environmental and Biological Samples
Gholamreza Khayatian,*Shahed Hassanpoor, Amir R. J. Azar and
Sajjad Mohebbi
Department of Chemistry, Faculty of Science, University of Kurdistan, Sanandaj, Islamic Republic of Iran
Um método de extração de fase sólida baseado em nanopartículas magnéticas de óxido de ferro (MIONPs) modificadas por dodecyl sulfato de sódio (SDS) foi desenvolvido para a preconcentração e a determinação de traços de íons urânio (VI). Oxina (8-quinolinol) foi usada como agente quelante e os fatores que afetam a formação do complexo e a extração de urânio foram otimizados. Etanol contendo 1% (v v-1) NH3 foi usado como desorvente e a absorvância
do eluente foi medida em 370 nm por espectrofotometria UV-Vis. A curva analítica foi linear na faixa de 3,0-300 µg L-1 com um limite de detecção de 0,8 µg L-1. O método foi aplicado com
sucesso para a determinação de urânio em água de torneira, água mineral, água de rio e amostras de água de mar com recuperações variando de 93-108%. Este método também foi aplicado para a determinação de urânio (VI) em amostras de rocha e amostras biológicas e os resultados obtidos concordaram com aqueles obtidos por ICP-MS e GF AAS.
A solid phase extraction method based on magnetic iron oxide nanoparticles (MIONPs) modified by sodium dodecyl sulfate (SDS) was developed for the preconcentration and determination of trace amounts of uranium(VI) ions. Oxine (8-quinolinol) was used as chelating agent and the factors influencing the complex formation and extraction of uranium were optimized. Ethanol containing 1% (v v−1) NH
3 was used as desorbing agent and the absorbance of eluent was
measured at 370 nm by UV-Vis spectrophotometry. The analytical curve was linear in the range of 3.0-300 µg L−1 with a limit of detection of 0.8 µg L−1. The method was successfully applied
for the determination of uranium in tap water, mineral water, river water and sea water samples with spike recoveries ranging 93-108%. This method was also applied for the determination of uranium(VI) in rock and biological samples and the obtained results were in accordance with inductively coupled plasma mass spectrometry (ICP-MS) and graphite furnace atomic absorption spectrometry (GF AAS) methods.
Keywords: magnetic iron oxide nanoparticle, preconcentration, uranium(VI), oxine, spectrophotometric determination
Introduction
Recognition of the uranyl ion (UO22+) is a long-standing
goal for purposes of environmental remediation, metallurgical extraction and water purification. Uranium is found in a variety of sources, both terrestrial and aqueous. The uranium present in aqueous environments exists naturally or as a contaminant.1 It exists commonly in
aqueous solutions in the form of its oxide ion, uranyl (UO22+),
which exhibits high stability in natural environments such as sea water.2 However, uranium and its compounds are
highly toxic and lead to kidney failure or even death, and occurs naturally in most rocks in concentrations of 2-4 µg kg−1, and in much lower concentrations, in surface
(0.03-2.1 µg L−1) and ground water (0.003-2.0 µg L−1).
In sea water, the concentration is about 3.0 µg L−1.3,4 The
Various analytical methods, such as, inductively c o u p l e d p l a s m a ,5 - 9 l a s e r f l u o r i m e t r y,1 0 ga m m a
spectrometry,11 neutron activation analysis12 and alpha
spectrometry13 have been used for the determination of
trace amounts of uranium. Although these methods have good sensitivity and fast measurements capabilities, they require sophisticated, expensive instruments and sometimes problem of unsuitable matrix occurs. Furthermore, the low cost techniques (such as UV-Vis spectrophotometry) cannot be used successfully without prior chemical separations due to spectral interference of rare earths and transition elements. These problems can be overcome by applying a cleanup and/or preconcentration step prior to determination. Many preconcentration techniques for uranium have been developed including solid phase extraction(SPE),14-17
cloud point extraction9,18 and liquid liquid extraction.19-21
Solid phase extraction is one of the most effective preconcentration techniques that reduce solvent usage and exposure, disposal cost and extraction time for sample preparation.4 Today, nanomagnetic particles are new
solid materials that have attracted to SPE methods due to their special properties such as excellent magnetic responsivity, high dispersibility, large surface to volume ratio and easiness of surface modification.4,22 In iron oxide
nanoparticles, the surface charge depends on pH of the solution and that may be positive or negative. Therefore, the adsorption of cationic and/or anionic surfactants on the surface of magnetic nanoparticles depends on this surface charge.23,24 In this case, the nanoparticles act as a sorbent
while the adsorbed ionic surfactants are responsible for the extraction of target analytes from the sample matrix.25
In this work, we describe a preconcentration and determination procedure for the U(VI) ions using modified magnetic iron oxide nanoparticles (MIONPs) with sodium dodecyl sulfate (SDS). Extraction of U(VI) is based on the adsorption of UO22+-oxine complex on the SDS coated
Fe3O4. The desorption of analyte is achieved by ethanol
containing 1% (v v−1) NH
3 solution and the absorbance of
the preconcentrated solution was determined by UV-Vis spectrophotometric method in maximum absorbance of complex at 370 nm.
Experimental
Instrumentation
The spectra were recorded using a double beam UV-Vis spectrophotometer (Model SPECORD 250, Germany) and data collection were done by a single beam Jenway spectrophotometer (Model 6320D, England). A quartz
cell with a 1 cm path length was used for the absorbance measurements of the uranium-oxine complexes. Atomic absorption measurements were performed on a Varian Spectr AA 220 graphite furnace atomic absorption spectrometer (GF AAS). A uranium hollow cathode lamp was used at 358.5 nm wavelength with a spectral width of 0.2 nm for U(VI) determination. The pyrolysis temperature of 1000 °C and the atomization temperature of 2700 °C and argon gas purge were used.8 All pH measurements were
made using a Metrohm E-691 digital pH meter with a combined glass electrode. A super magnet (Nd-Fe-B, 1.2 T, 50 × 40 × 20 mm) was used for phase separation. Stirring
of the sample solutions was carried out by a magnetic stirrer (Rodwell, Monostir, England). A scanning electron microscopy (SEM, Hitachi S-4160, Japan) was used for preparation of SEM images. Fourier transform infrared spectra (FTIR) were performed using KBr disc on an infrared spectrometer (Bruker-Vector 22). The magnetic property was measured using the alternating gradient-force magnetometer (AGFM) (Meghnatis Daghigh Kavir Co, Iran).
Reagents and solutions
Nitric acid, ammonium hydroxide, acetic acid, sodium hydroxide, ethanol, methanol, acetonitrile, FeCl3·6H2O (99%) and FeCl2·4H2O (99%) from Merck
(Darmstadt, Germany) were used as received. The stock solution (1000 mg L−1) of uranium(VI) was prepared
by dissolving appropriate amount of uranyl acetate dehydrate UO2(CH3COO)2.2H2O (99.5%, Merck,
Darmstadt, Germany) in deionized water. Concentrated HNO3 (5.0 mL, 65%) was added to 100 mL of the
solution to suppress hydrolysis.26 Working solutions were
prepared from the stock solution by serial dilutions with deionized water. A 1.0 mg mL-1 solution of oxine (≥ 99%,
Merck, Darmstadt, Germany) in ethanol was prepared as complexing agent and SDS (4.0 mg mL-1) solution
was prepared by dissolving appropriate amounts of SDS (99.5%, Merck, Darmstadt, Germany) in deionized water. 100 mL dispersion of MIONPs (1.0 mg mL−1) in water was
prepared with ultrasonic treatment. Acetate buffer solution (1000 mL, 0.1 mol L−1, pH 5.0) was prepared by addition
of appropriate amount of sodium hydroxide (1.0 mol L−1)
to 800 mL of acetic acid solution (0.125 mol L−1) and the
Preparation of magnetic iron oxide nanoparticle
Fe3O4 nanoparticles were prepared by chemical
coprecipitation of Fe3+ and Fe2+ ions with 2:1 molar
ratio.27 Typically, FeCl
3·6H2O (5.838 g, 21.6 mmol) and
FeCl2·4H2O (2.147 g, 10.8 mmol) were dissolved in
100 mL deionized water at 85 °C under N2 atmosphere and
vigorous mechanical stirring (500 rpm). Then, 10 mL of 25% (v v−1) NH
3 were quickly added into the reaction
mixture in one portion. The addition of the base to the Fe2+/Fe3+ salt solution immediately resulted in the
formation of the black precipitate of MIONPs. The reaction continued for another 25 min and the mixture was cooled to room temperature and then centrifuged. For removing excess amounts of ammonium hydroxide, the black precipitate was washed with doubly distilled water and 20.0 mmol L−1 NaCl solution and then decanted. The
prepared Fe3O4 was washed again and centrifuged and
refrigerated for further use.
Preparation of environmental waters
The sea water from Caspian Sea (Rudsar, Iran), river water from Sepid Rood (Astaneh ashrafieh, Iran), mineral waters (Kooh Rang and Kimia, Iran) and drinking water (Sanandaj, Iran) were collected in polyethylene bottles. The samples were acidified to the pH ca. 1 using concentrated HNO3 and were filtered by a filter paper to remove
suspended particular solids in the case of the sea and river water samples. Then, all samples were stored at ca. 4 °C in the refrigerator. Appropriate volume of these samples was transferred to a beaker and covered with watch glass and heated to boil for 20 min to eliminate carbonate and bicarbonate ions according to previously reported method.28
After adjusting the pH and addition of hydroxyl amine hydrochloride (1.0 × 10⁻³ mol L−1), analysis was done as
general procedure.
Preparation of rock samples
The granite rock samples (Zagros Orogen, North West Iran) were digested according to previously reported methods:29,30 0.1 g of powdered rock was weighed in a
100 mL teflon beaker and 4.0 mL HNO3 (65%), 3.0 mL
HClO4 (70%) and 5.0 mL HF (40%) were added. The
reagents were mixed well, and after 30 min, the beaker was covered and heated at ca. 160 °C for one day, followed by evaporation to dryness at ca. 140 °C for 2-3 days. The residue was dissolved with 10 mL (1 + 1) HCl by heating and diluted to 50 mL. The analysis was performed as mentioned previously after diluting the solution
1000 times, adjusting pH and addition of 1.0 × 10⁻³ mol L−1
hydroxyl amine hydrochloride.
Preparation of biological samples
The biological samples were digested according to previously reported method:31 20.0 mL of each samples
(urine or blood serum) were initially dried in an oven at 120 °C for 24 h. Blood serum samples were further dried in an oven at 200 °C for an additional 24 h. Then, the biological samples were dry-ashed in a muffle furnace at 300 °C for 24 h, then at 450 °C for 4 h. After dry-ashing, samples were wet-ashed with 2 mL concentrated nitric acid and 0.5 mL of 30% hydrogen peroxide. The mixture was heated to just below boiling until complete evaporation. The samples were cooled and wet-ashed three more times in the same manner. At completion, the white residue was dissolved with 20 mL of 1 mol L-1 HNO
3 by heating and diluted to
25.0 mL for analysis. After adjusting pH and addition of hydroxyl amine hydrochloride (1.0 × 10⁻³ mol L−1), analysis
was done as general procedure.
General procedure
A 100 mL aliquot of 100 µg L−1 U(VI) or appropriate
volume of real sample (25- 275 mL) was placed in a 200 mL beaker, and then, 10 mL of 0.1 mol L-1 acetate buffer,
11.0 mg of MIONPs (equal 11.0 mL of adsorbent dispersion solution), 8.0 mg of SDS (corresponding to 2.0 mL of SDS solution) and 1.0 mL of oxine were added. The beaker was put on the stirrer for 15 min. Afterwards, the nanoparticles were collected using a strong magnet for about 5 min until the brown solution became colorless. Then, the clear solution was decanted. For desorption of adsorbed uranium ions from the nanoparticles, the residual nanoparticles were rinsed with 5 mL ethanol containing 1% (v v−1) NH
3
solution for 10 min on the stirrer. Then, the mixture was decanted and the absorbance of the solution was measured in a 1 cm quartz cell against a blank at 370 nm by UV-Vis spectrophotometer. The blank solution was run under the same condition as well.
Results and Discussion
uranium(VI)-oxine complex, uranium(VI), uranium(VI)-oxine and SDS against reagent blank as the reference. The results indicate that maximum absorbance of uranium(VI)-oxine complex occurs at 370 nm, thus 370 nm was chosen for colorimetric determination of uranium(VI) ions.
Characterization of MIONPs
MIONPs were characterized by SEM and AGFM techniques (Figures 2 and 3). The average size of these nanoparticles is about 14 nm as shown in Figure 2a and the aggregation of the nanoparticles can be discerned clearly in Figure 2b. Superparamagnetism and high saturation magnetization are necessary for magnetic separation. The AGFM curve of MIONPs shows narrow hysteresis loop and remanences, indicating their superparamagnetic
property and high saturation magnetization as shown in Figure 3a. The main steps for extraction of U(VI) are shown in Figures 3b and 3c.
Figure 4 shows the FTIR spectra of Fe3O4
nanoparticles and Fe3O4 nanoparticles after magnetic
separation. In FTIR spectrum of Fe3O4 nanoparticles
(Figure 4a), the observation of two broad bands at the region between 430 until 548 cm−1 are assigned to the
vibration of the Fe−O bond and indicates the presence
of Fe3O4-magnetic nanoparticles. The broad band at
3419 cm−1 was due to OH stretching, which corresponds
to hydroxyl groups attached to the iron oxide surface, also the water molecules chemically adsorbed onto the magnetic particle surface.27 In IR spectrum of Fe
3O4 (after magnetic
separation, Figure 4b), absorption peaks at 3415, 2919, 2850, 1223 and 1087 cm−1 are due to SDS and oxine IR
peaks at 1621, 1383, 1065 and 631 cm-1. Consequently,
these FTIR absorption bands demonstrate that SDS and oxine-U(VI) complex attached to Fe3O4 nanoparticles.
Effect of pH
The charge density of iron oxide nanoparticle surface is a main factor affecting the extraction of analytes and it strongly varies by pH. MIONPs quickly oxidize when pH is below 4.0.32 So, the effect of pH on the complex
formation and extraction of uranium(VI) from 100 mL of 100 µg L−1 aqueous sample was studied at the pH range of
4.0-10.0. The pH values were adjusted either by nitric acid or sodium hydroxide solution. The experimental results in Figure 5 show that in acidic media, the absorbance increases by increasing pH to a maximum at pH 5.0, and then, decreases in alkaline medium and reaches to the lowest amount at pH 10. The decrease in absorbance in acidic media is due to unfavorable complex formation Figure 1. Absorption spectra of (a) 2.0 mg L-1 uranium(VI) in water,
(b) uranium(VI) complex after extraction in ethanol containing 1% (v v−1) NH3, (c) 2.3 × 10⁻⁴ mol L-1 oxine in ethanol containing 1% (v v−1) NH
3, and (d) 4.6 × 10⁻⁴ mol L-1 SDS in ethanol containing 1% (v v−1) NH
3.
Figure 2. SEM images of MIONPs.
between quinoline-8-ol with uranium(VI) and the decrease in absorbance in alkaline media is due to formation of negative charges on the surface of MIONPs which give rise to the strong electrostatic repulsion between the SDS molecules and the nanoparticles. Therefore, a pH 5.0 was chosen for subsequent experiments and the pH adjustment was carried out using 10.0 mL of 0.1 mol L-1 acetate buffer
for 100 mL sample solution.
Effect of amount of oxine
The effect of amount of the oxine on the extraction efficiency of 100 mL of 100 µg L−1 uranium(VI) solution
was also studied using various amounts of ligand (1.0 mg mL−1), ranging from 0.0 to 1.5 mg (Figure 6). The
results reveal that absorbance increases with increasing of the oxine amount from 0.0 to 0.9 mg, beyond 0.9 mg, the absorbance remains constant, indicating complete complexation and extraction of uranium(VI) ions from
sample solution. Therefore, 1.0 mg of oxine was chosen as the optimum amount of ligand for subsequent experiments.
Effect of amount of MIONPs
The optimum amount of sorbent is obtained by investigating different amounts of MIONPs, ranging from 0.0 to 15.0 mg. The results are shown in Figure 7, and as can be seen, the absorbance increased with increasing of the MIONP amount to 10.0 mg, and then, remained constant when the sorbent amount was continuously increased. Hence, 11.0 mg were chosen for further experiments.
Effect of SDS amount
The concentration of surfactant in modified magnetic nanomaterial is very important because its addition under Figure 4. FTIR spectra of (a) Fe3O4 nanoparticles before magnetic separation and (b) Fe3O4 nanoparticles after magnetic separation.
Figure 5. Effect of pH on the absorbance of uranium(VI). Conditions: water sample volume, 100 mL; concentration of uranium(VI), 100 µg L−1; 1.0 mg oxine; 11.0 mg MIONPs; 8.0 mg SDS; extraction time, 15 min; desorbing solution, 5 mL ethanol containing 1% (v v−1) NH
3; n = 3.
Figure 6. Effect of amount of oxine on the absorbance of uranium(VI). Conditions: water sample volume, 100 mL; concentration of uranium(VI), 100 µg L−1; 10 mL of 0.1 mol L-1 acetate buffer (pH 5); 11.0 mg MIONPs; 8.0 mg SDS; extraction time, 15 min; desorbing solution, 5 mL ethanol containing 1% (v v−1) NH
optimum condition forms a mixed hemimicelle on the surface of the MINOPs.33 At acidic pH, the positive surface
of MIONPs and the negative head group of SDS, interact with each other to form a double layer on the surface of the nanoparticles34 and the neutral35 oxine-uranium(VI)
complex can be extracted to the hydrocarbonic tail of SDS by hydrophobic forces.
The effect of SDS amounts on the absorbance of uranium was investigated by the injection of different amounts of this surfactant into 100 mL of 100 µg L−1
uranium(VI) solution in the range of 0.0-15.0 mg (Figure 7). As can be seen, the absorbance was increased with increasing of the amount of SDS up to 7.5 mg and then was constant at the higher amount of SDS. Therefore, 8.0 mg of SDS (equal 2.0 mL of 4.0 mg mL-1
of SDS solution) were used as the optimum amount of surfactant.
Effect of extraction time
Extraction time is the interval time between the injection of all reagents (MIONPs, SDS, oxine and buffer) to the 100 mL of 100 µg L−1 uranium(VI) solution and the
starting time of the phase separation. Thus, the effect of extraction time on the absorbance of uranium was examined in the range of 0-25 min while the other parameters were kept constant. It was found that quantitative recovery and maximum absorbance could be obtained after 12 min. Hence, a time of 15 min was chosen for further experiments as the extraction time.
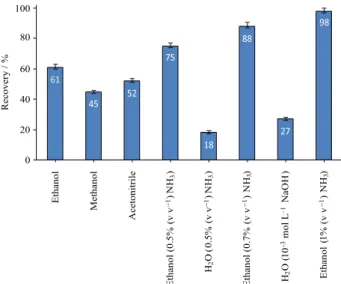
Desorption condition
In order to choose a proper desorbing reagent for recovery of uranium(VI), various reagents were added
to MIONPs (Figure 8). For quantitative recovery, the desorbing reagent was added into the beaker containing MIONPs-SDS-oxine-uranium and the beaker was placed on the stirrer for 10 min. Among the different reagents, 5.0 mL ethanol containing 1% (v v−1) NH
3 provides higher recovery.
The higher efficiency of this mixture for the desorbing of uranium(VI) may be due to the interaction of alkalized organic solvent with MIONP surfaces. With addition of this reagent, negative charges produce on the surface of MIONPs and repulsion force occur between the negative head groups of the surfactant and surface of MIONPs. Thus, ethanol (5.0 mL) containing 1% (v v−1) NH
3 was selected
as eluent.
Effect of salt
For studying the influence of salt on the efficiency of the extraction of uranium(VI), various experiments were performed by adding NaCl in the range of 0.00 to 0.08 mol L−1 (Figure 9). The results showed that
the addition of salt did not influence on the extraction efficiency of uranium(VI). The hydrophobic interaction between hydrocarbonic groups of SDS and neutral complexes could be enhanced by increased ionic strength of the solution (salting out effect). On the other hand, high ionic strength (effect of Cl− anion) may also weaken the electrostatic attraction between the positive groups on the MIONP surface and the anionic head of SDS (salting in effect).36 These two opposite phenomena can cancel the
effect of each other. Therefore, no salt was added in the subsequent experiments.
Figure 7. Effect of amount of MIONPs and SDS on the absorbance of uranium. Conditions: water sample volume, 100 mL; concentration of uranium(VI), 100 ng mL−1; 10 mL of 0.1 mol L-1 acetate buffer (pH 5); 1.0 mg oxine; extraction time, 15 min; desorbing solution, 5 mL ethanol containing 1% (v v−1) NH
3; n = 3.
Effect of the sample volume and estimation of preconcentration factor
In order to investigate the breakthrough volume, sample solutions of 25, 50, 100, 150, 200, 250, 275, 300 and 350 mL containing 10.0 µg of uranium(VI) were studied according to the recommended procedure. It was found that uranium could be quantitatively recovered up to 275 mL of the sample volume. Thus, the preconcentration factor of the method was calculated to be 55.
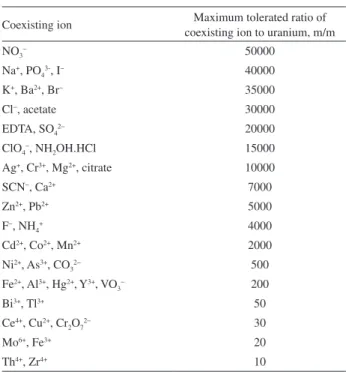
Effect of diverse ions
The effects of common potentially interfering ions and some masking agents on the recovery of uranium(VI) were also studied. In these experiments, 100 mL of solutions containing uranium(VI) (100 µg L-1) and various amounts
of diverse ions were treated according to the recommended procedure. A given species was considered to interfere if it resulted in a ± 5% variation of the absorbance signal. The results are given in Table 1. As can be seen, the majority of the investigated ions have no significant influence on the extraction of uranium(VI) under the selected conditions. However, some of the species, such as Ce4+, Cu2+, Cr
2O7 2−,
Mo6+, Fe3+ and especially Th4+ and Zr4+ in the ratio of < 50,
interfered with the determination of uranium(VI). These interferences were eliminated in the presence of appropriate masking agents such as F−, EDTA, SCN− and NH
2OH.HCl
(Table 2).
Reusability of MIONPs and loading capacity
The reusability of MIONPs in several successive adsorption and desorption processes was studied. The obtained results showed that the nanoparticles could be
reused for fifteen times without any considerable loss in their adsorption efficiency and magnetic property. The maximum loading capacity of the sorbent was obtained from the injection of 11.0 mg of MIONPs to 100 mL of 5.0 mg L−1 uranium(VI) solution and the determination
of uranium in eluent according to the recommended procedure. The loading capacity was 6.7 mg g−1.
Analytical figures of merit
The analytical characteristics of the method, including linear range, limits of detection and of quantification, relative standard deviation (RSD), correlation coefficient Figure 9. Effect of salt on the recovery of uranium. Conditions: water
sample volume, 100 mL; Concentration of uranium(VI), 100 µg L−1; 10 mL of 0.1 mol L-1 acetate buffer (pH 5); 1.0 mg oxine; 11.0 mg MIONPs; 8.0 mg SDS; extraction time, 15 min; desorbing solution, 5 mL ethanol containing 1% (v v−1) NH
3; n = 3.
Table 1. Effect of coexisting ions on the extraction of 100 µg L−1 uranium(VI)
Coexisting ion Maximum tolerated ratio of coexisting ion to uranium, m/m
NO3− 50000
Na+, PO 43-, I
− 40000
K+, Ba2+, Br− 35000
Cl−, acetate 30000
EDTA, SO42− 20000
ClO4−, NH2OH.HCl 15000
Ag+, Cr3+, Mg2+, citrate 10000
SCN−, Ca2+ 7000
Zn2+, Pb2+ 5000
F−, NH
4+ 4000
Cd2+, Co2+, Mn2+ 2000
Ni2+, As3+, CO 32
− 500
Fe2+, Al3+, Hg2+, Y3+, VO
3− 200
Bi3+, Tl3+ 50
Ce4+, Cu2+, Cr
2O72− 30
Mo6+, Fe3+ 20
Th4+, Zr4+ 10
Table 2. Influence of masking agents on the errors produced by interfering ions
Interference (ratio to
uranium, m/m) Masking agent / (mol L
−1) Error / %
Th4+ (50) F− (1.0 × 10⁻²) −4 EDTA (1.0 × 10⁻³) +3
Zr4+ (50) EDTA (1.0 × 10⁻³) +1
Mo6+ (50) NH
2OH.HCl (1.0 × 10
−3) −3
Fe3+ (50) NH
2OH.HCl (1.0 × 10⁻³) −2
(40) EDTA (1.0 × 10⁻³) +4
Ce4+ (50) NH
2OH.HCl (1.0 × 10
−3) −4
Cu2+ (50) SCN− (5.0 × 10⁻³) −5 Cr2O72− (50) NH
2OH.HCl (1.0 × 10
(R2) and preconcentration factor were obtained. Under the
optimum experimental conditions, analytical curve was achieved by analyzing 100 mL of uranium(VI) standard solution containing a known amount of target ion in the range of 1.0-400 µg L−1. The analytical curve was linear
in the range of 3.0-300 µg L−1 with R2 of 0.999. The
regression equation was A = 1.470 C − 0.002, where A is
the absorbance and C is the concentration of uranium(VI) in mg L−1. The limit of detection (n = 10, LOD = 3σ
blank/m) and
limit of quantification (n = 10, LOQ = 10σblank/m), where
m is the slope of the analytical curve in accordance with IUPAC recommendation, was 0.8 and 2.7 µg L−1,
respectively.
RSD of the method for ten replicate measurements of 100 mL of 100 µg L−1 U(VI) solution was 2.1%.
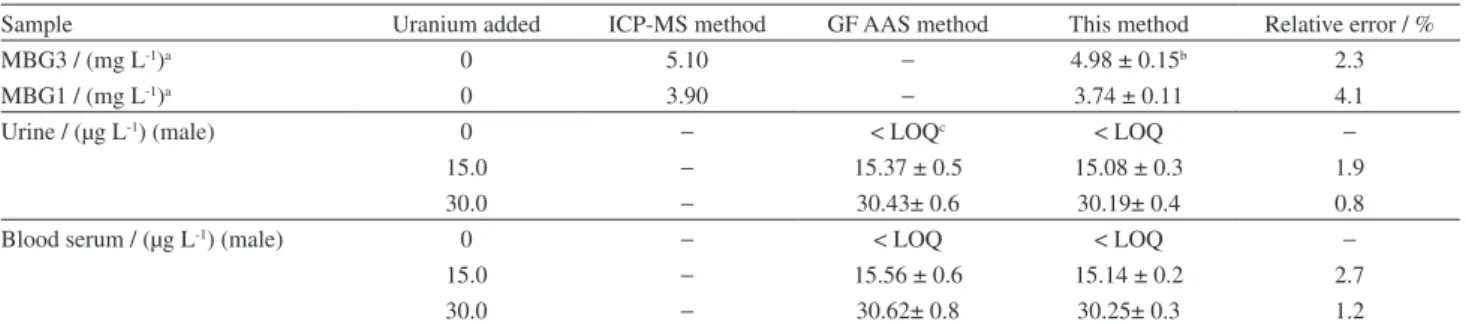
Applications
The recommended method was successfully applied for the determination of uranium(VI) in different natural waters, granite rocks, urine and blood serum samples. Analytical results for natural water samples were given in Table 3. The results for granite rocks, urine and blood serum samples and ICP-MS method values for the rock samples37 and GF AAS method for biological
samples were given in Table 4. As can be seen, the added uranium in water samples was quantitatively recovered from all water samples and the obtained results for the rock and biological samples show good agreement with ICP-MS and GF AAS values. Thus, the present study introduces a simple and low cost instrumental method like UV-Vis spectrophotometer to analysis of environmental and biological samples containing trace amounts of uranium(VI).
Conclusion
In this study, magnetic iron oxide nanoparticles were successfully synthesized and modified by coating an
anionic surfactant, and used for the preconcentration of uranium(VI) from environmental samples. The use of surfactant in this method offers several advantages including experimental convenience and safety. The described procedure gives a good preconcentration factor, wide linear dynamic range and a simple, sensitive and low cost spectrophotometric method for the determination of uranium(VI). A comparison between the present method and previously reported methods (Table 5) indicates that most of the spectrophotometric methods suffer the Table 3. Application of the method for analysis of natural waters (n = 3)
Sample Uranium added / (µg L-1)
Uranium determined /
(µg L-1)
Recovery / %
Tap water (Sanandaj)
0 < LOQa −
5.0 4.9 ± 0.1b 98
15.0 14.8 ± 0.1 99
30.0 29.1 ± 0.2 97
Mineral water (Kooh Rang)
0 < LOQ −
5.0 4.8 ± 0.1 96
15.0 15.1 ± 0.1 101
30.0 29.7 ± 0.3 99
Mineral water (Kimia)
0 < LOQ −
5.0 5.1 ± 0.1 102
15.0 14.7 ± 0.1 98
30.0 30.6 ± 0.4 102
River water (Sepid Rood)
0 < LOQ −
5.0 5.4 ± 0.1 108
15.0 15.9 ± 0.3 106
30.0 30.8 ± 0.5 103
Sea water (Caspian Sea)
0 3.1 ± 0.1 −
5.0 7.8 ± 0.2 96
15.0 17.3 ± 0.3 96
30.0 31.1 ± 0.4 94
aBelow limit of quantification; bmean ± standard deviation.
Table 4. The application of present method for analysis of rock and biological samples (n = 3)
Sample Uranium added ICP-MS method GF AAS method This method Relative error / %
MBG3 / (mg L-1)a 0 5.10 − 4.98 ± 0.15b 2.3
MBG1 / (mg L-1)a 0 3.90 − 3.74 ± 0.11 4.1
Urine / (µg L-1) (male) 0 − < LOQc < LOQ −
15.0 − 15.37 ± 0.5 15.08 ± 0.3 1.9
30.0 − 30.43± 0.6 30.19± 0.4 0.8
Blood serum / (µg L-1) (male) 0 − < LOQ < LOQ −
15.0 − 15.56 ± 0.6 15.14 ± 0.2 2.7
30.0 − 30.62± 0.8 30.25± 0.3 1.2
inconvenience of using another complexing agent14,15,39 for
the detection of uranium(VI) after the extraction process, but in the present method, the uranium(VI) was determined with very good limit of detection and high accuracy without the addition of another chromophore agent.
Acknowledgment
We greatly appreciate from Dr. Hossein Azizi, Mining Department, Faculty of Engineering, University of Kurdistan, Sanandaj, Iran, for collection and sampling of granite rocks, from North West of Iran.
References
1. Sather, A. C.; Berryman, O. B.; Rebek,J.; J. Am. Chem. Soc. 2010, 132, 13572.
2. Sayin, S.; Yilmaz, M.; Desalination2011, 276, 328.
3. Dimovasilis, P. A.; Prodromidis, M. I.; Sens. Actuator, B 2011,
156, 689.
4. Sadeghi, S.; Azhdari, H.; Arabi, H.; Moghaddam, A. Z.;
J. Hazard. Mater. 2012, 215, 208.
5. Jamali, M. R.; Assadi, Y.; Shemirani, F.; Hosseini, M. R. M.; Kozani, R. R.; Masteri-Farahani, M.; Salavati-Niasari, M.; Anal. Chim. Acta2006, 579, 68.
6. Jain,V. K.; Handa, A.; Sait, S. S.; Shrivastava, P.; Agrawal, Y. K.;
Anal. Chim. Acta2001, 429, 237.
7. Bahramifar, N.; Yamini, Y.; Anal. Chim. Acta2005, 540, 325. 8. Jain, V. K.; Pandya, R. A.; Pillai, S. G.; Shrivastav, P. S.; Talanta
2006, 70, 257.
9. Shariati, S.; Yamini, Y.; Zanjani, M. K.; J. Hazard. Mater.2008,
156, 583.
10. Rathore, D. P. S.; Talanta2008, 77, 9.
11. Sundar, U.; Ramamurthy, V.; Buche, V.; Raoa, D. N.; Sivadasan, P. C.; Yadav, R. B.; Talanta2007, 73, 476.
12. Shinotsuka, K.; Ebihara, M.; Anal. Chim. Acta1997, 338, 237. 13. Benedik, L.; Vasile, M.; Spasova, Y.; Wätjen, U.; Appl. Radiat.
Isot.2009, 67, 770.
14. Shamsipour, M.; Ghiasvand, A. R.; Yamini, Y.; Anal. Chem.
1999, 71, 4892.
15. Starvin, A. M.; Rao, T. P.; Talanta2004, 63, 225.
16. Metilda, P.; Gladis, J. M.; Rao, T. P.; Anal. Chim. Acta2004,
512, 63.
17. Oguma, K.; Suzuki, T.; Saito, K.; Talanta2011, 84, 1209. 18. Madrakian, T.; Afkhami, A.; Mousavi, A.; Talanta2007, 71,
610.
19. Jain, V. K.; Pillai, S. G.; Pandya, R. A.; Agrawal, Y. K.; Shrivastav, P. S.; Talanta2005, 65, 466.
20. Takahashi, A.; Ueki, Y.; Igarash, S.; Anal. Chim. Acta1999,
387, 71.
Table 5. A survey of preconcentration procedures developed for determination of uranium(VI)
Analytical technique
LOD / (µg L-1)
LDR / (µg L-1) Pfa
Sample
volume / mL RSD / % Chelating agent
Sorbent, solvent or
micellar media Reference
SPE-UV-Vis 4.6 68-6750 − 100 3.2 arsenazo III quercetin modified MIONPs 4
SPE-ICP OES 0.5 2-1000 100 100 2.5 salicylaldimino mesoporous silica 5
SPE-ICP AES, GF AAS, UV-Vis
100 − 120 1000 − OVSC & arsenazo-I and III Amberlite XAD-4 6 SPE-ICP OES,
GF AAS
6.14 100-15000 143 100 1.7 calix[4]arene CMPDB resin 8
CPE-ICP OES 1 2.5-1240 37 50 6.1 dibenzoylmethan Triton X-114 9
SPE-UV-Vis 0.1 − > 20 50 1.5 TOPO& dibenzoylmethane ODS disk 14
SPE-UV-Vis 5 5-200 100 100 2.52 diarylazobisphenol& arsenazo III
activated carbon 15
SPE-UV-Vis 5 5- 250 100 1000 2.5 5,7-dichloroquinoline-8-ol ion imprinted polymer 16
CPE-UV-Vis 0.06 0.2-10 14.3 10 3 pyrocatechol violet CTAB& Triton X-114 18
LLE-UV-Vis, GF AAS
2.87 75-6000 142 20 2.1 C4RAHA ethyl acetate 19
SPE-ICP OES 0.24 1.0–5000 1000 1000 1.5 salicylaldehyde modified magnetic nanoparticles
38
LLE-UV-Vis 2.5 2.5-250 − 20 < 2 PC88A, TOPO, Br-PADAP cyclohexane 39
SPE-UV-Vis 0.8 3-300 55 100 2.1 8-quinolinol SDS modified MIONPs this work
21. Krea, M.; Khalaf, H.; Hydrometallurgy2000, 58, 215. 22. Henglein, A.; Chem. Rev. 1989, 89, 1861.
23. Gupta, A. K.; Gupta, M.; Biomaterials2005, 26, 3995. 24. Laurent, S.; Forge, D.; Port, M.; Roch, A.; Robic, C.; Elst, L. V.;
Muller, R. N.; Chem. Rev.2008, 108, 2064.
25. Lucena, R.; Simonet, B. M.; Cardenas, S.; Valcarcel, M.;
J. Chromatogr., A2011, 1218, 620.
26. Milja, T. E.; Prathish, K. P.; Rao, T. P.; J. Hazard. Mater.2011,
188, 384.
27. Kassaee, M. Z.; Masrouri, H.; Movahedi, F.; Appl. Catal., A 2011, 395, 28.
28. Franson, M. A. H.; Standard Method for Examination of Water and Waste Water, 20th ed.; American Publication Health Association: Washington, DC, 1999.
29. Imai, N.; Anal. Sci.1990, 6, 389.
30. Khayatian, G.; Hassanpoor, S.; J. Iran. Chem. Soc. 2013, 10, 113.
31. Ejnik, J.W.; Hamilton, M. M.; Adams, P. R.; Carmichael, A. J.;
J. Pharm. Biomed. Anal.2000, 24,227.
32. Zhao, X.; Shi, Y.; Wang, T.; Cai, Y.; Jiang, G.; J. Chromatogr., A 2008, 1188, 140.
33. Chen, L.; Wang, T.; Tong, J.; TrAC, Trends Anal. Chem. 2011,
30, 1095.
34. Keyhanian, F.; Shariati, S.; Faraji, M.; Hesabi, M.; Arabian J. Chem., in press, DOI: 10.1016/j.arabjc.2011.04.012.
35. Cheng, K. L.; Ueno, K.; Imamura, T.; CRC Handbook of Organic Analytical Reagent; CRC Press: Boca Raton, Florida, USA, 1982.
36. Zhang, X.; Niu, H.; Pan, Y.; Shi, Y.; Cai, Y.; J. Colloid. Interfarce Sci. 2011, 362, 107.
37. Azizi, H.; Asahara, Y.; Mehrabi, B.; Chung, S. L.; Chem. Erde 2011, 71, 363.
38. Rezaei, A.; Khani, H.; Masteri-Farahania, M.; Rofouei, M. K.;
Anal. Methods2012, 4, 4107.
39. Biswas, S.; Pathak, P. N.; Roy, S. B.; Spectrochim. Acta, Part A 2012, 91, 222.
Submitted: May 12, 2013