RESEARCH PAPER
Short-term secular change in height, body mass and Tanner-Whitehouse
3 skeletal maturity of Madeira youth, Portugal
Duarte Freitas
1,2, Robert M. Malina
3,4, Jose´ Maia
5, Johan Lefevre
6, Mikis Stasinopoulos
7, E´lvio Gouveia
2,
Albrecht Claessens
6, Martine Thomis
6& Berthold Lausen
11Department of Mathematical Sciences, University of Essex, Colchester, UK,2Department of Physical Education and Sport,
University of Madeira, Funchal, Portugal,3Department of Kinesiology and Health Education, University of Texas at Austin,
Austin, TX, USA,4Tarleton State University Stephenville, TX, USA,5Faculty of Sport, University of Porto, Porto, Portugal, 6Department of Biomedical Kinesiology, Faculty of Kinesiology and Rehabilitation Sciences, Katholieke Universiteit Leuven,
Leuven, Belgium, and7STORM, Faculty of Computing, London Metropolitan University, London, UK
Background: Secular trends in height and weight are reasonably well documented in Europe. Corresponding observations for skeletal maturation are lacking. Aim: To assess secular trends in height, body mass and skeletal maturity of Portuguese children and adolescents and to provide updated reference values for skeletal maturity scores (SMSs).
Subjects and methods: Data for 2856 children and adolescents of 4 – 17 years, 1412 boys and 1444 girls, from The ‘Madeira Growth Study’ (MGS; 1996 – 1998) and from the‘Healthy Growth of Madeira Children Study’ (CRES; 2006) were used. Height and body mass were measured. Skeletal maturity was assessed with the Tanner-Whitehouse 2 and 3 methods. Results: Children from CRES were taller and heavier than peers from MGS. Differences in height reached 5.8 cm in boys and 5.5 cm in girls. RUS SMSs did not differ consistently between surveys boys, while higher RUS scores were observed in CRES girls. Adult RUS SMSs for MGS and CRES combined were attained at 15.8 years in boys and 14.8 years in girls. Corresponding ages for adult Carpal SMSs were 14.4 and 14.0, respectively.
Conclusion: The short-term trends for height and mass were not entirely consistent with the trends in RUS and Carpal SMSs and SAs.
Keywords: Bone age, skeletal maturation, Tanner-Whitehouse
INTRODUCTION
Secular trends in height, body mass and age at menarche over generations are important tools in the evaluation of the
health and well-being of a population (Tanner 1992; Bielicki 1999). Present day children and adolescents are taller and heavier and mature earlier compared to previous gener-ations in many European countries (Sanna and Soro 2000; Laska-Mierzejewska and Olszewska 2007; Roelants et al. 2009; Kulaga et al. 2011; see also Bodzsar and Susanne 1998). In some countries, the trend to larger size and earlier maturation has stabilized (Gohke and Woelfle 2009).
Corresponding secular trends over a relatively long interval have occurred in Portugal, although data are less extensive. Heights of 18-year-old males have increased between 1904 and 2000, and age at menarche has declined (Padez 2007). The trend is consistent with earlier analyses (Padez and Johnston 1999; Padez 2002, 2003; Cardoso 2008). By inference, living conditions and associated health benefits have improved in Portugal over the past few decades.
The evidence for a secular trend in biological maturation is limited largely to the ages at menarche derived from retrospective data in early surveys and status quo estimates in more recent surveys. Estimates with the two techniques do not necessarily correspond (Beunen et al. 2006) Age at menarche is limited to puberty. Maturation of the skeleton, in contrast, spans the entire period of growth, can be used in both sexes and may be a better indicator of the ‘tempo’ of maturation (Tanner et al. 2001; Malina et al. 2004). Secular trend data for skeletal maturation are less extensive. Differences in skeletal maturation of Japanese children were negligible between 1986 and 1996 (Matsuoka et al. 1999), while significant secular increases occurred in the skeletal maturation of urban South African children between 1962 and 2001 (Hawley et al. 2009).
Correspondence: Duarte Luı´s de Freitas, Universidade da Madeira, Departamento de Educac¸a˜o Fı´sica e Desporto, Campus Universita´rio da Penteada, 9000-390 Funchal, Portugal, Tel:þ351 –291 – 705332, Fax:þ351 – 291 –705249. E-mail: dfreitas@uma.pt
(Received 21 November 2011; accepted 6 March 2012)
ISSN 0301-4460 print/ISSN 1464-5033 online DOI: 10.3109/03014460.2012.674155
195
Ann Hum Biol Downloaded from informahealthcare.com by Prof Robert M. Malina on 05/24/12
As with other studies of secular change, limitations should be noted. Variation in sampling, measurement techniques and age groups are potential confounders in comparisons of historical and contemporary studies (Malina et al. 2004; Hawley et al. 2009). In the case of skeletal maturity, variation among methods of assessment is an additional factor and, in the case of the TW method, modification in the reference sample and scoring protocol is a further issue (Malina et al. 2004; Malina 2011). The TW2 protocol was modified by elaboration of the reference sample to include children and adolescents from Belgium, Spain, Italy, Argentina, and the US in addition to the UK and by modification in the conversion of skeletal maturity scores (SMSs) to skeletal ages (SA); in addition, the new version (TW3) includes only radius, ulna and short bones (RUS) and Carpal SMSs and omits the overall 20 bone SMS (Tanner et al. 2001). Age at attaining adult status (i.e. skeletal maturity) with the RUS protocol was reduced from 18.1 to 16.5 years in boys and from 16.0 to15.0 years in girls in the TW3 protocol. The need to evaluate skeletal maturity in different countries was noted with the potential need to develop local reference values (Tanner et al. 2001).
In the case of Portugal, children and adolescents resident in Madeira in the mid-1990s (Freitas et al. 2004) were advanced in SMSs of the RUS compared to Belgian youth but were delayed in SMSs of the carpal bones as assessed with the Tanner-Whitehouse 2 protocol (TW2, Tanner et al. 1983). Similar trends were observed in comparisons of Madeira and UK youth. Madeira children attained the adult stage of RUS scores,2.4 years earlier in boys and 0.8 years in girls. In contrast, mature Carpal scores were attained at the same age in boys, 15.0 years, but at a younger age in girls, 12.9 years (see Freitas et al. 2004).
The issue of recent secular change in skeletal maturation of Portuguese children and adolescents has not been considered. The purposes of this study were: (1) to compare the skeletal maturity status of Portuguese children of 8 – 14 years surveyed in the mid-1990s with those surveyed in 2006 using the updated TW3 protocol and (2) to provide reference values for TW3 SMSs based on two representative samples of Madeira children aged 4– 17 years. Short-term secular changes in height and body mass are also included as a reference of comparison for changes in skeletal maturity status. We hypothesized that Madeira and Porto Santo children in 2006 would be taller and heavier and mature earlier than peers in 1996 – 1998 and that Portuguese children from Madeira and Porto Santo islands would be advanced in skeletal maturation relative to TW3 reference values.
METHODS
Subjects and sampling procedures
Subjects were from two studies of Madeira school children: the Madeira Growth Study (MGS) and the Healthy Growth of Madeira Children Study (CRES). Participants in the MGS entered in five cohorts aged 8, 10, 12, 14 and 16 years and were observed at annual intervals in 1996, 1997 and 1998.
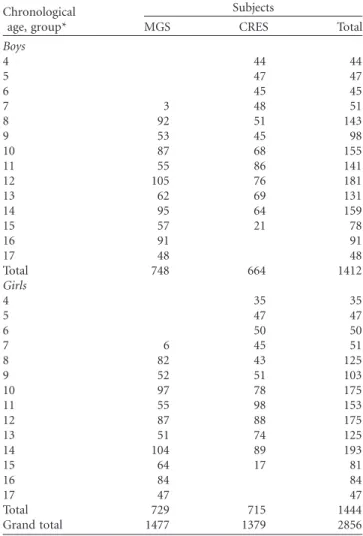
Overall, 1477 cross-sectional observations of 507 subjects were made providing information for 748 boys and 729 girls. The CRES included a cross-sectional sample of 1379 subjects, 664 boys and 715 girls, 4 – 14 years of age in 2006. The total cross-sectional sample for the two surveys included 2856 observations, 1412 boys and 1444 girls from Madeira and Porto Santo Islands, Portugal. Sample sizes by age group and sex are shown in Table I.
Stratified sampling was used in both studies in order to achieve representative samples of Madeira and Porto Santo islands. The population of the Autonomous Region of Madeira is relatively homogeneous; there is no aboriginal population that preceded Portuguese settlement of the early 15th century (Freitas et al. 2002). Demographic data were provided by the Ministry of Education and the sampling procedures were developed by a member of the Statistics Portugal. In the MGS, 36 schools were sampled in the 11 districts of Madeira and Porto Santo Islands. For each birth cohort, 100 subjects were randomly sampled according to the number of inhabitants in each district, matched for age and sex (see Freitas et al. 2002 for adetailed description of the sampling procedures). The same process was adopted in the CRES. Forty schools were sampled and, 50 boys and 50 girls were observed in the age interval 3 – 10 years and
Table I. Sample sizes by age group and sex in each study.
Chronological age, group*
Subjects
MGS CRES Total
Boys
4 44 44
5 47 47
6 45 45
7 3 48 51
8 92 51 143
9 53 45 98
10 87 68 155
11 55 86 141
12 105 76 181
13 62 69 131
14 95 64 159
15 57 21 78
16 91 91
17 48 48
Total 748 664 1412
Girls
4 35 35
5 47 47
6 50 50
7 6 45 51
8 82 43 125
9 52 51 103
10 97 78 175
11 55 98 153
12 87 88 175
13 51 74 125
14 104 89 193
15 64 17 81
16 84 84
17 47 47
Total 729 715 1444
Grand total 1477 1379 2856
* 4 years old¼4.00 – 4.99; MGS, Madeira Growth Study (1996 – 1998); CRES, Healthy Growth of Madeira Children Study (2006).
Ann Hum Biol Downloaded from informahealthcare.com by Prof Robert M. Malina on 05/24/12
,100 boys and 100 girls from 11 – 15 years old. No specific concerns were taken regarding socioeconomic status (SES) of the sample in CRES, since skeletal maturity was not related to SES in the MGS (Freitas et al. 2004). Approvals for the MGS and CRES were obtained from the Scientific Committee of the University of Madeira and the Ethics Committee of the Hospital Dr. Ne´lio Mendonc¸a, Funchal. Participation was voluntary. Parents or legal guardians signed informed consent statements while children provided assent.
Height and body mass
Height was measured to the last completed unit (mm) with a portable stadiometer (Siber-Hegner, GPM). With shoes removed, the subject stood upright with the heels, buttocks and scapulae in contact with the backboard, feet together and the head positioned in the Frankfurt plane. Body mass was measured on a balance-beam scale accurate to 0.1 kg (Seca Optima 760, Germany).
Before the two studies started, samples of subjects were measured twice with an interval of 1 week. Intra-class correlation coefficients (R) for height and body mass in both surveys varied between 0.98 – 1.00. Intra-observer reliability was also examined during the course of the two studies. During the respective surveys, a randomly selected sample of children was measured independently on two occasions. The reliability was consistent with the pilot study, 0.99 in MGS (n¼100) and 0.99 in CRES (n¼329).
Skeletal maturity assessment
A portable x-ray machine (Top 25, For You, Belgium) was used to take radiographs of the left hand-wrist. The x-ray tube was placed in the top of two lead-covered boxes to limit the radiation to the hand-wrist and to protect the subject and operator. The tube-film distance was 76 cm. The axis of the middle finger was in direct line with the axis of the forearm and the upper arm and the forearm were in the same horizontal plane following the technique described by Tanner et al. (2001). All x-ray procedures were supervized by a radiologist (AR); radiographs were taken by an ex-perienced technician from the Hospital Dr. Ne´lio Men-donc¸a, Funchal. Kodak (OMAT MA, Ready Pack) and FUJI (Super HR-GB) films were used in the MGS and CRES, respectively.
The skeletal maturity was assessed by the Tanner-Whitehouse 2 (TW2) method (Tanner et al. 1983) in MGS and by the TW3 method (Tanner et al. 2001) in CRES. Maturity stages and scores for each bone were identical in TW2 and TW3, but the scale for converting the sum of RUS SMSs to SAs were modified in TW3. Ratings in MGS were made by AR assisted by CS and DF (the lead author); all ratings in CRES were rated by DF.
Reliability analyses for skeletal maturity assessments were performed through the percentage of agreements (skeletal maturity) and intra-class correlation coefficient (R)/ANOVA-based intra-class correlation coefficient (anthropometry) within and/or between assessors. The three assessors of the MGS were first familiarized with the
TW2 method under the guidance of Gaston Beunen (GB). After 3 weeks of training, 50 x-rays of Leuven Growth Study of Belgians Boys (Ostyn et al. 1980) were rated by the members of the MGS and ratings compared with those of GB. The average inter-observer agreement was 81.3%. The 50 x-rays were also rated twice by the members of the MGS within a 15-day interval. The average intra-observer agreement was 91.8%. In the CRES, DF did an updated inter-observer reliability check using 50 x-rays from the MGS. The average agreement between DF and AR was 85.3%, ranging from 76% (middle phalange of the fifth finger and trapezium) and 100% (capitate and lunate). These results were consisted with earlier observations on the reproducibility of TW2 SA assessments (Beunen et al. 1990).
Construction of reference values for skeletal maturity scores There were no main effects of age and study or interaction age£study in a comparison of RUS and Carpal SMSs from the two surveys. The pooled standard deviations for RUS or Carpal SMSsdid not exceed 0.4 SD units. Hence, data from the two surveys were combined for the construction of reference values for SMSs.
Centiles curves for RUS and Carpal skeletal maturity scores (SMSs) were obtained for boys and girls separately using generalized additive models for location, scale and shape (GAMLSS). GAMLSS are a general class of semi-parametric regression-type of statistical models developed by Rigby and Stasinopoulos (2005). The GAMLSS package (Stasinopoulos and Rigby 2007) implemented in R, version 2.13.1 (R Development Core Team 2007) was used. A Box-Cox Cole and Green family distribution (Cole and Green 1992), denoted by BCCG (m, s,n) was chosen to model SMSs. Using the BCCG(m,s,n) distribution for the response variable is equivalent to using the LMS method of Cole and Green (1992). The parameters m,sandnof the distribution are interpreted as relating to location (median), scale (approximate coefficient of variation) and skewness (transformation to symmetry), respectively. In this study, a right censored version of the BCCG family (BCCGrc) was used (gamlss.cens package; Stasinopoulos and Rigby 2007) because several of the subjects were skeletally mature, i.e. SMS of 1000 (see also Tanner et al. 2001).
The response variable (Y) is the SMS and the explanatory variable (x) is the age of the subjects. The parameters (m,s, n) of the BCCG distribution are modeled as non-parametric function of the explanatory variable through penalized beta splines (pb)(Eilers and Marx 1996). The smoothing para-meters of the additive terms (or equivalent the effective degrees of freedom of smoothing) in the additive term are automatically estimated using the local maximum like-lihood method (Rigby and Stasinopoulos 2011). The link functions were identity for m and n and log for s. The models chosen for these parameters were:
(1) RUS, boys BCCGrc (dfm¼10.7, dfs¼7.7, dfn¼4.2) with global deviance (22 log-likelihood) of 14434.81; (2) RUS, girls BCCGrc (dfm¼8.5, dfs¼9.7, dfn¼2.0)
with global deviance of 13723.48;
Ann Hum Biol Downloaded from informahealthcare.com by Prof Robert M. Malina on 05/24/12
(3) Carpal, boys BCCGrc (dfm¼2.0,dfs¼11.3,dfn¼7.5) with global deviance of 13444.42; and
(4) Carpal, girls BCCGrc (dfm¼10.5, dfs¼11.7,
dfn¼1.0) with global deviance of 12086.96.
From the general model, centiles 100a¼10, 25, 50, 75 and 90 for RUS and Carpal SMSs were plotted by age and created predictive centile curves for the new x-values. Freehand software tools (8.6.0 version, Macromedia 1988 – 1998) were used to prepare the final figures.
Statistical analysis
Boys and girls from the MGS and CRES were analysed separately using SAS, version 8 (SAS Institute 1999), Stata, version 11 (StataCorp 2009) and R, version 2.13.1
(R Development Core Team 2007) packages. Age intervals were divided by years, e.g. the group of 4 year olds included children aged from 4.00 – 4.99 years, using decimals of years. Overall SMSs and conversion to SAs were obtained through a code written in Stata (StataCorp 2009), accor-ding to the TW3 framework (Tanner et al. 2001). Each dataset was examined for outliers, normality was inspected and descriptive statistics (mean and standard deviations) were computed to the variables under study. An independent-samples t-test was employed to compare the mean scores of MGS and CRES participants. A two-way between-groups ANOVA was applied to the data to investigate the age and/or study (MGS/CRES) effects on SMS and also to check for any interaction effect. Alpha was set at p,0.05.
Table II. Means and standard deviations in age, height and body mass in each survey and differences (CRES – MGS) in height and body mass between surveys.
Chronological age, group
Subjects CA (years) Height (cm) Body mass (kg)
MGS CRES MGS CRES MGS CRES Dif. p MGS CRES Dif. p
Boys
8 92 51 8.5^0.2 8.5^0.3 127.9^5.6 131.6^6.3 þ3.7 ,0.001 27.1^5.3 30.9^6.6 þ3.8 ,0.001 9 53 45 9.6^0.3 9.5^0.3 135.6^5.9 135.7^5.8 þ0.8 0.950 31.6^6.2 32.4^7.1 þ0.8 0.547 10 87 68 10.5^0.3 10.6^0.3 137.6^6.3 143.4^6.6 þ5.8 ,0.001 32.4^6.8 40.6^10.1 þ8.2 ,0.001 11 55 86 11.5^0.3 11.5^0.3 144.8^7.2 147.3^7.9 þ2.6 0.053 37.3^8.5 42.7^10.4 þ5.4 0.002 12 105 76 12.5^0.3 12.5^0.3 149.0^7.9 154.3^8.1 þ5.3 ,0.001 42.3^8.7 49.4^13.0 þ7.1 ,0.001 13 62 69 13.6^0.3 13.5^0.3 158.4^8.3 160.1^8.9 þ1.7 0.257 50.0^10.3 52.2^11.8 þ2.2 0.272
14 95 64 14.4^0.3 14.5^0.3 164.5^8.1 166.5^7.7 þ2.1 0.108 54.4^11.6 56.9^11.0 þ2.5 0.184 Girls
8 82 43 8.5^0.3 8.5^0.3 126.9^5.4 131.2^5.9 þ4.3 ,0.001 26.2^4.9 29.3^6.7 þ3.2 0.003
9 52 51 9.5^0.3 9.4^0.3 134.3^5.2 136.7^6.0 þ2.4 0.030 30.5^5.9 34.7^8.5 þ4.3 0.004
10 97 78 10.5^0.3 10.6^0.3 136.4^7.4 141.9^6.9 þ5.5 ,0.001 31.8^7.6 36.6^7.8 þ4.8 ,0.001
11 55 98 11.6^0.3 11.5^0.3 145.4^7.6 149.4^7.3 þ4.0 0.002 37.5^9.7 44.0^9.9 þ6.6 ,0.001
12 87 88 12.5^0.3 12.5^0.3 149.5^7.5 154.0^6.6 þ4.5 ,0.001 41.1^8.0 46.3^10.2 þ5.2 ,0.001
13 51 74 13.6^0.3 13.6^0.3 155.7^7.6 156.9^6.1 þ1.1 0.352 47.5^8.3 52.0^10.6 þ4.5 0.013 14 104 89 14.4^0.3 14.5^0.3 156.9^6.1 160.5^6.5 þ3.6 ,0.001 49.9^9.4 55.2^8.4 þ5.3 ,0.001 CA, Chronological age; MGS, Madeira Growth Study (1996 – 1998); CRES, Healthy Growth of Madeira Children Study (2006); Dif., Difference between MGS and CRES.
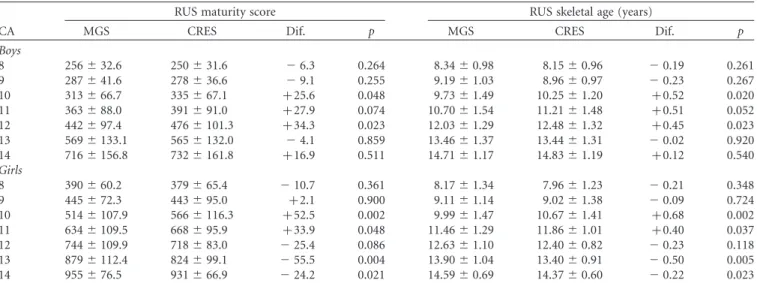
Table III. Means and standard deviations in RUS maturity scores and skeletal ages (TW3) by chronological age group in the two surveys and sex and differences between surveys (CRES – MGS).
RUS maturity score RUS skeletal age (years)
CA MGS CRES Dif. p MGS CRES Dif. p
Boys
8 256^32.6 250^31.6 26.3 0.264 8.34^0.98 8.15^0.96 20.19 0.261 9 287^41.6 278^36.6 29.1 0.255 9.19^1.03 8.96^0.97 20.23 0.267 10 313^66.7 335^67.1 þ25.6 0.048 9.73^1.49 10.25^1.20 þ0.52 0.020
11 363^88.0 391^91.0 þ27.9 0.074 10.70^1.54 11.21^1.48 þ0.51 0.052
12 442^97.4 476^101.3 þ34.3 0.023 12.03^1.29 12.48^1.32 þ0.45 0.023
13 569^133.1 565^132.0 24.1 0.859 13.46^1.37 13.44^1.31 20.02 0.920 14 716^156.8 732^161.8 þ16.9 0.511 14.71^1.17 14.83^1.19 þ0.12 0.540 Girls
8 390^60.2 379^65.4 210.7 0.361 8.17^1.34 7.96^1.23 20.21 0.348 9 445^72.3 443^95.0 þ2.1 0.900 9.11^1.14 9.02^1.38 20.09 0.724 10 514^107.9 566^116.3 þ52.5 0.002 9.99^1.47 10.67^1.41 þ0.68 0.002 11 634^109.5 668^95.9 þ33.9 0.048 11.46^1.29 11.86^1.01 þ0.40 0.037 12 744^109.9 718^83.0 225.4 0.086 12.63^1.10 12.40^0.82 20.23 0.118 13 879^112.4 824^99.1 255.5 0.004 13.90^1.04 13.40^0.91 20.50 0.005 14 955^76.5 931^66.9 224.2 0.021 14.59^0.69 14.37^0.60 20.22 0.023 CA, Chronological age; MGS, Madeira Growth Study (1996 – 1998); CRES, Healthy Growth of Madeira Children Study (2006); Dif., Difference between MGS and CRES.
Ann Hum Biol Downloaded from informahealthcare.com by Prof Robert M. Malina on 05/24/12
RESULTS
Secular trends in height, body mass and RUS and Carpal skeletal maturity scores
Descriptive statistics for chronological age, height and body mass and the difference between MGS and CRES are presented in Table II. A positive secular change for height is apparent in some age groups for boys and almost all age groups for girls. Children from CRES are taller than
peers from MGS; the differences reach 5.8 cm in boys and 5.5 cm in girls at 10 years. Children from CRES are heavier than peers from MGS and increases are most apparent in boys of 10 – 12 years and in girls.
Descriptive data for RUS and Carpal SMSs and bone age are shown in Tables III and IV. RUS SMSs do not differ between studies in almost all age groups of boys, while higher RUS SMSs are observed in girls at 10 – 11 years in
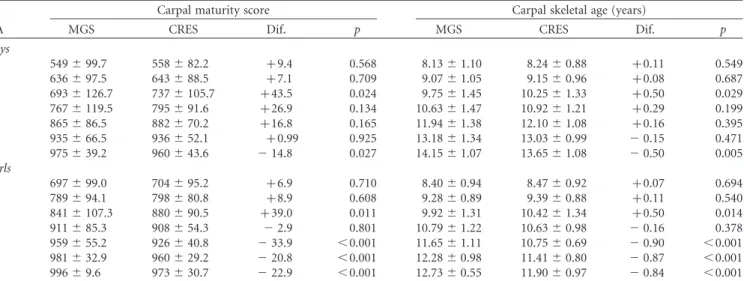
Table IV. Means and standard deviations in Carpal maturity scores and skeletal ages (TW3) by chronological age group in the two surveys and sex and differences between surveys (CRES – MGS).
Carpal maturity score Carpal skeletal age (years)
CA MGS CRES Dif. p MGS CRES Dif. p
Boys
8 549^99.7 558^82.2 þ9.4 0.568 8.13^1.10 8.24^0.88 þ0.11 0.549 9 636^97.5 643^88.5 þ7.1 0.709 9.07^1.05 9.15^0.96 þ0.08 0.687 10 693^126.7 737^105.7 þ43.5 0.024 9.75^1.45 10.25^1.33 þ0.50 0.029 11 767^119.5 795^91.6 þ26.9 0.134 10.63^1.47 10.92^1.21 þ0.29 0.199 12 865^86.5 882^70.2 þ16.8 0.165 11.94^1.38 12.10^1.08 þ0.16 0.395 13 935^66.5 936^52.1 þ0.99 0.925 13.18^1.34 13.03^0.99 20.15 0.471
14 975^39.2 960^43.6 214.8 0.027 14.15^1.07 13.65^1.08 20.50 0.005
Girls
8 697^99.0 704^95.2 þ6.9 0.710 8.40^0.94 8.47^0.92 þ0.07 0.694
9 789^94.1 798^80.8 þ8.9 0.608 9.28^0.89 9.39^0.88 þ0.11 0.540
10 841^107.3 880^90.5 þ39.0 0.011 9.92^1.31 10.42^1.34 þ0.50 0.014
11 911^85.3 908^54.3 22.9 0.801 10.79^1.22 10.63^0.98 20.16 0.378 12 959^55.2 926^40.8 233.9 ,0.001 11.65^1.11 10.75^0.69 20.90 ,0.001 13 981^32.9 960^29.2 220.8 ,0.001 12.28^0.98 11.41^0.80 20.87 ,0.001 14 996^9.6 973^30.7 222.9 ,0.001 12.73^0.55 11.90^0.97 20.84 ,0.001 CA, Chronological age; MGS, Madeira Growth Study (1996 – 1998); CRES, Healthy Growth of Madeira Children Study (2006); Dif., Difference between MGS and CRES.
5 10 11 12 13 14 15 16
0 1 50 100 150 250 350 450 550 650 750 850 950
200 300 400 500 600 700 800 900 1000
0 50 100 150 250 350 450 550 650 750 850 950
200 300 400 500 600 700 800 900 1000 10
17 Boys Age, years RUS (TW3)
Maturity Score
18 19 20 50
9075 25
2 3 4 6 7 8 9
Figure 1. Portuguese reference values for RUS (TW3) skeletal maturity score: boys.
Ann Hum Biol Downloaded from informahealthcare.com by Prof Robert M. Malina on 05/24/12
CRES and the opposite is apparent at 13 – 14 years. Carpal SMSs are significantly higher in boys from CRES at 10 years but lower at 14 years. Carpal SMSs differ significantly in girls between MGS and CRES at 10 years (higher in CRES) and from 12 to 14 years (lower in CRES). RUS and Carpal SAs follow the trends of the corresponding SMSs in MGS and CRES.
Percentiles for RUS and Carpal SMS
Smoothed centiles (10th, 25th, 50th, 75thand 90th) based on the combined dataset (MGS and CRES) for RUS and Carpal (TW3) SMSs are shown in Figures 1 – 4. In boys, the centile 50thof RUS shows a linear increase from 4 to 12 years and then by sharp increase until full maturity (SMS¼1000). Ages of attaining SMSs of 500, i.e. half of the distance travelled along the road to full maturity, and 1000 in boys are 13.2 and 15.8 years, respectively. Variability in SMSs increases with age and maximum at skeletal maturity. Children at P90 reach a SMS of 1000 at 14.6 years, while children at P10 achieve the same SMS at 17.2 years (Figure 1).
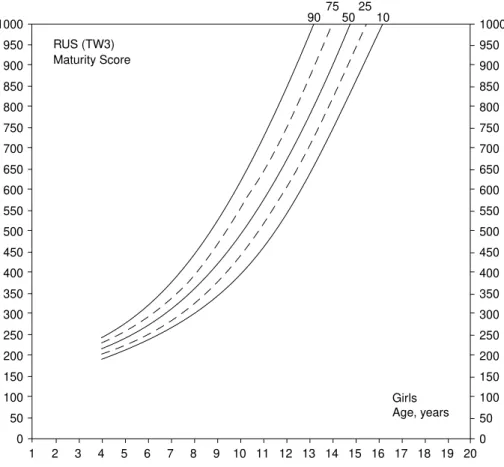
The path of 50thcentiles is sharper in girls than in boys. Ages of attaining SMSs of 500 and 1000 in girls are 10.2 years and 14.8 years, respectively. Variability at 4 years of age is less than at 13 – 16 years of age. Girls at P90 reach skeletal maturity at 13.3 years, whereas girls at P10 reach maturity at 16.2 years (Figure 2).
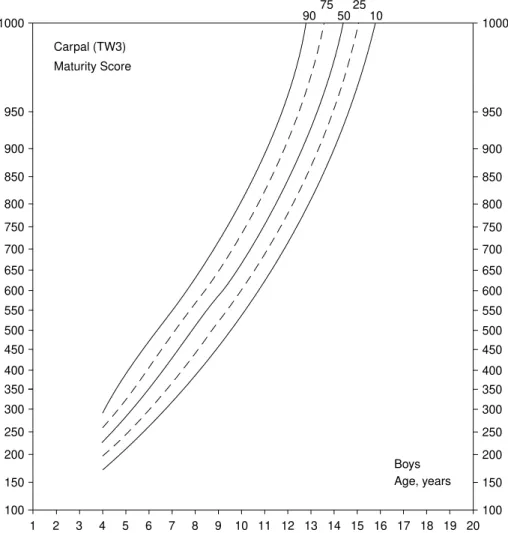
Among boys, Carpal SMSs at P50 increase linearly with age and reach maturity at 14.4 years. Variability is similar
through the age range to maturity (Figure 3). In contrast, Carpal SMSs at P50 in girls show a sharp increase until 10 years and then a slower increase to 14.0 years. Maturity of Carpal bones is attained at 12 years in girls at P90 and at 15.5 years in girls at P10. Variability is high and generally similar from 4 years to maturity of the Carpal bones (Figure 4).
Comparison of centiles for Portuguese youth and the Tanner-Whitehouse 3 reference
The 10th, 50thand 90th-centiles for RUS and Carpal SMSs of the Portuguese sample are compared to the corresponding centiles of TW3 reference in Figures 5(a – d). P50 values for RUS of Portuguese boys are below the reference until 12 years of age and then exceed the reference. Portuguese boys reach skeletal maturity , 0.7 years earlier than the TW3 reference, 15.8 vs 16.5 years, respectively. P10 and P90 values for RUS of boys follow the same trend as the P50 values (Figure 5(a)).
The P10, P50 and P90 centiles for RUS of Portuguese girls are slightly but consistently below the TW3 reference, but, between 11 – 14 years, P90 centiles overlap the reference. On average, RUS maturity is reached at a similar age in Portuguese girls and the reference sample, 14.8 and 14.6 years, respectively. Variation in the two samples of girls is also quite similar (Figure 5(b)).
Centiles of Carpal SMSs of Portuguese boys exceed the TW3 reference until 9 years, lag behind the reference from 10 – 15 years, but reach maturity 0.7 years earlier than the 0
50 100 150 250 350 450 550 650 750 850 950
200 300 400 500 600 700 800 900 1000
0 50 100 150 250 350 450 550 650 750 850 950
200 300 400 500 600 700 800 900 1000 10
Girls Age, years RUS (TW3)
Maturity Score
50 9075 25
5 10 11 12 13 14 15 16
1 2 3 4 6 7 8 9 17 18 19 20
Figure 2. Portuguese reference values for RUS (TW3) skeletal maturity score: girls.
Ann Hum Biol Downloaded from informahealthcare.com by Prof Robert M. Malina on 05/24/12
reference. Similar crossovers are apparent for P10 and P90 centiles as maturity is approached (Figure 5(c)). In contrast, P50 values of Portuguese girls are nearly coincident with the Carpal SMS reference until 9 years, then lag relative to the reference and reach maturity 1 year later, i.e. 14.0 vs 13.0 years, respectively. Variability in the Portuguese girls is higher than the TW3 reference at skeletal maturity (Figure 5(d)).
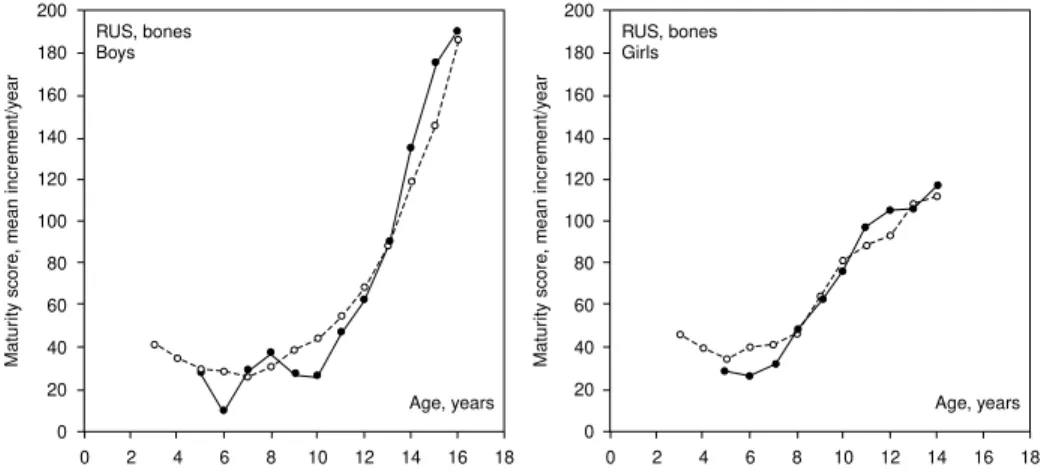
Estimated yearly increments for the 50th centiles of the two samples are plotted in Figure 6. Allowing for sampling variation, Portuguese boys mature somewhat slower than TW3 reference values until 12 years but faster than the reference from 13 years to maturity. The comparison for girls suggests three phases relative to the reference: a slower maturity rate from 5 to 7 years, equal rates from 8 to 10 years and a somewhat faster rate from 11 to 13 years (Figure 6).
DISCUSSION
It was hypothesized that Madeira and Porto Santo children in 2006 would be taller and heavier and mature earlier than peers in 1996 – 1998. The hypothesis was partially supported. Comparisons of height and body mass between the two
surveys showed increases (significant at most ages), more so for body mass than for height (Table II). However, RUS and Carpals SMSs (and corresponding SAs) did not markedly differ between surveys of Madeira children in the mid-1990s and 2006 in almost all age groups of boys. The trends for girls were generally similar, but, at 12 – 14 years, RUS SMSs were somewhat delayed in CRES compared to MGS (Tables III and IV).
The short-term trends for height and mass were thus not entirely consistent with the trends in RUS and Carpal SMSs and SAs. This likely reflected, to some extent, the scales of measurement for height and mass, on one hand, and skeletal maturity on the other. Height and mass are quantified in units that can be accurately measured, whereas there is a degree of subjectivity in the assignment of stages for the radius, ulna, short bones (metacarpals and phalanges) and carpals and in the conversion of stages to specific maturity scores and in turn to SAs. Scores assigned to stages and in turn SAs are less precise than units of measurement for height and mass. It is plausible that the processes underlying the linear growth of bones and accretion of body mass are somewhat different than the processes underlying the replacement of cartilage by osseous tissue in the bones of the hand and wrist, but the details are not completely 100
150 250 350 450 550 650 750 850 950
200 300 400 500 600 700 800 900 1000
100 150 250 350 450 550 650 750 850 950
200 300 400 500 600 700 800 900 1000
Carpal (TW3) Maturity Score
Boys Age, years 10
50 9075 25
5 10 11 12 13 14 15 16
1 2 3 4 6 7 8 9 17 18 19 20
Figure 3. Portuguese reference values for Carpal (TW3) skeletal maturity score: boys.
Ann Hum Biol Downloaded from informahealthcare.com by Prof Robert M. Malina on 05/24/12
understood (Tanner et al. 2001; Malina et al. 2004). The processes underlying growth in height and body mass may also be more plastic in response to environmental stresses than the processes underlying skeletal maturation. Genetic changes are not a reasonable explanation. The time elapsed between the MGS and CRES (,10 years) was not sufficient for genetic change, which probably requires one or more likely several generations.
Comparative studies of secular change in skeletal maturity are limited. Negligible changes were noted in TW2 RUS and Carpal SMSs between 1986 – 1996 in Japanese children and adolescents (Matsuoka et al. 1999). Over a longer interval (1962 – 2001), however, significant secular increments in SA (Greulich-Pyle method of assessment) were noted among urban Black South African children of 9 – 11 years; corresponding secular gains were significant among 9 year-old urban White South African children but not among 10 and 11 year olds (Hawley et al.2009). Allowing for sampling and representativeness of samples, a general comparison of studies of American children dating to the 1930s through the 1960s indicated negligible differences in Greulich-Pyle SAs across time (Roche et al. 1974).
Improvements of environmental and nutritional circum-stances in Madeira since the 1980s likely contributed to the
positive secular trends observed in height and body mass. Madeira was one of the poorest regions in Portugal in 1988 with GDP per head being only 40% of the European average; 10 years later it increased to 58% (InfoRegio 2008). Since the 1980s, the Madeira economy has changed from one based on subsistence production into an off-shore tourist/business centre (Almeida and Correia 2010). This recent rapid economic growth has been aided since 1986 by European community structural fund monies. Participants in the MGS and CRES were born in the 1980s through 2002. Life expectancy in Madeira increased during this interval from 68.2 to 73.2 years in men and from 75.1 to 80.0 years in women (INE 2011a), while infant mortality rate decreased from 27.1‰ to 5.3‰ in boys and from 21.1‰ to 4.7‰ in girls (INE 2011b). Trends of food intake in Portugal between 1987 – 1999 also indicated a shift in dietary pattern from a traditional south European to a more Westernized protein-rich diet (Marques-Vidal et al. 2006).
Skeletal maturation tends to be, on average, accelerated in obese youth compared to non-obese peers. Obese Belgian youth (defined on the basis of the sum of five skin-folds) were, for example, advanced in TW2 20 bone SAs compared to non-obese age peers (Beunen et al.1982, 1994). Also, American children of both sexes classified obese by the BMI 100
150 250 350 450 550 650 750 850 950
200 300 400 500 600 700 800 900 1000
100 150 250 350 450 550 650 750 850 950
200 300 400 500 600 700 800 900 1000
Carpal (TW3) Maturity Score
Girls Age, years 10
50 9075 25
5 10 11 12 13 14 15 16
1 2 3 4 6 7 8 9 17 18 19 20
Figure 4. Portuguese reference values for Carpal (TW3) skeletal maturity score: girls.
Ann Hum Biol Downloaded from informahealthcare.com by Prof Robert M. Malina on 05/24/12
tended to be advanced in TW2 20 SAs compared to those classified as obese by only the triceps skin-fold (Malina et al. 1989). Using the international cut-off points proposed by the IOTF (Cole et al. 2000), the prevalence of overweight plus obesity increased in boys from 14.7% (MGS) to 27.2% (CRES) and from 10.8% (MGS) to 26.1% (CRES) in girls. It was not clear, however, if the increasing prevalence of overweight and obesity was related to trends in RUS and Carpal SMSs (Tables III and IV). Although differences in skeletal maturation at certain ages noted in the comparisons of MGS and CRES may have been influenced by weight status, the direction of the differences between surveys was not consistent. Girls in CRES were advanced in RUS SMSs at 10 – 11 years, but delayed in RUS SMSs at 13 – 14 years.
Carpal SMSs were higher in CRES in girls at 10 years but lower from 12 – 14 years. Similarly, carpal SMSs were higher in CRES boys at 10 years but lower at 14 years. Given the trends, it is difficult to attribute variation in skeletal maturation between MGS and CRES to secular changes in weight status. Similar results for skeletal maturation were noted in South African adolescents between 1962 – 2001 (Hawley et al. 2009), but consumption of foods containing oestrogens in conjunction with an increase in obesity were suggested as factors contributing to the trend in South African youth.
Although there were several significant differences between MGS and CRES skeletal ages (SAs), mainly in girls, they were not as large as differences among the samples 0 50 100 150 250 350 450 550 650 750 850 950 200 300 400 500 600 700 800 900 1000 0 50 100 150 250 350 450 550 650 750 850 950 200 300 400 500 600 700 800 900 1000 10 Boys Age, years RUS (TW3) Maturity Score 50 90 0 50 100 150 250 350 450 550 650 750 850 950 200 300 400 500 600 700 800 900 1000 0 50 100 150 250 350 450 550 650 750 850 950 200 300 400 500 600 700 800 900 1000 10 Girls Age, years RUS (TW3) Maturity Score 50 90 100 150 250 350 450 550 650 750 850 950 200 300 400 500 600 700 800 900 1000 100 150 250 350 450 550 650 750 850 950 200 300 400 500 600 700 800 900 1000 Carpal (TW3) Maturity Score Boys Age, years 10 50 90 100 150 250 350 450 550 650 750 850 950 200 300 400 500 600 700 800 900 1000 100 150 250 350 450 550 650 750 850 950 200 300 400 500 600 700 800 900 1000 Carpal (TW3) Maturity Score Girls Age, years 10 50 90 (c) (a) (d) (b)
5 10 11 12 13 14 15 16
1 2 3 4 6 7 8 9 17 18 19 20
5 10 11 12 13 14 15 16
1 2 3 4 6 7 8 9 17 18 19 20 1 2 3 4 5 6 7 8 9 10 11 12 13 14 15 16 17 18 19 20 5 10 11 12 13 14 15 16
1 2 3 4 6 7 8 9 17 18 19 20
Figure 5. Portuguese reference values (10th, 50thand 90thcentiles; solid line) compared with the TW3 reference values (Tanner et al. 2001; dashed line): (a) RUS, boys; (b) RUS, girls; (c) Carpal, boys; (d) Carpal, girls.
Ann Hum Biol Downloaded from informahealthcare.com by Prof Robert M. Malina on 05/24/12
combined to create the TW3 reference values. TW3 utilized data from UK (1960s), Belgium (1970s), Spain (1980s), Japan (1985), Italy (1990s), Argentina (1971) and US White children from a well-off region north of the city of Houston (1985 – 1995). The sample spanned, 40 years. Moreover, the samples varied in chronological ages at reaching specific RUS skeletal maturity scores and by inference in maturity status. For example, the chronological age at reaching a RUS score of 500 in boys varied among samples from 12.9 – 14.3 years; the corresponding ages in girls varied between 9.4 – 11.0 years. Similar variation among samples was apparent in chronological ages at reaching other RUS scores (Tanner et al. 2001). Differences between MGS (1996 – 1998) and CRES (2006) at certain ages were probably within the range of and perhaps less than those noted in the reference samples and combining the two studies should thus not be a problem for the purpose of establishing a reference for Portuguese youth.
The hypothesis that Portuguese children from Madeira and Porto Santo islands would be advanced in skeletal maturation relative to TW3 reference values was not supported (Figure 5). Comparisons of the combined data for Portuguese children and adolescents (MGS and CRES) with the TW3 reference varied by age and within each sex. However, skeletal maturity was attained earlier by Portuguese boys for RUS and Carpal SMSs. In contrast, ages at attaining RUS maturity were similar in Portuguese girls and the reference, but age at attaining Carpal maturity was later in Portuguese girls than the reference.
In summary, the short-term trends for height and mass were not entirely consistent with the trends in RUS and Carpal SMSs and SAs. This likely reflected the scales of measurement for height and mass, on one hand, and skeletal maturity, on the other. Other factors that may have contributed to differences in the trends for body size and skeletal maturation are the biological control of growth and maturation and the plasticity of these processes to the environmental conditions. Although limited to samples from the Autonomous Region of Madeira, the population is relatively homogeneous and there is no evidence for an aboriginal population that preceded Portuguese
settlement of the early 15th century. Taking into consideration previous observations (Freitas et al. 2004) and given a lack of skeletal maturity data for a large sample of youth from mainland Portugal, the smoothed percentiles may serve as an updated reference for the skeletal maturation of youth in the Portuguese population.
ACKNOWLEDGEMENTS
We would like to greatly acknowledge the supervision and assistance of Professor Emeritus Gaston Beunen of the Faculty of Kinesiology and Rehabilitation Sciences, Depart-ment of Biomedical Kinesiology, Katholieke Universiteit Leuven, who assisted in the data analysis and contributed significantly to the quality of the manuscript in its early stages. Gaston unexpectedly passed away in August of 2011. Thanks are extended to Dr Huiqi Pan from the Institute of Child Health, University College London who helped us in fitting the RUS and Carpal skeletal maturity centiles. The Madeira Growth Study was co-sponsored by the POP-RAM II and III, within the scope of the European Social Funds, via CITMA and the Professional Qualification Centre.
Declaration of interest: The authors report no conflicts of interest. The authors alone are responsible for the content and writing of the paper.
REFERENCES
Almeida A, Correia A. 2010. Tourism development in Madeira: an analysis based on the life cycle approach. Tourism Economics 16: 427 – 441.
Beunen G, Lefevre J, Ostyn M, Renson R, Simons J, Van Gerven D. 1990. Skeletal maturity in Belgian youths assessed by the Tanner-Whitehouse method (TW2). Ann Hum Biol 17:355 – 376. Beunen G, Malina RM, Lefevre JA, Claessens AL, Renson R, Vanreusel
B. 1994. Adiposity and biological maturation in girls 6-16 years of age. Int J Obes 18:542 –546.
Beunen G, Malina RM, Ostyn M, Renson R, Simons J, Van Gerven D. 1982. Fatness and skeletal maturity of Belgian boys 12 through 17 years of age. Am J Phys Anthropol 59:387 –392.
200
180
160
140
120
100
80
60
40
20
0
Age, years RUS, bones
Boys
Matur
ity score
, mean increment/y
ear
10 8 6 4 2
0 12 14 16 18 0 2 4 6 8 10 12 14 16 18 200
180
160
140
120
100
80
60
40
20
0
Age, years RUS, bones
Girls
Matur
ity score
, mean increment/y
ear
Figure 6. Yearly increments for the 50thcentiles of the Portuguese sample (present study; solid line) and the TW3 reference values (Tanner et al. 2001;
dashed line).
Ann Hum Biol Downloaded from informahealthcare.com by Prof Robert M. Malina on 05/24/12
Beunen GP, Rogol AD, Malina RM. 2006. Indicators of biological maturation and secular changes in biological maturation. Food Nutr Bull 27(4):S244 – S256.
Bielicki T. 1999. Secular trends in growth: human biologists’ contribution to the understanding of social change. In: Johnston FE, Zemel B, Eveleth PB, editors. Human growth in context. London: Smith-Gordon. p 303 –311.
Bodzsar EB, Susanne C. 1998. Secular growth change in Europe. Budapeste, Eo¨tuo¨s University Press.
Cardoso HF. 2008. Secular changes in body height and weight of Portuguese boys over one century. Am J Hum Biol 20:270 –277. Cole TJ, Bellizzi MC, Flegal KM, Dietz WH. 2000. Establishing
a standard definition for child overweightand obesity worldwide: international survey. Br Med J 320:1240 – 1243.
Cole TJ, Green PJ. 1992. Smoothing reference centile curves: the LMS method and penalized likelihood. Stats Med 11:1305 – 1319. Eilers PH, Marx BD. 1996. Flexible smoothing with B-splines and
penalties. Statist Sci 11:89 – 111.
Freitas D, Maia J, Beunen G, Lefevre J, Claessens A, Marques A, Rodrigues A, Silva C, Crespo M, Thomis M, Sousa A, Malina RM. 2004. Skeletal maturity and socio-economic status in Portuguese children and youths: the Madeira Growth Study. Ann Hum Biol 31: 408 – 420.
Freitas DL, Maia JA, Beunen GP, Lefevre JA, Claessens AL, Marques AT, Rodrigues AL, Silva CA, Crespo MT. 2002. Human growth, biological maturation, physical fitness, physical activity and socioeconomic status of Madeira children and adolescents. The Madeira Growth Study (in Portuguese). Funchal: Universidade da Madeira.
Gohlke B, Woelfle J. 2009. Growth and puberty in German children. Is there still a positive secular trend? Dtsch Arztebl Int 106:377 – 382. Hawley NL, Rousham EK, Norris SA, Pettifor JM, Cameron N. 2009.
Secular trends in skeletal maturity in South Africa: 1962-2001. Ann Hum Biol 36:584 – 594.
INE, Instituto Nacional de Estatı´stica (Portuguese Statistics). 2011a. Esperanc¸a me´dia de vida. Available online at: http://www.ine.pt (accessed 26 August 2011).
INE, Instituto Nacional de Estatı´stica (Portuguese Statistics). 2011b. Taxa de mortalidade. Available online at: http://www.ine.pt (accessed 26 August 2011).
InfoRegio. 2008. At the service of the regions, What is achieved? Available online at: http://ec.europa.eu/regional_policy/intro/ regions10_en.htm (accessed 3 September 2011).
Kulaga Z, Litwin M, Tkaczyk M, Palczewska I, Zaje˛czkowska M, Zwolin´ska D, Krynicki T, Wasilewska A, Moczulska A, Morawiec-Knysak A, Barwicka K. 2010. Polish 2010 growth references for school-aged children and adolescents. Eur J Pediatr 170:599 – 609. Laska-Mierzejewska T, Olszewska E. 1967. Anthropological assessment
of changes in living conditions of the rural population in Poland in the period 1967 –2001. Ann Hum Biol 34:362 –376.
Malina RM. 2011. Skeletal age and age verification in youth sport. Sports Med 41:926 –947.
Malina RM, Bouchard C, Bar-Or O. 2004. Growth, maturation, and physical activity. 2nded., Champaign, IL: Human Kinetics.
Malina RM, Skrabanek MF, Little BB. 1989. Growth and maturity status of Black and White children classified obese by different criteria. Am J Hum Biol 1:193 – 199.
Marques-Vidal P, Ravasco P, Dias CM, Camilo ME. 2006. Trends of food intake in Portugal, 1987 –1999: results from the National Health Surveys. Eur J Clin Nutr 60:1414 – 1422.
Matsuoka H, Sato K, Sugihara S, Murata M. 1999. Bone maturation reflects the secular trend in growth. Horm Res 52:125 – 130. Ostyn M, Simons J, Beunen G, Renson R, Van Gerven D. 1980. Somatic
and motor development of Belgian secondary schoolboys. Norms and Standards. Leuven: Leuven University Press.
Padez C. 2002. Stature and stature distribution in Portuguese male adults 1904-1998: the role of environmental factors. Am J Hum Biol 14:39 –49.
Padez C. 2003. Secular trend in stature in the Portuguese population (1904-2000). Ann Hum Biol 30:262 – 278.
Padez C. 2007. Secular trend in Portugal. J Hum Ecol 22:15 – 22. Padez C, Johnston F. 1996. Secular trends in male adult height
1904^1996 in relation to place of residence and parent’s educational level in Portugal. Ann Hum Biol 26:287 – 298. R Development Core Team. 2007. R: a language and environment for
statistical computing. R Foundation for Statistical Computing Vienna, Austria. ISBN 3-900051-07-0. (Available online at: http:// www.R-project.org/, accessed June-September 2011).
Rigby RA, Stasinopoulos DM. 2005. Generalized additive models for location, scaleand shape. Appl Statist 54:507 – 554.
Rigby RA, Stasinopoulos DM. 2011. Automatic smoothing parameter selection in GAMLSS with an application to centile estimation. To appear in Stat Methods Med Res.
Roche AF, Roberts J, Hamill PV. 1974. Skeletal maturity of children 6-11 years, United States. Vital and Health Statistics, Series 11, No 140. Rockville, MD: Department of Health, Education and Welfare.
Roelants M, Hauspie R, Hoppenbrouwers K. 2009. References for growth and pubertal development from birth to 21 years in Flanders, Belgium. Ann Hum Biol 36:680 – 694.
Sanna E, Soro MR. 2000. Anthropometric changes in urban Sardinian children 7 to 10 years between 1975 –1976 and 1996. Am J Hum Biol 12:782 – 791.
SAS Institute. 1999. SAS/STAT User’s Guide, Version 8. Cary, NC: SAS Institute.
Stasinopoulos DM, Rigby RA. 2007. Generalized additive models for location, scaleand shape (GAMLSS) in R. Journal of Statistical Software 23:1 – 46. Available online at: http://www.jstatsoft.org/ (accessed 3 September 2011).
StataCorp. 2009. Stata Statistical Software: Release 11. College Station, TX: StataCorp LP.
Tanner JM. 1992. Growth as a measure of the nutritional and hygienic status of a population. Horm Res 38(Suppl 1):106 – 115.
Tanner JM, Healy MJ, Goldstein H, Cameron N. 2001. Assessment of Skeletal Maturity and Prediction of Adult Height (TW3 Method). 3rded., London: Saunders.
Tanner JM, Whitehouse RH, Cameron N, Marshall WA, Healy MJ, Goldstein H. 1983. Assessment of skeletal maturity and prediction of adult height (TW2 Method). 2nded., London: Academic Press
Limited.
Ann Hum Biol Downloaded from informahealthcare.com by Prof Robert M. Malina on 05/24/12