International Journal of Environmental Research and Public Health
ISSN 1660-4601
www.mdpi.com/journal/ijerph
Article
Centile Curves and Reference Values for Height, Body Mass,
Body Mass Index and Waist Circumference of Peruvian
Children and Adolescents
Alcibíades Bustamante 1,2, Duarte Freitas 3, Huiqi Pan 4, Peter T. Katzmarzyk 5 and
José Maia 2,*
1 National University of Education Enrique Guzmán y Valle, Av. Guzmán y Valle s/n
La Cantuta-Chosica, Lima, Peru; E-Mail: huanta2609@yahoo.es
2 CIFI2D, Kinanthropometry Lab, Faculty of Sport, University of Porto, Rua Dr. Plácido Costa 91,
Porto 4200-450, Portugal
3 Department of Physical Education and Sports, University of Madeira, Colégio
dos Jesuítas-Rua dos Ferreiros, Funchal 9000-082, Portugal; E-Mail: dfreitas3@uma.pt
4 MCR Centre of Epidemiology for Child Health, UCL Institute of Child Health 30 Guilford Street
London WC1N 1EH, UK; E-Mail: h.pan@ucl.ac.uk
5 Pennington Biomedical Research Center, Louisiana State University, 6400 Perkins Rd.,
Baton Rouge, LA 70808, USA; E-Mail: Peter.Katzmarzyk@pbrc.edu
* Author to whom correspondence should be addressed; E-Mail: jmaia@fade.up.pt; Tel.: +351-220-425-248; Fax: +351-225-500-689.
Academic Editor: Paul B. Tchounwou
Received: 11 February 2015 / Accepted: 2 March 2015 / Published: 9 March 2015
Abstract: This study aimed to provide height, body mass, BMI and waist circumference (WC) growth centile charts for school-children, aged 4–17 years, from central Peru, and to compare Peruvian data with North-American and Argentinean references. The sample consisted of 8753 children and adolescents (4130 boys and 4623 girls) aged 4 to 17 years, from four Peruvian cities: Barranco, La Merced, San Ramón and Junín. Height, body mass and WC were measured according to standardized techniques. Centile curves for height, body mass, BMI and WC were obtained separately for boys and girls using the LMS method. Student t-tests were used to compare mean values. Overall boys have higher median heights than girls, and the 50th percentile for body mass increases curvilinearly from 4 years of age onwards. In boys, the BMI and WC 50th percentiles increase linearly and in girls, the
increase presents a curvilinear pattern. Peruvian children are shorter, lighter and have higher BMI than their counterparts in the U.S. and Argentina; in contrast, age and sex-specific WC values are lower. Height, body mass and WC of Peruvian children increased with age and variability was higher at older ages. The growth patterns for height, body mass, BMI and WC among Peruvian children were similar to those observed in North-American and Argentinean peers.
Keywords: centile curves; reference values; schoolchildren
1. Introduction
Growth is a multifaceted process where increases in body size lead to morphological and functional changes. This process is determined by biological factors that show a high degree of sensitivity to environmental stimuli which tempers the expression of genetic potential [1,2]. As a result, sizeable variation across populations in growth patterns exists [3].
There is a general consensus that child growth is a putative health and nutrition marker of quality of life [4,5] and, therefore, monitoring growth is an important public health task. In 2006, the World Health Organization (WHO) published normative centile charts [6] based on data from the multicentre growth reference study including highly selective samples of infants and native children from Davis (United States), Accra (Ghana), Muscat (Oman), Oslo (Norway), Pelotas (Brazil), and Delhi (India). Notwithstanding the importance of international standards, data from local samples seem to be more informative [7–9] and centile curves for height and body mass have been published in central and south America, namely in Argentina [10], Bolivia [11], Brazil [12–14], Cuba [15] and Venezuela [16].
To the best of our knowledge no national charts for height, body mass, body mass index (BMI) and waist circumference (WC) are available in Peru. Peru is a country on the central western coast of South America facing the Pacific Ocean with a territorial surface of 1.3 million km2, 28 million inhabitants and
a population density of 23.5 inhabitants per km2. This large territory represents a wide range of geographic, socio-economic, ethnic and cultural conditions [17]. For simplicity, Peru can be described as having three natural regions: coast, mountain and jungle. The Peruvian population includes descendants of Amerindians, European-Spanish, Afro-Americans, Chinese, and a mixture of these groups. According to the recent classification of the International Monetary Fund, Peru belongs to a class of emerging and developing economies with a Human Development Index (HDI) of 0.74 and a life expectancy at birth of 74.2 years [17,18].
2. Methods 2.1. Sample
The participants came from the ‘Optimal and Healthy Growth Study’ (OHGS), a cross-sectional study carried out in Peru between March 2009 and June 2011. In total, 8753 children and adolescents (4130 boys and 4623 girls) aged 4 to 17 years were randomly selected from 31 public schools belonging to four cities at different altitudes: Barranco (50 m above sea level), La Merced and San Ramón (700 m and 750 m above sea level, respectively) and Junín (4130 m above sea level) (see Figure 1 and Tables 1 and 2). All schoolchildren enrolled in the 31 schools located in the four cities were invited to participate. The response rate was 98.4%. The ethical committee of the National University of Education Enrique Guzmán y Valle and the school directors approved the OHGS. Informed consent was obtained from parents and/or legal guardians of the participants.
Figure 1. South America and representation of the region of the Andes. Location of the Peruvian cities indicated in the present study.
2.2. Measures
All measurements were made according to standardized techniques [23]. Height was measured to the nearest 0.1 cm with a portable stadiometer (Model ES-2060, Sanny, São Paulo, Brazil). Body mass was measured to the nearest 0.1 kg using a digital scale (Model IP68, Pesacon, Lima, Peru). BMI was obtained by the ratio of body mass to height (kg/m2). WC was measured with a non-stretchable fibreglass
Table 1. Geographic, socioeconomic and educational characteristics of Peru.
Characteristics Peru
Total population 30135875
Official language and co-official Spanish/Quechua/Aymara
Ethnic composition Amerindians, European-Spanish
Afro-Americans, Asiatic
Total population of school children (Regular basic education)
Public 5467305 (75.8%)
Private 1746707 (24.2%)
Urban 5709700 (79.2%)
Rural 1504312 (20.8%)
Boys 3701958 (51.3%)
Girls 3512054 (48.7%)
Geographical characteristics
Area (km²) 1,285,216.20
Population density (people/km²) 23.5
Altitude (m) 0–6768
Socioeconomic characteristics
Human Development Index (HDI) 0.74
Life expectancy at birth (years) 74.2
Education (%) 1 85.7
Literacy (%) 2 92.9
Per capita family income (NS per month) 374.1
Primary production Mining/Fishery/Trade/Tourism
Agriculture/Stockbreeding
Notes: 1 School age population that attends school. 2 Person of 15 or more years who can read and write.
Table 2. Number of school children in the three areas of central Peru according to age and sex.
Age Sea Level Rainforest Area High Altitude Total
Barranco Chanchamayo Junín
(years) Girls Boys Girls Boys Girls Boys Girls Boys
4 91 90 123 92 24 23 238 205
5 84 69 128 139 45 36 257 244
6 104 91 149 146 45 52 298 289
7 76 52 140 192 55 47 271 291
8 82 64 178 174 47 60 307 298
9 119 76 187 184 65 76 371 336
10 85 84 218 189 70 71 373 344
11 111 114 193 189 73 55 377 358
12 92 119 237 144 134 90 463 353
13 69 64 212 144 76 92 357 300
14 125 102 187 120 109 102 421 324
15 110 142 150 151 98 85 358 378
16 139 82 132 118 105 84 376 284
17 60 40 41 44 55 42 156 126
Total 1347 1189 2275 2026 1001 915 4623 4130
2.3. Data Quality Control
The field team members were first trained by experienced anthropometrists for accurate anatomical landmarks, subject positioning and measurement techniques. Secondly, a random sample of 211 children and adolescents were re-measured during the first three weeks of data collection. Technical errors of measurement (TEM), and ANOVA-based intraclass correlation coefficients (R) were used to estimate the degree of precision and the proportion of the variation in measurements. TEM and R were as follows: 0.2 cm, 0.92 (height), 0.1 kg, 0.98 (body mass) and 0.9 cm, 0.92 (WC).
2.4. Statistical Analyses
Height, body mass, BMI and WC centiles were obtained for boys and girls separately using the LMS method [24] implemented in the LMSchartmaker Pro version 2.54 software [25]. The LMS method assumes that the outcome variable has a normal distribution after a Box-Cox power transformation is applied. Three smoothing and specific curves for each age were obtained via penalized maximum likelihood, namely: M (median), L (Box-Cox transformation) and S (coefficient of variation). The equation to derive the centiles is the following:
C100α (t) = M (t) [1 + L (t) S (t) Zα] 1/L (t)
where Zα is the normal equivalent deviate for tail area α, C100α (t) is the centile corresponding to Zα.
Equivalent degrees of freedom (edf) for L(t), M(t) and S(t) measure the complexity of each fitted curve. The appropriate number of degrees of freedom was selected on the basis of the deviance, Q-tests and worm plots following the suggestions of Royston and Wright [26], van Buuren and Fredricks [27] and Pan and Cole [25,28]. The 3rd, 10th, 25th, 50th, 75th, 90th, and 97th percentiles were chosen as age- and gender-specific reference values. The proportion of the data in the channels around the seven fitted centiles was compared to the expected values of the normal distribution in each centile, showing their closeness to the expected distribution for each of the four growth characteristics, confirming a good fit (Table 3).
Student t-tests were used to compare the mean values of Peruvian children with North-Americans and Argentinean counterparts. Height, body mass and BMI data from American children come from the report submitted by the Centers for Disease Control and Prevention that provides United States growth charts [19]; WC percentiles values were derived from the combination of NHANES III (1988–1994), NHANES 1999–2006, Bogalusa Heart Study (1992–1994) and Fels Longitudinal Study (1976–1996) samples [20]. The WC was measured just above the uppermost lateral border of the right ilium (NHANES) and in the other studies halfway between the lowest rib and the top edge of the iliac crest.
Table 3. Distribution of Z-score of height, body mass, BMI and waist circumference for the Peru sample compared to expectation assuming normality-area between adjacent centiles (%).
Centile Expected
(%)
Height (%) Body mass (%) BMI (%) WC (%)
Girls Boys Girls Boys Girls Boys Girls Boys
(n = 4587) (n = 4090) (n = 4586) (n = 4098) (n = 4579) (n = 4090) (n = 4588) (n = 4093)
3 3 3.0 2.8 2.9 3.2 2.8 2.9 3.0 3.4
10 7 7.7 7.4 7.7 6.7 7.0 7.3 7.5 6.4
25 15 14.7 15.2 14.7 15.9 15.7 14.9 15.1 15.4
50 25 24.8 24.5 24.2 24.1 24.7 25.6 24.6 25.8
75 25 24.8 25.0 24.9 24.6 24.6 24.2 24.7 24.5
90 15 14.4 14.5 14.5 14.7 14.1 13.5 13.6 13.3
97 7 7.5 7.3 7.8 7.3 7.8 8.1 7.9 7.5
3. Results
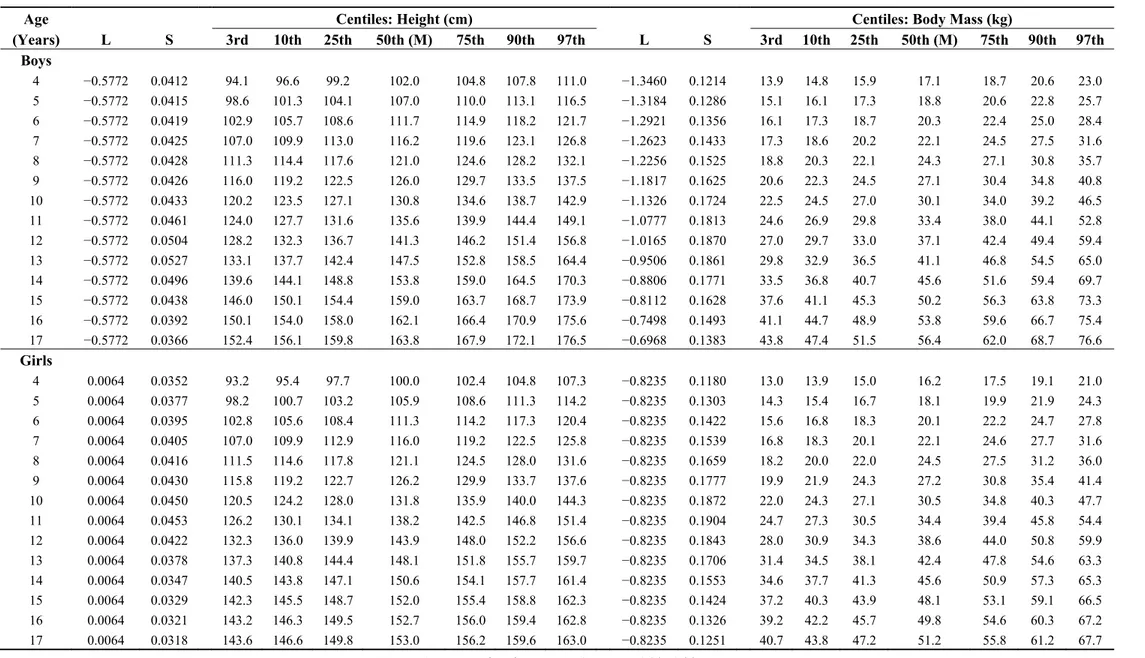
Age- and gender-specific values for the 3rd, 10th, 25th, 50th, 75th, 90th, and 97th centiles are presented in Figure 2 and Tables 4 and 5. The medians for height increase linearly from 4 to 14 years in boys and from 4 to 11 years in girls, and gradually level off, reaching a value of 165 cm in boys and 153 cm in girls. The increase is higher in boys than in girls. The P50 values for body mass increase curvilinearly from 4 years of age onward; the increase is stepper from 11 to 14 years in boys and from 9 to 11 years in girls. Maximum values are achieved at 17 years for girls (52.3 kg) and boys (58.5 kg).
Smoothed centiles for BMI and WC are presented in Figure 2 and Table 5. The BMI shows a decline from 4 to 6 years of age and then increases linearly in boys and curvilinearly in girls. At 17 years of age, the BMI of boys and girls are 22.2 kg/m2 and 21.5 kg/m2, respectively. The variability increases with
increasing age. As for the BMI, the P50 values for WC increase linearly in boys and curvilinearly in girls through 4 to 17 years of age. The median for WC at 17 years old is 72.8 cm in boys and 70.1 cm in girls. Variability of WC also increases with age and is higher at 17 years old.
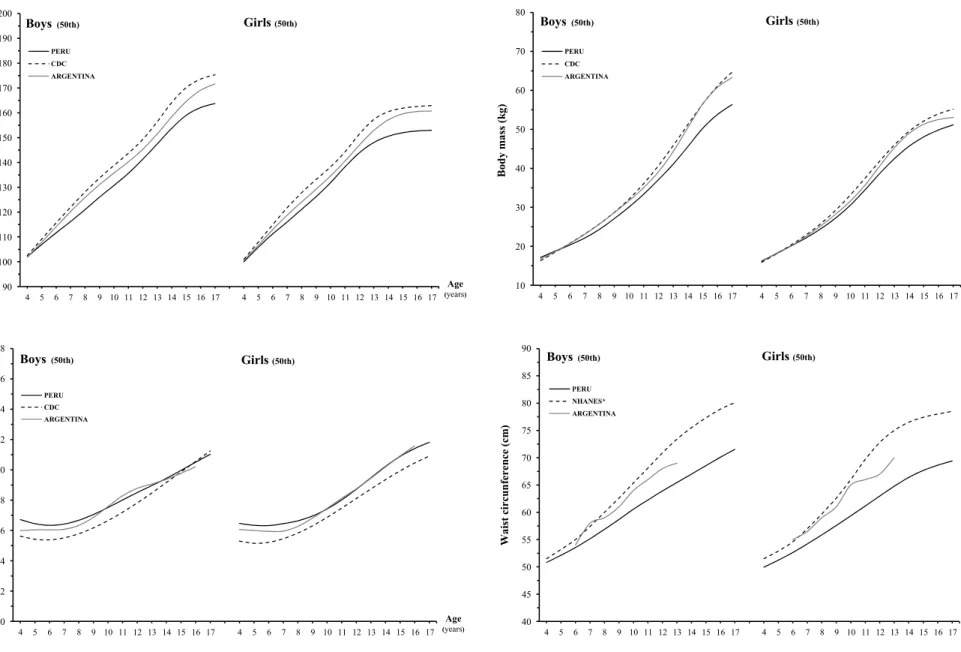
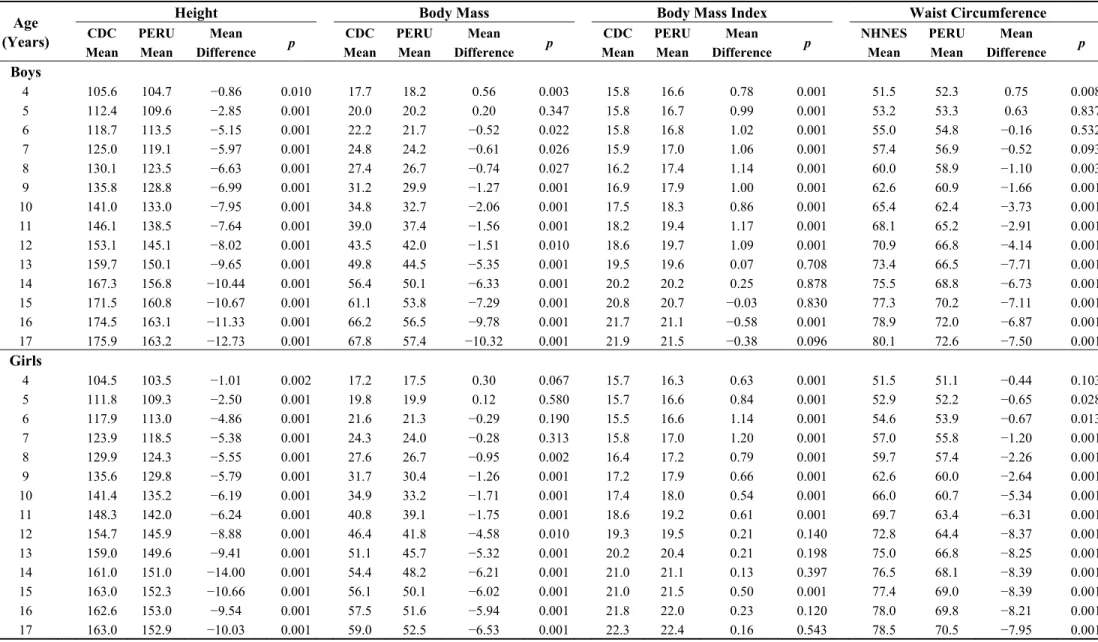
Figure 3 displays the 50th centiles for height, body mass, BMI and WC of Peruvian children against North-American [19,20], and Argentinean [10,21,22] counterparts. Tables 6 and 7 provides means, mean differences and p values for these growth characteristics. The Peruvian boys are shorter than North-American and Argentinean peers. The average difference between Peruvian and North-North-American boys is ~7.8 cm and between Peruvian and Argentinean is ~4.5 cm. Corresponding values for girls are ~7.0 cm and ~4.1 cm. For body mass, Peruvian boys and girls are lighter than North-American and Argentinean counterparts. The differences between Peruvian and North-American children are ~4.1 kg in boys and ~2.8 kg in girls. The differential between Peruvian and Argentinean children is ~3.4 kg (boys) and 1.6 kg (girls). For BMI, Peruvian boys have higher mean values than North-American peers and the difference is ~0.8 kg/m2. In girls, the difference is ~0.9 kg/m2 in the age interval 4–17 years. The differential between Peruvian and Argentinean boys and girls is ~0.4 kg/m2 between 4 and 9 years of
Figure 2. Smoothed reference curves for the 3rd, 10th, 25th, 50th, 75th, 90th and 97th percentiles for height, body mass, body mass index and waist circumference in 4 to 17 year-old Peruvian boys and girls.
10 20 30 40 50 60 70 80 90
4 5 6 7 8 9 10 11 12 13 14 15 16 17
Age (years) Bod y m a ss ( kg ) Girls 97th 90th 50th 25th 75th 3rd 10th 10 20 30 40 50 60 70 80 90
4 5 6 7 8 9 10 11 12 13 14 15 16 17
Age (years) 97th 90th 50th 25th 75th 3rd 10th Body mass ( kg ) Boys 90 100 110 120 130 140 150 160 170 180 190
4 5 6 7 8 9 10 11 12 13 14 15 16 17
Age (years) Heigh t (c m ) Girls 97th 90th 50th 25th 75th 3rd 10th 90 100 110 120 130 140 150 160 170 180 190
4 5 6 7 8 9 10 11 12 13 14 15 16 17
Age (years) Heig ht ( cm ) Boys 97th 90th 50th 25th 75th 3rd 10th 10 12 14 16 18 20 22 24 26 28 30 32 34 36
4 5 6 7 8 9 10 11 12 13 14 15 16 17
Age (years) Bo dy m a ss index ( kg /m ² ) Girls 97th 90th 50th 25th 75th 3rd 10th 10 12 14 16 18 20 22 24 26 28 30 32 34 36
4 5 6 7 8 9 10 11 12 13 14 15 16 17
Age (years) Bo dy m a ss index ( kg /m ² ) Boys 97th 90th 50th 25th 75th 3rd 10th 40 44 48 52 56 60 64 68 72 76 80 84 88 92 96
4 5 6 7 8 9 10 11 12 13 14 15 16 17
Age (years) Wa is t ci rc u n feren ce ( cm ) Girls 97th 90th 50th 25th 75th 3rd 10th 40 44 48 52 56 60 64 68 72 76 80 84 88 92 96
4 5 6 7 8 9 10 11 12 13 14 15 16 17
Table 4. Age- and sex-specific percentiles of height (cm) and body mass (kg) for school-aged Peruvian children and adolescents.
Age Centiles: Height (cm) Centiles: Body Mass (kg)
(Years) L S 3rd 10th 25th 50th (M) 75th 90th 97th L S 3rd 10th 25th 50th (M) 75th 90th 97th
Boys
4 −0.5772 0.0412 94.1 96.6 99.2 102.0 104.8 107.8 111.0 −1.3460 0.1214 13.9 14.8 15.9 17.1 18.7 20.6 23.0 5 −0.5772 0.0415 98.6 101.3 104.1 107.0 110.0 113.1 116.5 −1.3184 0.1286 15.1 16.1 17.3 18.8 20.6 22.8 25.7 6 −0.5772 0.0419 102.9 105.7 108.6 111.7 114.9 118.2 121.7 −1.2921 0.1356 16.1 17.3 18.7 20.3 22.4 25.0 28.4 7 −0.5772 0.0425 107.0 109.9 113.0 116.2 119.6 123.1 126.8 −1.2623 0.1433 17.3 18.6 20.2 22.1 24.5 27.5 31.6 8 −0.5772 0.0428 111.3 114.4 117.6 121.0 124.6 128.2 132.1 −1.2256 0.1525 18.8 20.3 22.1 24.3 27.1 30.8 35.7 9 −0.5772 0.0426 116.0 119.2 122.5 126.0 129.7 133.5 137.5 −1.1817 0.1625 20.6 22.3 24.5 27.1 30.4 34.8 40.8 10 −0.5772 0.0433 120.2 123.5 127.1 130.8 134.6 138.7 142.9 −1.1326 0.1724 22.5 24.5 27.0 30.1 34.0 39.2 46.5 11 −0.5772 0.0461 124.0 127.7 131.6 135.6 139.9 144.4 149.1 −1.0777 0.1813 24.6 26.9 29.8 33.4 38.0 44.1 52.8 12 −0.5772 0.0504 128.2 132.3 136.7 141.3 146.2 151.4 156.8 −1.0165 0.1870 27.0 29.7 33.0 37.1 42.4 49.4 59.4 13 −0.5772 0.0527 133.1 137.7 142.4 147.5 152.8 158.5 164.4 −0.9506 0.1861 29.8 32.9 36.5 41.1 46.8 54.5 65.0 14 −0.5772 0.0496 139.6 144.1 148.8 153.8 159.0 164.5 170.3 −0.8806 0.1771 33.5 36.8 40.7 45.6 51.6 59.4 69.7 15 −0.5772 0.0438 146.0 150.1 154.4 159.0 163.7 168.7 173.9 −0.8112 0.1628 37.6 41.1 45.3 50.2 56.3 63.8 73.3 16 −0.5772 0.0392 150.1 154.0 158.0 162.1 166.4 170.9 175.6 −0.7498 0.1493 41.1 44.7 48.9 53.8 59.6 66.7 75.4 17 −0.5772 0.0366 152.4 156.1 159.8 163.8 167.9 172.1 176.5 −0.6968 0.1383 43.8 47.4 51.5 56.4 62.0 68.7 76.6
Girls
4 0.0064 0.0352 93.2 95.4 97.7 100.0 102.4 104.8 107.3 −0.8235 0.1180 13.0 13.9 15.0 16.2 17.5 19.1 21.0 5 0.0064 0.0377 98.2 100.7 103.2 105.9 108.6 111.3 114.2 −0.8235 0.1303 14.3 15.4 16.7 18.1 19.9 21.9 24.3 6 0.0064 0.0395 102.8 105.6 108.4 111.3 114.2 117.3 120.4 −0.8235 0.1422 15.6 16.8 18.3 20.1 22.2 24.7 27.8 7 0.0064 0.0405 107.0 109.9 112.9 116.0 119.2 122.5 125.8 −0.8235 0.1539 16.8 18.3 20.1 22.1 24.6 27.7 31.6 8 0.0064 0.0416 111.5 114.6 117.8 121.1 124.5 128.0 131.6 −0.8235 0.1659 18.2 20.0 22.0 24.5 27.5 31.2 36.0 9 0.0064 0.0430 115.8 119.2 122.7 126.2 129.9 133.7 137.6 −0.8235 0.1777 19.9 21.9 24.3 27.2 30.8 35.4 41.4 10 0.0064 0.0450 120.5 124.2 128.0 131.8 135.9 140.0 144.3 −0.8235 0.1872 22.0 24.3 27.1 30.5 34.8 40.3 47.7 11 0.0064 0.0453 126.2 130.1 134.1 138.2 142.5 146.8 151.4 −0.8235 0.1904 24.7 27.3 30.5 34.4 39.4 45.8 54.4 12 0.0064 0.0422 132.3 136.0 139.9 143.9 148.0 152.2 156.6 −0.8235 0.1843 28.0 30.9 34.3 38.6 44.0 50.8 59.9 13 0.0064 0.0378 137.3 140.8 144.4 148.1 151.8 155.7 159.7 −0.8235 0.1706 31.4 34.5 38.1 42.4 47.8 54.6 63.3 14 0.0064 0.0347 140.5 143.8 147.1 150.6 154.1 157.7 161.4 −0.8235 0.1553 34.6 37.7 41.3 45.6 50.9 57.3 65.3 15 0.0064 0.0329 142.3 145.5 148.7 152.0 155.4 158.8 162.3 −0.8235 0.1424 37.2 40.3 43.9 48.1 53.1 59.1 66.5 16 0.0064 0.0321 143.2 146.3 149.5 152.7 156.0 159.4 162.8 −0.8235 0.1326 39.2 42.2 45.7 49.8 54.6 60.3 67.2 17 0.0064 0.0318 143.6 146.6 149.8 153.0 156.2 159.6 163.0 −0.8235 0.1251 40.7 43.8 47.2 51.2 55.8 61.2 67.7
Table 5. Age- and sex-specific percentiles of body mass index (kg/m²) and waist circumference (cm) for school-aged Peruvian children and adolescents.
Age Centiles: Body Mass Index (kg/m²) Centiles: Waist Circumference (cm)
(Years) L S 3rd 10th 25th 50th (M) 75th 90th 97th L S 3rd 10th 25th 50th (M) 75th 90th 97th
Boys
4 −2.2535 0.0753 14.6 15.2 15.8 16.7 17.6 18.7 20.2 −1.5809 0.0660 45.1 46.8 48.7 50.8 53.2 55.9 58.9 5 −2.2535 0.0824 14.3 14.9 15.6 16.4 17.4 18.6 20.1 −1.7335 0.0694 46.0 47.8 49.9 52.1 54.7 57.7 61.1 6 −2.2535 0.0896 14.1 14.7 15.4 16.3 17.4 18.7 20.5 −1.8922 0.0730 47.1 49.0 51.1 53.5 56.3 59.6 63.5 7 −2.2535 0.0972 14.0 14.7 15.5 16.4 17.6 19.0 21.1 −2.0652 0.0772 48.2 50.2 52.5 55.1 58.2 61.9 66.4 8 −2.2535 0.1048 14.0 14.8 15.6 16.7 18.0 19.6 22.0 −2.2483 0.0820 49.5 51.6 54.0 56.9 60.3 64.5 69.8 9 −2.2535 0.1113 14.2 15.0 15.9 17.1 18.5 20.3 23.1 −2.4370 0.0867 50.8 53.0 55.6 58.7 62.5 67.2 73.5 10 −2.2535 0.1160 14.5 15.3 16.3 17.5 19.1 21.2 24.2 −2.6247 0.0903 52.2 54.5 57.2 60.6 64.6 69.9 77.2 11 −2.2535 0.1186 14.9 15.7 16.7 18.0 19.6 21.9 25.2 −2.8058 0.0920 53.6 56.0 58.8 62.3 66.5 72.2 80.5 12 −2.2535 0.1191 15.3 16.2 17.2 18.5 20.2 22.5 26.0 −2.9769 0.0917 55.0 57.5 60.4 63.9 68.3 74.2 83.0 13 −2.2535 0.1177 15.7 16.6 17.6 19.0 20.7 23.1 26.7 −3.1406 0.0895 56.5 59.0 61.9 65.5 69.8 75.7 84.8 14 −2.2535 0.1150 16.2 17.0 18.1 19.4 21.1 23.6 27.2 −3.3097 0.0859 58.2 60.6 63.5 67.0 71.3 77.0 86.0 15 −2.2535 0.1117 16.7 17.6 18.6 20.0 21.7 24.1 27.7 −3.4879 0.0811 60.2 62.4 65.1 68.5 72.8 78.4 86.9 16 −2.2535 0.1083 17.2 18.1 19.2 20.5 22.2 24.6 28.1 −3.6608 0.0765 62.1 64.3 66.9 70.1 74.2 79.6 87.7 17 −2.2535 0.1049 17.7 18.6 19.7 21.0 22.7 25.0 28.5 −3.8214 0.0725 63.7 65.9 68.4 71.5 75.5 80.7 88.4
Girls
4 −1.2523 0.0784 14.2 14.9 15.6 16.5 17.3 18.3 19.5 −2.2787 0.0670 44.4 46.0 47.9 49.9 52.3 55.2 58.6 5 −1.2523 0.0889 13.9 14.6 15.4 16.3 17.3 18.4 19.7 −2.2787 0.0725 45.2 46.9 48.9 51.2 53.9 57.1 61.1 6 −1.2523 0.0982 13.7 14.5 15.3 16.3 17.4 18.6 20.0 −2.2787 0.0780 46.1 47.9 50.1 52.6 55.6 59.3 63.8 7 −1.2523 0.1066 13.6 14.4 15.4 16.4 17.6 19.0 20.7 −2.2787 0.0834 47.1 49.1 51.4 54.2 57.5 61.6 66.9 8 −1.2523 0.1156 13.6 14.5 15.5 16.6 17.9 19.5 21.7 −2.2787 0.0886 48.1 50.3 52.8 55.9 59.5 64.1 70.1 9 −1.2523 0.1255 13.6 14.6 15.7 17.0 18.4 20.4 22.8 −2.2787 0.0931 49.3 51.6 54.3 57.6 61.6 66.6 73.4 10 −1.2523 0.1341 13.8 14.8 16.0 17.4 19.2 21.3 24.2 −2.2787 0.0959 50.6 53.1 55.9 59.4 63.6 69.0 76.4 11 −1.2523 0.1397 14.2 15.2 16.5 18.0 19.9 22.3 25.4 −2.2787 0.0965 52.1 54.6 57.6 61.2 65.6 71.2 78.9 12 −1.2523 0.1413 14.7 15.8 17.1 18.7 20.7 23.2 26.5 −2.2787 0.0953 53.8 56.3 59.4 63.0 67.5 73.2 80.9 13 −1.2523 0.1386 15.4 16.5 17.8 19.5 21.5 24.0 27.4 −2.2787 0.0926 55.5 58.1 61.1 64.8 69.2 74.9 82.4 14 −1.2523 0.1332 16.1 17.2 18.6 20.2 22.2 24.7 28.1 −2.2787 0.0894 57.1 59.7 62.8 66.4 70.8 76.3 83.5 15 −1.2523 0.1271 16.7 17.9 19.3 20.9 22.8 25.3 28.7 −2.2787 0.0866 58.5 61.1 64.1 67.7 72.0 77.4 84.3 16 −1.2523 0.1227 17.3 18.4 19.8 21.4 23.3 25.7 29.2 −2.2787 0.0845 59.5 62.1 65.1 68.6 72.9 78.2 85.0 17 −1.2523 0.1205 17.7 18.8 20.2 21.8 23.7 26.1 29.6 −2.2787 0.0829 60.3 62.9 65.9 69.4 73.6 78.8 85.5
Figure 3. Comparison of the age and sex specific 50th percentile values for height, body mass, body mass index and waist circumference between Peruvian boys and girls and those from North-America and Argentina.
90 100 110 120 130 140 150 160 170 180 190 200
4 5 6 7 8 9 10 11 12 13 14 15 16 17 4 5 6 7 8 9 10 11 12 13 14 15 16 17
PERU CDC ARGENTINA H eight (cm )
Boys(50th) Girls (50th)
Age
(years)
10 12 14 16 18 20 22 24 26 28
4 5 6 7 8 9 10 11 12 13 14 15 16 17 4 5 6 7 8 9 10 11 12 13 14 15 16 17
PERU CDC ARGENTINA B o d y m a ss ind ex (k g/m 2)
Boys(50th) Girls (50th)
Age
(years)
10 20 30 40 50 60 70 80
4 5 6 7 8 9 10 11 12 13 14 15 16 17 4 5 6 7 8 9 10 11 12 13 14 15 16 17
PERU CDC ARGENTINA Bo dy m a ss ( k g)
Boys (50th) Girls (50th)
Age
(years)
40 45 50 55 60 65 70 75 80 85 90
4 5 6 7 8 9 10 11 12 13 14 15 16 17 4 5 6 7 8 9 10 11 12 13 14 15 16 17
PERU NHANES* ARGENTINA Wa is t ci rc un fe re nce (c m )
Boys(50th) Girls (50th)
Age
Table 6. Results of mean differences between the CDC and Peruvian schoolchildren for height, body mass, body mass index and waist circumference from both sexes aged 4 to 17 years.
Age (Years)
Height Body Mass Body Mass Index Waist Circumference
CDC PERU Mean
p CDC PERU Mean p CDC PERU Mean p NHNES PERU Mean p
Mean Mean Difference Mean Mean Difference Mean Mean Difference Mean Mean Difference
Boys
4 105.6 104.7 −0.86 0.010 17.7 18.2 0.56 0.003 15.8 16.6 0.78 0.001 51.5 52.3 0.75 0.008 5 112.4 109.6 −2.85 0.001 20.0 20.2 0.20 0.347 15.8 16.7 0.99 0.001 53.2 53.3 0.63 0.837 6 118.7 113.5 −5.15 0.001 22.2 21.7 −0.52 0.022 15.8 16.8 1.02 0.001 55.0 54.8 −0.16 0.532 7 125.0 119.1 −5.97 0.001 24.8 24.2 −0.61 0.026 15.9 17.0 1.06 0.001 57.4 56.9 −0.52 0.093 8 130.1 123.5 −6.63 0.001 27.4 26.7 −0.74 0.027 16.2 17.4 1.14 0.001 60.0 58.9 −1.10 0.003 9 135.8 128.8 −6.99 0.001 31.2 29.9 −1.27 0.001 16.9 17.9 1.00 0.001 62.6 60.9 −1.66 0.001 10 141.0 133.0 −7.95 0.001 34.8 32.7 −2.06 0.001 17.5 18.3 0.86 0.001 65.4 62.4 −3.73 0.001 11 146.1 138.5 −7.64 0.001 39.0 37.4 −1.56 0.001 18.2 19.4 1.17 0.001 68.1 65.2 −2.91 0.001 12 153.1 145.1 −8.02 0.001 43.5 42.0 −1.51 0.010 18.6 19.7 1.09 0.001 70.9 66.8 −4.14 0.001 13 159.7 150.1 −9.65 0.001 49.8 44.5 −5.35 0.001 19.5 19.6 0.07 0.708 73.4 66.5 −7.71 0.001 14 167.3 156.8 −10.44 0.001 56.4 50.1 −6.33 0.001 20.2 20.2 0.25 0.878 75.5 68.8 −6.73 0.001 15 171.5 160.8 −10.67 0.001 61.1 53.8 −7.29 0.001 20.8 20.7 −0.03 0.830 77.3 70.2 −7.11 0.001 16 174.5 163.1 −11.33 0.001 66.2 56.5 −9.78 0.001 21.7 21.1 −0.58 0.001 78.9 72.0 −6.87 0.001 17 175.9 163.2 −12.73 0.001 67.8 57.4 −10.32 0.001 21.9 21.5 −0.38 0.096 80.1 72.6 −7.50 0.001
Girls
Table 7. Results of mean differences between Argentina and Peruvian schoolchildren for height, body mass, body mass index and waist circumference from both sexes aged 4 to 17 years.
Age (Years)
Height Body Mass Body Mass Index Waist Circumference
Argentina Peru Mean
p Argentina Peru Mean p Argentina Peru Mean p Argentina Peru Mean p
Mean Mean Difference Mean Mean Difference Mean Mean Difference Mean Mean Difference
Boys
4 101.9 104.7 2.84 0.001 16.7 18.2 1.49 0.001 16.0 16.6 0.59 0.001 5 107.9 109.6 1.64 0.001 18.7 20.2 1.52 0.001 16.0 16.7 0.70 0.001 6 114.2 113.5 −0.60 0.056 20.7 21.7 0.98 0.001 16.0 16.8 0.73 0.001 54.0 54.8 0.84 0.001 7 120.2 119.1 −1.17 0.001 23.1 24.2 1.14 0.001 16.1 17.0 0.88 0.001 58.0 56.9 −1.12 0.001 8 125.9 123.5 −2.44 0.001 25.7 26.7 1.02 0.002 16.3 17.4 1.05 0.001 59.0 58.9 −0.10 0.785 9 131.1 128.8 −2.25 0.001 28.6 29.9 1.35 0.001 16.9 17.9 1.07 0.001 61.0 60.9 −0.06 0.876 10 135.8 133.0 −2.75 0.001 31.7 32.7 1.03 0.011 17.6 18.3 0.76 0.001 64.0 62.4 −1.57 0.001 11 140.3 138.5 −1.80 0.001 35.0 37.4 2.40 0.001 18.3 19.4 1.06 0.001 66.0 65.2 −0.81 0.056 12 145.4 145.1 −0.26 0.572 39.1 42.0 2.88 0.001 18.8 19.7 0.90 0.001 68.0 66.8 −1.24 0.006 13 151.5 150.1 −1.44 0.006 44.3 44.5 0.19 0.745 19.1 19.6 0.50 0.005 69.0 66.5 −2.48 0.001 14 158.4 156.8 −1.56 0.001 50.5 50.1 −0.36 0.540 19.4 20.2 0.84 0.001 15 164.6 160.8 −3.74 0.001 56.5 53.8 −2.71 0.001 19.8 20.7 0.95 0.001 16 169.1 163.1 −5.96 0.001 60.8 56.5 −4.31 0.001 20.2 21.1 0.95 0.001
17 171.7 163.2 −8.48 0.001 63.3 57.4 −5.86 0.001
Girls
4 100.5 103.5 3.00 0.001 16.3 17.5 1.19 0.001 16.1 16.3 0.24 0.022 5 106.7 109.3 2.62 0.001 18.1 19.9 1.79 0.001 16.0 16.6 0.55 0.001 6 113.0 113.0 0.04 0.896 20.1 21.3 1.27 0.001 15.9 16.6 0.69 0.001 55.0 53.9 −1.07 0.001 7 118.8 118.5 −0.27 0.426 22.5 24.0 1.56 0.001 16.0 17.0 1.04 0.001 56.5 55.8 −0.70 0.025 8 124.1 124.3 0.20 0.571 25.2 26.7 1.46 0.001 16.3 17.2 0.89 0.001 59.0 57.4 −1.56 0.001 9 129.2 129.8 0.55 0.116 28.2 30.4 2.25 0.001 16.8 17.9 1.06 0.001 61.0 60.0 −1.04 0.005 10 134.6 135.2 0.62 0.109 31.5 33.2 1.64 0.001 17.5 18.0 0.51 0.001 65.0 60.7 −4.34 0.001 11 140.6 142.0 1.47 0.001 35.6 39.1 3.45 0.001 18.1 19.2 1.06 0.001 66.0 63.4 −2.61 0.001 12 147.0 145.9 −1.18 0.001 40.5 41.8 1.28 0.002 18.8 19.5 0.77 0.001 67.0 64.4 −2.57 0.001 13 152.9 149.6 −3.29 0.001 45.2 45.7 0.49 0.251 19.4 20.4 0.93 0.001 70.0 66.8 −3.25 0.001 14 157.2 151.0 −6.17 0.001 48.9 48.2 −0.71 0.089 20.2 21.1 0.90 0.001 15 159.6 152.3 −7.26 0.001 51.3 50.1 −1.23 0.002 20.9 21.5 0.63 0.001 16 160.5 153.0 −7.53 0.001 52.5 51.6 −0.91 0.091 21.6 22.0 0.43 0.004
4. Discussion
Since the last century, Peru, as well as other Latin American countries, are experiencing epidemiological and nutritional transitions with not only dramatic decreases in malnutrition and stunting, but also increases in obesity [29]. Furthermore, over the last decade the Peruvian population has undergone significant changes in living conditions that are highly related to the overall improvement in their economy and general health status [18]. In this context, the use of simple, reliable and valid anthropometric indicators such as height, body mass, BMI, and WC, as well as their respective centile charts, are highly valuable tools in public health surveillance and epidemiology [9].
The trends in height, body mass, BMI and WC of Peruvian children and adolescents were similar to other international data. In height and body mass, the individual variation expressed in terms of the range between the 3rd and 97th percentiles increased progressively with age through childhood and adolescence. Furthermore, there is high inter-individual variation starting at an early age and clearly expressed in the upper centiles. Additionally, the adiposity rebound starting at age 6–7 years was noted in Peruvian children and parallels the study of Rolland-Cachera et al. [30].
The lower stature and body mass of Peruvian children and adolescents in relation to North-American and Argentinean counterparts may be a result of genetic, geographical, cultural and socio-economic factors [33–35]. However, socio-economic factors deserve further attention. It is well known that the economic situation in Peru has gradually improved in the last decade, which possibly gave rise to better life conditions to important sectors of the population [17]. However, a sustained economic growth may not be enough to quench the poverty. In 2011, 17.8% of children under the age of 5 years suffered from chronic malnutrition, 7.8% suffered from global malnutrition and 1.5% suffered from acute malnutrition; in addition, 27.6% of pregnant women suffered from anemia [41]. Notwithstanding, these rates have decreased in recent years. A 2012 report of the INS revealed a prevalence of overweight and obesity of 6.4% and 1.8%, respectively, in children less than 5 years of age [42]. It was also reported that 34.4% of pregnant women were overweight, while 12.7% had shortfalls of weight, affecting in 2011 to nearly one of every eight women [41]. Furthermore, the prevalence of overweight and obesity in Peruvian children, aged 6–11 years, was 21.7% and 7%, respectively [43].
Height, body mass, BMI and WC centile charts provided in this article are based on data from a cross-sectional study of children and adolescents who attended public schools in Peru central region. In very general terms, they provide novel and useful information for monitoring the growth of children, as well as for the identification of children that maybe at risk of obesity, stunting and wasting, and maybe related to high central obesity given WC upper centiles. It represents an advance in the perspective of having national references. Notwithstanding the relevance of the present information, at least four limitations have to be stated: (1) despite the size of our sample, it is not representative of the total children and adolescents´ Peruvian population; (2) the cross-sectional outline of this study does not allow to dynamically analyze intra-individual changes that occur throughout the growing period as a result of complex biological and environmental interactions; (3) no information is presently available about the racial/ethnic composition of Peruvian schoolchildren, and so we were not able to stratify our sample according to this condition. Yet, we are confident that the present charts reflect Peruvian children and adolescent physical growth and will be useful to clinicians and educators throughout the country; (4) although the Argentinian data are 30–45 years old, they were recently (5 years ago) updated using LMS to provide growth charts. In addition, WC is frequently measured at different anatomical landmarks which cause problems with comparisons. We ask the readers to bear this information in mind.
5. Conclusions
Acknowledgments
The authors are grateful to the Portuguese Foundation for science and technology by the child support grant (SFRH/BD/43305/2008). The authors thank all the schoolchildren of Barranco, Junín, San Ramon and La Merced who participated in this study. Also thank all the students and teachers of the UNE’s Physical Education who contributed in the data collection. Finally, a recognition to Gaston Beunen† who was one of the promoters of the Healthy and Optimistic Growth Study.
Author Contributions
Alcibiades Bustamante collected the data, undertook the data analysis and interpretation, and led the writing of the article. Duarte Freitas, Huiqi Pan and Peter T. Katzmarzyk contributed to drafting the paper and interpreting data analyses. José Maia conceptualized and designed the study, organized and supervised data collection and management, and contributed to drafting the paper. All authors read and approved the final manuscript.
Conflicts of Interest
The authors report no conflicts of interest. The authors alone are responsible for the content and writing of the paper.
References
1. Ulijaszek, S.J. The international growth standard for children and adolescents project: Environmental influences on preadolescent and adolescent growth in weight and height. Food Nutr. Bull. 2006, 27, S279–S294.
2. Thomis, M.A.; Towne, B. Genetic determinants of prepubertal and pubertal growth and
development. Food Nutr. Bull. 2006, 27, S257–S278.
3. Eveleth, P.B.; Tanner, J.M. Worldwide Variation in Human Growth, 2nd ed.; Cambridge University Press: Cambridge, UK, 1990.
4. Molinari, L.; Gasser, T.; Largo, R.H. Tw3 bone age: Rus/cb and gender differences of percentiles for score and score increments. Ann. Hum. Biol. 2004, 31, 421–435.
5. Tanner, J.M. Growth as a mirror of the condition of society: Secular trends and class distinctions.
Acta Paediatr. Jpn. Overseas Ed. 1987, 29, 96–103.
6. Butte, N.E.; Garza, C.; de Onis, M. Evaluation of the feasibility of international growth standards for school-aged children and adolescents. Food Nutr. Bull. 2006, 27, S169–S174.
7. Goldstein, H.; Tanner, J.M. Ecological considerations in the creation and the use of child growth standars. Lancet 1980, 1, 582–585.
8. Kulaga, Z.; Litwin, M.; Tkaczyk, M.; Rozdzynska, A.; Barwicka, K.; Grajda, A.; Swiader, A.; Gurzkowska, B.; Napieralska, E.; Pan, H. The height-, weight-, and bmi-for-age of polish school-aged children and adolescents relative to international and local growth references.
9. De Onis, M.; Garza, C. Rationale for developing a new international growth standard. In The Who Multicentre Growth Reference Study (Mgrs): Rationale, Planning, and Implementation; de Onis, M., Garza, C., Victora, C.G., Bhan, M.K., Norum, K.R., Eds.; Food and Nutrition Bulletin: Tokyo, Japan, 2004; Volume 25 (Suppl. 1), S5–S14.
10. Lejarraga, H.; del Pino, M.; Fano, V.; Caino, S.; Cole, T.J. Growth references for weight and height for argentinian girls and boys from birth to maturity: Incorporation of data from the world health organisation from birth to 2 years and calculation of new percentiles and lms values. Arch. Argent. Pediatr. 2009, 107, 126–133.
11. Baya Botti, A.; Perez-Cueto, F.J.; Vasquez Monllor, P.A.; Kolsteren, P.W. Anthropometry of height, weight, arm, wrist, abdominal circumference and body mass index, for bolivian adolescents 12 to 18 years: Bolivian adolescent percentile values from the mesa study. Nutr. Hosp. 2009, 24, 304–311.
12. Guedes, D.P.; Guedes, J.R.P. Crescimento Composição Corporal e Desempenho Motor de Crianças e Adolescentes; Balieiro: São Paulo, Brazil, 1997.
13. Marcondes, E. Crescimento Normal e Deficiente, 3rd ed.; Sarvier: São Paulo, Brazil, 1989.
14. Silva, S.; Maia, J.; Claessens, A.L.; Beunen, G.; Pan, H. Growth references for brazilian children and adolescents: Healthy growth in cariri study. Ann. Hum. Biol. 2012, 39, 11–18.
15. Jordán, J.R. Desarrollo Humano en Cuba; Científico Técnica: La Habana, Cuba, 1979.
16. FUNDACREDESA. Cartas de Crecimiento. Available online: http://www.fundacredesa.gob.ve (accessed on 14 December 2008).
17. Instituto Nacional de Estadística e Informática. Perfil Sociodemográfico del Perú; INEI: Lima, Peru, 2008.
18. International Monetary Fund. Available online: http://www.imf.org/external/about.htm (accessed on 26 December 2013).
19. Kuczmarski, R.J.; Ogden, C.L.; Guo, S.S.; Grummer-Strawn, L.M.; Flegal, K.M.; Mei, Z.; Wei, R.; Curtin, L.R.; Roche, A.F.; Johnson, C.L. 2000 CDC growth charts for the united states: Methods and development. In Vital and Health Statistics. Series 11, Data from the National Health Survey; National Center for Health Statistics: Hyattsville, MD, USA, 2002; pp. 1–190.
20. Cook, S.; Auinger, P.; Huang, T.T. Growth curves for cardio-metabolic risk factors in children and adolescents. J. Pediatr. 2009, 155, S6.e15–S6.e26.
21. Alfaro, E.; Bejarano, I.; Dipierri, J.; Quispe, Y.; Cabrera, G. Percentilos de peso, talla e índice de masa corporal de escolares jujeños calculados por el método lms. Arch. Argent. Pediatr. 2004, 102, 431–439.
22. Hirschler, V.; Delfino, A.M.; Clemente, G.; Aranda, C.; Calcagno, M.d.L.; Pettinicchio, H.; Jadzinsky, M. ¿Es la circunferencia de cintura un componente del síndrome metabólico en la infancia? Arch. Argent. Pediatr. 2005, 103, 7–13.
23. Lohman, T.; Roche, A.; Martorell, R. Anthropometric Standardization Reference Manual; Human Kinetics Books: Champaign, IL, USA, 1988.
25. Pan, H.; Cole, T. Lmschartmaker Pro, version 2.54; Medical Research Council: London, UK, 2011. 26. Royston, P.; Wright, E.M. Goodness-of-fit statistics for age-specific reference intervals. Stat. Med.
2000, 19, 2943–2962.
27. Van Buuren, S.; Fredriks, M. Worm plot: A simple diagnostic device for modelling growth reference curves. Stat. Med. 2001, 20, 1259–1277.
28. Pan, H.; Cole, T.J. A comparison of goodness of fit tests for age-related reference ranges. Stat. Med. 2004, 23, 1749–1765.
29. Uauy, R.; Albala, C.; Kain, J. Obesity trends in latin america: Transiting from under-to overweight.
J. Nutr. 2001, 131, 893S–899S.
30. Rolland-Cachera, M.F.; Deheeger, M.; Bellisle, F.; Sempe, M.; Guilloud-Bataille, M.; Patois, E. Adiposity rebound in children: A simple indicator for predicting obesity. Am. J. Clin. Nutr. 1984,
39, 129–135.
31. Frisancho, A.R.; Baker, P.T. Altitude and growth: A study of the patterns of physical growth of a high altitude peruvian quechua population. Am. J. Phys. Anthropol. 1970, 32, 279–292.
32. Moore, L.G.; Niermeyer, S.; Zamudio, S. Human adaptation to high altitude: Regional and life-cycle perspectives. Am. J. Phys. Anthropol. 1998, 107, 25–64.
33. Greksa, L.P. Growth and development of andean high altitude residents. High Alt. Med. Biol. 2006,
7, 116–124.
34. Pawson, I.G.; Huicho, L.; Muro, M.; Pacheco, A. Growth of children in two economically diverse peruvian high-altitude communities. Am. J. Hum. Biol. 2001, 13, 323–340.
35. Hartinger, S.; Tapia, V.; Carrillo, C.; Bejarano, L.; Gonzales, G.F. Birth weight at high altitudes in Peru. Int. J. Gynaecol. Obstet.2006, 93, 275–281.
36. Dietz, W.H.; Bellizzi, M.C. Introduction: The use of body mass index to assess obesity in children.
Am. J. Clin. Nutr. 1999, 70, 123S–125S.
37. Janssen, I.; Katzmarzyk, P.T.; Ross, R. Waist circumference and not body mass index explains obesity-related health risk. Am. J. Clin. Nutr. 2004, 79, 379–384.
38. Hernandez-Diaz, S.; Peterson, K.E.; Dixit, S.; Hernandez, B.; Parra, S.; Barquera, S.; Sepulveda, J.; Rivera, J.A. Association of maternal short stature with stunting in mexican children: Common genes
vs common environment. Eur. J. Clin. Nutr. 1999, 53, 938–945.
39. Del-Rio-Navarro, B.E.; Velazquez-Monroy, O.; Santos-Preciado, J.I.; Lara-Esqueda, A.; Berber, A.; Loredo-Abdala, A.; Violante-Ortiz, R.; Tapia-Conyer, R. Mexican anthropometric percentiles for ages 10–18. Eur. J. Clin. Nutr. 2007, 61, 963–975.
40. Harrington, D.M.; Staiano, A.E.; Broyles, S.T.; Gupta, A.K.; Katzmarzyk, P.T. Waist
circumference measurement site does not affect relationships with visceral adiposity and cardiometabolic risk factors in children. Pediatr. Obes. 2013, 8, 199–206.
41. Instituto Nacional de Salud. Informe Gerencial Nacional Sien: Estado Nutricional en Niños Menores de 5 Años y Gestantes Que Acuden a los Establecimientos de Salud; INS: Lima, Peru, 2011; p. 27.
43. Bustamante, A.; Seabra, A.; Garganta, R.; Maia, J. Efectos de la actividad física y del nivel socioeconómico en el sobrepeso y obesidad de escolares, lima este 2005. Rev. Peru. Med. Exp. Salud Publica 2007, 24, 121–128.