BlueFriends: Measuring, analyzing and
preventing social exclusion between elementary
school students
Vítor Hugo Teixeira Belim
(Bachelor)
Thesis submitted for the Degree of Master In Computer Engineering at the University of Madeira
Mentor: Evangelos Karapanos, PhD
Advisors: Olga Lyra, PhD; Ruben Gouveia, MSc
A
BSTRACT
Social exclusion is a relatively recent term, whose creation is attributed to René Lenoir (Lenoir, 1974). Its concept covers a remarkably wide range of social and economic problems, and can be triggered for various reasons: mentally and physically handicapped, abused children, delinquents, multi-problem households, asocial people, and other social “misfits” (Silver, 1995, pp. 63; Foucault, 1992).
With an increasingly multi-cultural population, cultural and social inequalities rapidly ascend, bringing with them the need for educational restructuring. We are living in an ever-more diverse world, and children need to be educated to be receptive to the different types of people around them, especially considering social and cultural aspects. It is with these goals that inclusive education has seen an increased trend in today’s academic environment, reminding us that even though children may be taught under the same roof, discriminatory practices might still happen.
There are, however, a number of developed tools to assess the various dimensions of social networks. These are mostly based on questionnaires and interviews, which tend to be fastidious and don’t allow for longitudinal, large scale measurement.
This thesis introduces BlueFriends, a Bluetooth-based measurement tool for social inclusion/exclusion on elementary school classes. The main goals behind the development of this tool were a) understanding how exclusion manifests in students’ behaviors, and b) motivating pro-social behaviors on children through the use of a persuasive technology.
BlueFriends is a distributed application, comprised by an application running on several smartphones, a web-hosted database and a computer providing a visual representation of the data collected on a TV screen, attempting to influence children behaviors. The application makes use of the Bluetooth device present on each phone to continuously sample the RSSI (Received Signal Strength Indication) from other phones, storing the data locally on each phone. All of the stored data is collected, processed and then inserted into the database at the end of each day. At the beginning of each recess, children are reminded of how their behaviors affect others with the help of a visual display, which consists of interactions between dogs. This display illustrates every child’s best friends, as well as which colleagues they don’t interact with as much. Several tips encouraging social interaction and inclusiveness are displayed, inspiring children to change their behaviors towards the colleagues they spend less time with.
This thesis documents the process of designing, deploying and analyzing the results of two field studies. On the first study, we assess how the current developed tools are inferior to our measuring tool by deploying a measurement only study, aimed at perceiving how much information can be obtained by the BlueFriends application and attempting to understand how exclusion manifests itself in the school environment. On the second study, we pile on the previous to try and motivate pro-social behaviors on students, with the use of visual cues and recommendations.
K
EYWORDS
Social Exclusion; Interpersonal Behavior; Connectedness;
R
ESUMO
A exclusão social é um termo relativamente recente cuja origem é atribuída a René Lenoir (Lenoir, 1974). O seu conceito abrange uma variadíssima escala de problemas sociais e económicos, podendo ser desencadeado por diversas razões: deficiências motoras ou mentais, crianças vítimas de maus tratos, delinquentes, famílias problemáticas, pessoas socialmente inaptas ou desajustadas (Silver, 1995, pp. 63; Foucault, 1992).
Com uma população cada vez mais multicultural, desigualdades socioculturais rapidamente ascendem, dando azo a necessidades de restruturação educacional. Estamos a viver num mundo cada vez mais diverso, sendo que as crianças necessitam de ser educadas a serem recetivas aos diferentes tipos de pessoas à sua volta, especialmente tendo em conta aspetos sociais e culturais. É com estes objetivos que a educação inclusiva tem visto um aumento de tendência nos ambientes académicos atuais, lembrando-nos que apesar das crianças poderem ser ensinadas debaixo do mesmo teto, práticas discriminatórias ainda são passíveis de acontecer.
Há, no entanto, um número de ferramentas já desenvolvidas para avaliar às várias dimensões destas redes sociais. Estas são na sua maioria baseadas em questionários e entrevistas, cujas tendem a ser enfadonhas e não permitem medições longitudinais, e em grande escala.
Esta tese apresenta o BlueFriends, uma ferramenta de medição de inclusão/exclusão baseada em Bluetooth para escolas primárias. Os principais objetivos por detrás do desenvolvimento desta ferramenta são a) compreender como a exclusão manifesta-se nos comportamentos dos alunos, e b) motivar comportamento pró-sociais nas crianças através do uso de tecnologias persuasivas.
O BlueFriends é uma aplicação distribuída, composta de uma aplicação a correr em vários smartphones, uma base de dados e um computador que providencia uma representação visual da informação recolhida num ecrã panorâmico, com o objetivo de influenciar os comportamentos das crianças. A aplicação faz uso do dispositivo Bluetooth presente em cada telefone para continuamente recolher dados de IFSR (Indicação de Força de Sinal Recebida) de outros telefones, armazenando os dados localmente em cada telefone. Toda a informação armazenada é recolhida, processada e depois inserida na base de dados no final de cada dia. No princípio de cada intervalo, as crianças são relembradas de como os seus comportamentos afetam outros com a ajuda de um display visual, cujo consiste na interação entre cães. Este display ilustra os melhores amigos de cada criança, bem como os colegas com os quais a criança não interage tanto. Várias dicas que encorajam à interação social e inclusividade são exibidas, inspirando as crianças a modificar os seus comportamentos para com os seus colegas com os quais passam menos tempo.
seguimos o anterior e motivamos comportamentos pró-sociais nos estudantes, fazendo uso de pistas visuais e recomendações.
Ultimamente, nós confirmamos que os resultados inerentes à nossa ferramenta de medição foram satisfatórias relativamente à medição e modificação de comportamentos das crianças, e concluímos com algumas ideias para futuros melhoramentos, sugerindo algumas possíveis extensões e melhorias.
P
ALAVRAS
-
CHAVE
Exclusão Social;
Comportamento Interpessoal; Conexão;
A
CKNOWLEDGMENTS
First of all, my most sincere and appreciated thank you goes to Professor Evangelos Karapanos. His aid, dedication, persistence and guidance were essential in the development of this thesis. Without his upmost contribute, this thesis wouldn’t have been successfully completed.
To Rúben Gouveia, my honest recognition. His help, regarding the field study and data analysis were fundamental. To Gil Álvaro for his aid in the development of the Flash Application. To Olga Lyra, for her continuous support in the children’s behavioral aspect understanding. To Élton Gouveia, for always pushing me further and accompanying me in this journey.
A very special thank you goes to my girlfriend, Lígia Santos, who was restless and dedicated when I wasn’t. If it wasn’t for her help, the field study wouldn’t have been completed in time, neither would the thesis writing and ulterior delivery.
To my family: my mother, for never giving up on me and supporting me at all times; my father, for trusting and pushing me further always. I’m fortunate for having such hardworking and yet understanding parents. To my sister, because she’s the best sister someone could ask for.
To all the participants involved in the field study and all school personnel of Escola Básica do 1º Ciclo com Pré-Escolar Eng. Luís Santos. A special thank you to the school principal, Drª Sandra Gouveia, for the availability and cooperation during the deployment of this study.
T
ABLE OF
C
ONTENTS
I. Introduction
17
I.1.
Problem Statement... 17
I.2.
Objectives ... 18
I.3.
Methodological Approach ... 19
II. Study I – Measurement and Analysis of Social Inclusiveness
21
II.1.
Related Work ... 22
II.1.1. Exclusion ... 22
II.1.2. Inclusive Education ... 22
II.1.3. Introduction to Social Networks ... 25
II.2.
Field Study Method ... 29
II.2.1. Participants ... 29
II.2.2. Preparation ... 29
II.2.3. Constraints / Problems ... 33
II.2.4. Method ... 34
II.3.
Findings ... 36
II.3.1. Questionnaire Analysis ... 36
II.3.2. Proximity Measurement ... 52
II.4.
Discussion ... 68
III. Study II – Influencing Behavioral Changes Through Visual Cues
71
III.1.
Related Work ... 72
III.1.1. Sociometric and Behavioral Measurement ... 72
III.1.2. Influencing Behavioral Changes ... 73
III.2.
Field Study Method ... 74
III.2.1. Participants ... 74
III.2.3. Constraints / Problems ... 78
III.2.4. Method ... 79
III.3.
Findings ... 81
III.3.1. Proximity Measurement... 81
III.3.2. Qualitative Data ... 93
III.4.
Discussion ... 95
IV. Conclusion
97
V. Future Work
99
References
101
Appendix
105
Appendix A – Loneliness Scale ... 106
Appendix B – Peer Nomination Inventory ... 111
Appendix C – Diversity Checklist ... 112
Appendix D – Interpersonal Competence Scale ... 113
L
IST OF FIGURES
Figure 1- Simplified code of the Broadcast Receiver module. ... 30
Figure 2 - Subject disposition scheme for testing. ... 31
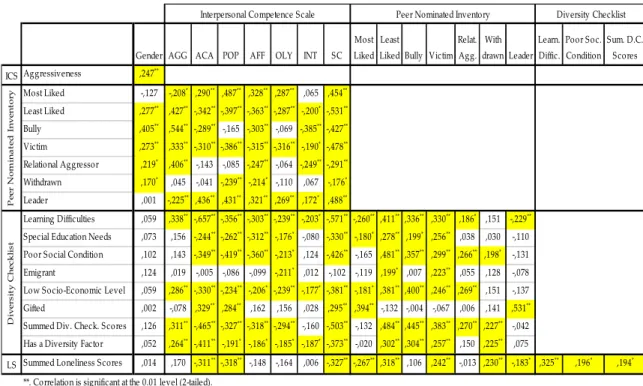
Figure 3 - Inter-correlations of both student and teacher questionnaires. ... 49
Figure 4 - Flash's application in motion - first screen. ... 76
Figure 5 - Flash's application in motion - second screen. ... 76
Figure 6 - Flash's application in motion - third screen. ... 77
Figure 7 - Evolution of weak connections from pre to post-feedback for class 2A. ... 90
L
IST OF
T
ABLES
Table 1 - ICS questions. ... 25
Table 2 - Schematic of the phone rotations. ... 34
Table 3 - ICS Results for class 2A ... 36
Table 4 - ICS Results for class 2B... 37
Table 5 - ICS Results for class 2C ... 37
Table 6 - ICS Results for class 3A ... 38
Table 7 - ICS Results for class 3B... 39
Table 8 - ICS Results for class 3C ... 40
Table 9 – Diversity Checklist Results ... 41
Table 10 – Loneliness Scale Results ... 42
Table 11 - PNI Question 1 (Likeability) Results ... 43
Table 12 - PNI Question 2 (Aversion) Results ... 44
Table 13 - PNI Question 3 (Bullying) Results ... 44
Table 14 - PNI Question 4 (Victimization) Results ... 45
Table 15 - PNI Question 5 (Relational Aggression) Results ... 45
Table 16 - PNI Question 6 (Social Withdrawing) Results ... 46
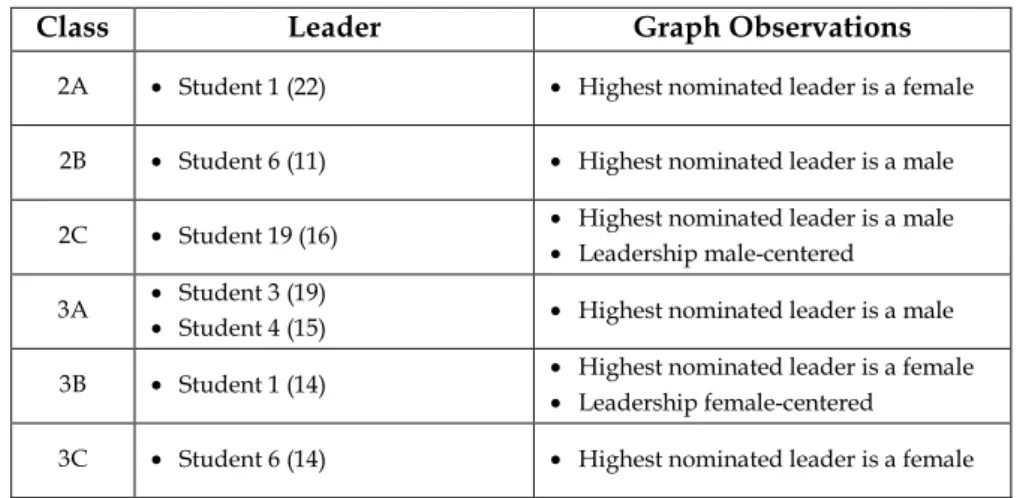
Table 17 - PNI Question 7 (Leadership) Results ... 47
Table 18 - PNI Questions In-Degree Correlations ... 47
Table 19 – RSSI measurements’ highest and lowest centrality results for class 2A ... 54
Table 20 - RSSI measurements’ highest and lowest centrality results for class 2B ... 55
Table 21 - RSSI measurements’ highest and lowest centrality results for class 2C ... 56
Table 22 - RSSI measurements’ highest and lowest centrality results for class 3A ... 57
Table 23- RSSI measurements’ highest and lowest centrality results for class 3B ... 57
Table 24 - RSSI measurements’ highest and lowest centrality results for class 3C ... 58
Table 25 – RSSI Measurement Correlations (0 minutes filtered) ... 60
Table 27 - RSSI Measurement Correlations (10 minutes filtered) ... 65
Table 28 - Dogs emotions portrayed in the visual display. ... 75
Table 29 - Schematic of the phone rotations. ... 78
Table 30 - 2nd study schedule. ... 79
Table 31 - Student-specific network centrality for class 2A. ... 81
Table 32 - Student-specific network centrality for class 3A. ... 83
Table 33 - Paired Samples Statistics for class 2A. ... 84
Table 34 - Paired Samples Test for class 2A. ... 85
Table 35 - Paired Samples Statistics for class 3A. ... 85
Table 36 - Paired Samples Test for class 3A. ... 86
Table 37 - Inter-correlations between questionnaires for class 2A. ... 87
Table 38 - Inter-correlations between questionnaires for class 3A. ... 89
Table 39 – Evolution of weak connections from pre to post-feedback: mean and standard deviation for class 2A. ... 91
A
CRONYMS
DC – Diversity Checklist
ICS – Interpersonal Competence Scale
LS – Loneliness Scale
PNI – Peer Nomination Inventory
I.
I
NTRODUCTION
I.1. P
ROBLEM
S
TATEMENT
Inclusive education has become one of the central focuses of the psychological community, although several challenges in inclusive schools remain. Not only there has been little work on measuring the extent and characteristics of social exclusion (Stanley, 2011), as it is difficult to directly counter-act exclusion, since social successful interactions cannot be forced upon. With this said, it becomes imperative to further analyze how social exclusion and inclusion can impact the welfare of a school social network, studying its complex features.
The development of measuring tools, like Cairns’ Interpersonal Competence Scale (Cairns, 1995) and Asher’s Loneliness Scale (Asher, Hymel, & Renshaw, 1984) depend heavily upon subjective opinions formed by either students or teachers, which can be misleading. Not only that, questionnaire or interview-type tools don’t allow for longitudinal studies, which undermines the actual accuracy and effect of changes enforced upon the community.
I.2. O
BJECTIVES
This thesis aims to create a sociometric measuring tool that successfully depicts the structure and inner-ties of a child social network. We will attempt to design, deploy and analyze the results of two field studies.
On the first study, we assess how the current developed tools are inferior to our measuring tool by deploying a measurement only study, aimed at perceiving how much information can be obtained by the BlueFriends application and attempting to understand how exclusion manifests itself in the school environment.
On the second study, we pile on the previous to try and motivate pro-social behaviors on students, with the use of visual cues and recommendations. With the use of a Flash application, we will attempt to provide in-time recommendations for better interpersonal connections, while keeping the BlueFriends application measurement active for further understanding of the possible changes in the child social network.
I.3. M
ETHODOLOGICAL
A
PPROACH
This thesis commenced with the premise that social exclusion is a more and more regular occurrence in most educational facilities, and as such any technological and/or sociological educational approaches that aim at countering it should be regarded as highly important and rewarding. Taking this into account, it will be possible to observe throughout the specification of this thesis the methodological approach that was given, attempting to achieve a pro-social change in behaviors of students mostly, but non exclusively, regarding their least socially-preferred colleagues.
To achieve the objects that we set ourselves to, we started by reviewing a few inclusive and behavior-changing studies and applications in order to understand what has already been done, what conclusions were taken from those studies/applications, and finally designing our own application (BlueFriends) and deploying two field studies that would attempt to verify the validity of our measurement efforts in the real-life context, as well as the legitimacy of pro-social behavior changing.
Each study is subdivided into 4 categories:
Related Work – In this category, we aim to understand what the actual state-of-art
regarding each study’s objectives is, and offer some background to the ulterior deployment.
Field Study Method – In this category, we provide the information regarding participants, material, preparation, constraints/problems and the applied study method.
Findings – In this category we provide the results obtained on each study, as well
as all the possible findings arising from them.
II.
S
TUDY
I
–
M
EASUREMENT AND
A
NALYSIS OF
S
OCIAL
I
NCLUSIVENESS
In this study we describe the development and deployment of a technology for sensing children’s social interactions.
This field study consists of the deployment of the BlueFriends monitoring tool, along with some other teacher-reported and child-reported ones. The deployment will aim at being as un-intrusive as possible, while gathering a large amount of data for further correlation and examination. After the monitoring is done, we will meticulously analyze the data obtained, inferring on possible relationships among existent tools and the newly created tool.
To establish the validity of the measurement tool, we correlated the data to those derived from traditional sociometric questionnaires. More specifically, each child answered two surveys: the Loneliness Scale (adapted to 6-8 year-old children), and the Peer Nomination Inventory (age-adapted as well). In addition, each teacher was asked to fill two questionnaires (Diversity Checklist and Interpersonal Competence Scale).
We expect the BlueFriends approach to be less time consuming, less fatiguing and more accurate than the existing technologies for sociometric measurement, due to its lack of need for subjective student or teacher opinions, while verifying how these correlated with the network’s centrality research.
II.1. R
ELATED
W
ORK
II.1.1.Exclusion
“Social exclusion is a multidimensional process of progressive social rupture, detaching groups and individuals from social relations and institutions and preventing them from full participation in the normal, normatively prescribed activities of the society in which they live.” (Silver, 2007).
Social exclusion, or marginalization, is defined by a social shortcoming and disregardment to the peripheral side of society. It refers to the process in which individuals are constantly striped from their rights, new opportunities and available resources that are normally accessible by all the adjacent society, being crucial for social integration (McDowell, s.d.).
Exclusion itself can be present on different forms, varying on the contributor. Many contributors include race, social status, personal habits/appearance, education, religion, etc., but fit mostly into 2 categories: Individual and Community Exclusion.
Individual exclusion, voluntary or involuntary, depicts that an individual should be deranged from society due to some kind of deviant behavior/condition he/she withstands. Involuntarily excluded people, such as single mothers who often in the past were exorcized from society based on a cultural bias towards unwed females (Garfinkel & McLanahan, 1986), are the primary targets of individual rejection by society, while voluntarily, an individual’s self-withdrawal from participation, can nonetheless be viewed as social exclusion (e.g. an individual who withdraws himself from social participation based on a previous experience of hostility and/or discrimination) (Barry, 2002),
On the other hand, Community exclusion (such as racial or economic status discriminations) illustrates social despise for a certain feature inherent to people. “Social exclusion is something that can happen to anyone. But certain groups, such as (…) those growing up in low income households or with family conflict, those who do not attend school, and people from some minority ethnic communities are disproportionately at risk of social exclusion.” (Unit & Britain, 2001)
Future implications of social exclusion are difficult to measure, as all individuals will grow in different ways, with many different experiences. However, people with socializing problems are reported to be lonelier (Horowitz & French, 1979), come from a lower socioeconomic background (Dodge, Pettit, & Bates, 1994) and have later on an increased financial cost to the society (Scott, 2001). Having only socializing problems as a predictor, and many possible outcomes, it is necessary to further increase the study on why these socializing problems prevail, learn how to predict them and attempt to counter them.
II.1.2.Inclusive Education
education needs were answered with segregation, thus retracting the disabled child from a “normal” environment and placing him/her under a need-adapted closed environment. This kind of segregation and isolation generates a permanent underclass of students, while causing them to feel as if they are not good enough, don’t fit in or belong because they couldn’t meet a certain default standard. Norman Kunc (2000) explains the hazards of “conditional acceptance” (i.e. exclusion). He points out that many of the problems recurrent in today’s children and youth are the effects of an unbending, unresponsive educational system that progressively destroys the self-esteem and self-worth of students who do not “fit the mold”.
Education-wise, inclusion is defined as a process of restructuring the school as a whole, making sure that all students have access to the whole spectrum of educational and social opportunities offered by the school. This has the objective of avoiding segregation and isolation, and is designed to bring benefits for all students, including those from ethnic or linguistic minorities, those with disabilities or special learning needs, among others. (Mittler, 2000)
As stated by (Falvey & Givner, 2005), all restructuring efforts in schools require, at the very minimum, the conviction that:
• “Each student can and will learn and succeed;
• Diversity enriches us all, and students at risk can overcome the risk for failure through involvement in a thoughtful and caring community of learners;
• Each student has unique contributions to offer to other learners; • Each student has strengths and needs;
• Services and supports should not be relegated to one setting (e.g. special classes or schools);
• Effective learning results from the collaborative efforts of everyone working to ensure each student’s success.”
These suggestions offer a guideline towards making inclusion a reality. Belief in the inclusion results, diversity as an advantage towards learning and successful involvement, appreciation of every individual’s unique contributions, strengths and needs, no academic segregation whatsoever and collaborative effort towards effective learning are the basis for an inclusive social environment.
But even with these in mind, measuring the impact of such a restructure using observation only could be an impossible to achieve task. Henceforth, there is a need to further understand how these child social networks work, for accurate measurement and ulterior analysis.
The following section describes some of the previous approaches for measuring social inclusiveness. Some benefits and constraints will be further analyzed and discussed as well.
II.1.2.1.Approaches to Measuring Social Inclusion
metrics. It consists of several questions, covering peer characterization, likeability, aversion and deviated behaviors.
Question 1 Name which classmates you like the most (up to three names). Most
Preferred
Question 2 Name which classmates you like the least (up to three names). Least
Preferred
Question 3 Name which classmates start fights, say mean things to other kids
or push them, or hit them (up to three names). Bully
Question 4 Name which classmates are teased by others or called names a lot
(up to three names). Victim
Question 5
Name which classmates do mean things to others who are not watching and/or listening. For example, colleagues who spread rumors about other colleagues or tell them to go away when they play (up to three names).
Relational Aggressor
Question 6 Name which classmates play or do school tasks alone a lot (up to
three names). Withdrawn
Question 7 Name which classmates are often good leaders and other children
like to have them in charge (up to three names). Leader
Table 1 - PNI questions.
Despite its widespread adoption, PNI suffers from a number of limitations. First, PNI is designed to measure peer status and relative popularity, it does not allow the children to nominate themselves, and therefore could potentially hide relevant feelings of loneliness and/or exclusion. Second, being a self-reporting tool, PNI measures attitudes towards social behaviors but not overt behaviors. Third, PNI is cumbersome to deploy in longitudinal settings where repeated measures are required to assess the impact of educational or technological interventions on children’s behaviors. This has led to thus leading to a criticism over the lack of empirical data on how exclusion is manifested in children’s behaviors (Simpson, 2004) and at large (Fryxell & Kennedy., 1995).
7-point Likert Scale
Q1: Argue Never Argues Sometimes Always Argues
Q2: Trouble Always gets in trouble at school Sometimes Never gets in trouble at school
Q3: Smile Always smiles Sometimes Never smiles
Q4: Pop. w/ Boys Not popular with boys So-So Very popular with boys
Q5: Shy Not shy So-So Very shy
Q6: Sports Very good at sports So-So Not good at sports
Q7: Looking Very good looking So-So Not good looking
Q8: Spelling Very good at spelling So-So Not good at spelling
Q9: Fight Always gets in a fight Sometimes Never gets in a fight
Q10: Sad Never sad Sometimes Always sad
Q11: Math Not good at math So-So Very good at math
Q12: Pop. w/ Girls Very popular with girls So-So Not popular with girls
Q13: Friends Lots of Friends Some Friends No friends
Q14: --- Never gets his/her way Sometimes Always gets his/her way
Q15: Worry Never worries Sometimes Always worries
Q16: Win Wins a lot Sometimes Never wins
Q17: Friendly Never friendly Sometimes Always friendly
Q18: --- Cries a lot Sometimes Never cries
Table 1 - ICS questions.
Teacher’s questionnaires on the other hand have shown too susceptible to biases. For instance, research has found teachers to be overestimating the social interactions of children at risk of social exclusion.
Understanding that the current measurement tools aren’t enough to have a real sense of the student’s actual feelings and behaviors, it is necessary to further analyze how child social networks work and what kind of measurements are of critical importance for the understanding and analysis of child behavioral patterns.
The following section gives a brief introduction of what social networks are, its components and key aspects for proper network analysis, while attempting to co-relate these with the study at hand.
II.1.3.Introduction to Social Networks
Networks have been one of the main subjects under study by social sciences. Investigating issues such as the strength of connections, influence and connectivity between individuals are the main objectives (Newman, 2003) to understanding its functioning.
A classroom´s main functioning works within the same concept as social networks. It is based on this notion that we proceed to identify the correlations between the two in an intent to comprehend each distinct role and its influence and/or impact in the social network.
In order to understand a class’ functioning, hierarchy and its subject’s behaviors, there are some relevant topics that have to be questioned and analyzed such as: “are the children connected to their classmates?” – Does sharing the same class prove to be enough for them to interact or not; “How far apart are the children?” – How strong are the connections between children and how many are connected through mutual friends; “do children have different levels of impact due to their position in the class?” – Is their popularity or social position in general a relevant factor towards social interaction; and “is the class composed of communities?” – Are classrooms divided into several little groups, or medium to large ones, and how much weight and influence do these groups have?
These questions will allow us to gain a better knowledge regarding the class and its students, and hopefully achieve a prediction for the development of their social behaviors.
II.1.3.1.Network Basics
Network Elements: Edges
In what comes to network elements, specifically edges, they can be classified as directed or undirected. Directed are also called arcs or links. This means that A likes B or A is B’s child, meaning that their relation goes from A to B although not the other way around. Undirected is when the relationship goes both ways, in others words, when students A and B like each other, are siblings, co-authors.
Directed edges in children networks can be interpreted from peer nominations. When a child nominates another as his/her favorite colleague, the opposite doesn’t necessarily happen (i.e. child A prefers child B, child B can prefer child A or not).
Undirected edges, however, can be related to proximity measurement. When a child is near another one, the latter has to be near the first (i.e. child A is near child B, Child B has to be near child A).
Substantially there are some attributes to take into account when referring to edges, such as the weight, meaning how frequently they communicate; the ranking or degree of the relationship, if they’re best friends or second best friends; the type/nature of the relationship and affiliation between them, whether they are friends, relatives or co-workers; and centrality properties, depending on the structure of the rest of the graph (e.g. betweenness)
Computing Metrics
It is crucial to identify the degree of the relationships or in other words, which node has the most edges, projecting into this study as the following question: “which child has more relationships or contacts?”
For each node’s network properties from immediate connections, it is possible to identify three defined subcategories: in-degree, which lets us know how many directed edges (arcs) point towards a node; out-degree, which shows how many directed edges (arcs) originate at a node; and degree (in or out), which identifies the total number of edges incident on a node.
We can also study Node network properties for the entire graph to grasp centrality measurements (e.g. betweenness, closeness, and eigenvector centralities).
II.1.3.2.Network Centrality
When measuring based on centrality, many different characteristics have been proposed, subdividing in two types: power/influence and communication. For instance, it was proposed by Friedkin that “power/influence measures are the result of derivation from an elementary process modeling of social influence" (Friedkin, 1991). Freeman, however, presented three classic centrality measures established by his synthesis of his previous investigation on communication and group processes, concerning communication networks (Freeman, A set of measures of centrality based on betweenness, 1977).
Since our data concerns several standards of communications, Freeman's notions of measurement, such as degree, betweenness and closeness centralities are appropriate, because they allow for further exploration of different dimensions of centrality regarding communication networks (Freeman, Centrality in social networks conceptual clarification, 1979). Moreover, our study is based on the sum of minimum distances between peers, revealing the accuracy of this group of measures since the connectivity settings are assured (Freeman, A set of measures of centrality based on betweenness, 1977).
Community Structure
Social Networks are found to divide naturally into subgroups or communities, which can often refer to small social units of any size that share common values. When found and analyzed, communities can provide crucial information to better help us understand and visualize the network’s structure (Leicht, 2008).
Looking at a more general definition, there’s less probability of a pair of nodes being connected if they don’t allocate the same community, as well as there is a higher probability that they are connected if they share the same community.
When placed in the context of networks, community structure refers to the higher internal density of connections in groups of nodes, in comparison to the rest of the network. When this is the case, it is possible to observe how nodes are joined together in tightly knit groups, which provides significant and informative community divisions.
Displaying a community structure is not a requisite needed by all networks. So, this brings us to an important question: why do we look for community structure?
When taking a given network as an object of study, it is instantly known that such group is composed of various elements, which weight differently on the whole community and are always organized as a hierarchy. It is also known that a network is composed of one or more communities. Due to the complexity of such, it is crucial to analyze its behavior, in order to get to its core. With this said, the first step towards understanding how a given network works is to seek its natural divisions and its underlying structure.
II.1.3.3.Information and Opinion Propagation
Contagion can be characterized as simple or complex. Simple contagion happens when a node infects another one, with some probability for each unit of time. Complex contagion is identified when the contagion only spreads if a certain number of a node’s neighbors are infected. In a classroom, per instance, we can observe simple contagion when a child accepts another child’s opinion related to a certain matter (i.e. somehow child A influences child B). In complex contagion we can observe that a child’s opinion is formed based on the group’s opinion (per instance, when the group has a negative opinion towards child B, child A will also share this opinion, based on the weight of his/her group’s elements).
This brings us to the question: how significant is group cohesion towards opinion diffusion? It has, in fact, a considerable weight in opinion formation and uniformity since “contagion by cohesion occurs because of socializing communications” (Burt, 1999), therefore the higher the communication’s frequency and empathy is, the higher the chance of accepting a new idea or behavior will be.
When looking at group cohesion, its concept is based on elements working towards the same goal, similar interests among the elements, or sense of belonging and interpersonal attraction amongst the group. Therefore, when each node/element adopts the opinion of the majority of its neighbors, it is possible to obtain different opinions in different cohesive subgroups.
With the concept of community and cohesive groups, sharing ideas and opinions becomes common practice, although these could lead to a potential identity loss. By definition, brainstorming is good, because more minds are put together. Nevertheless, there is a danger of group thinking (i.e. minimizing conflict and reaching a consensus decision without critical evaluation of alternate ideas or view points).
II.2. F
IELD
S
TUDY
M
ETHOD
II.2.1.Participants
This study was followed through at Escola Básica do 1º Ciclo com Pré-Escolar Eng. Luís Santos, an elementary school located in Machico, from the 11th until the 28th of June (3 weeks, 14
school days). The class levels available ranged from kindergarten to 4th year, which would
position children’s ages between 4 to 12 years old. According to the type of study we were trying to conduct, we decided it would be best if the children were 7 years old or older, hence we chose three 2nd year and three 3rd year classes to participate in the study.
We observed six classes, with a total of 141 children, aged between 7 to 10 years-old approximately (no specific data of age per child; male = 70). Of these 141 children, 3 children were part of Special Education, not attending normal classes, and 1 child was out of the country. These were, therefore, not part of our study.
II.2.2.Preparation
A series of material was necessary to deploy the study. Namely, 26 phones were used (9 x Android, 17 x Nokia N95), 13 chargers (3 x Android, 10 x Nokia), 26 phone pouches (9 x Android size, 17 x Nokia size), 17 belts (to adapt to different child sizes) built out of 14 meters of elastic and 7 meters of Velcro, 26 padlocks, ~300 printed questionnaires (2 per child, 2 per teacher) and a camera (Cannon EOS 350D).
Since the Nokia pouches were actually camera pouches, there was no way of attaching them to children. Hence, we took 14 meters of elastic and 7 meters of Velcro and sewed them all together to act as adjustably-sized belts. Also, all the pouches were numerally tagged with stickers, as to make it possible to identify who had which pouch.
The questionnaires used for both students and teachers were based on existing ones, being adapted to better fit the age of the participants, as well as crossing language barriers (i.e. all were translated from English to Portuguese). These are explained in-depth on the Questionnaires section.
The study was conducted throughout the normal course of classes, while striving to be as non-evasive as possible. The children didn’t know the purpose of the study, as to not be tempted to manipulate the results, and were constantly reminded that the devices that they were wearing should not be an impediment towards their normal recess activities.
II.2.2.1.Application Development
The Android application to measure and store RSSI (Received Signal Strength Indication) values was also developed before the field study. Since the application was for measurement purposes only, there was no need to envision different personas nor scenarios.
The concept of the application relies on the communication and measuring possibilities of Bluetooth, combined with the versatility and potential of Android development.
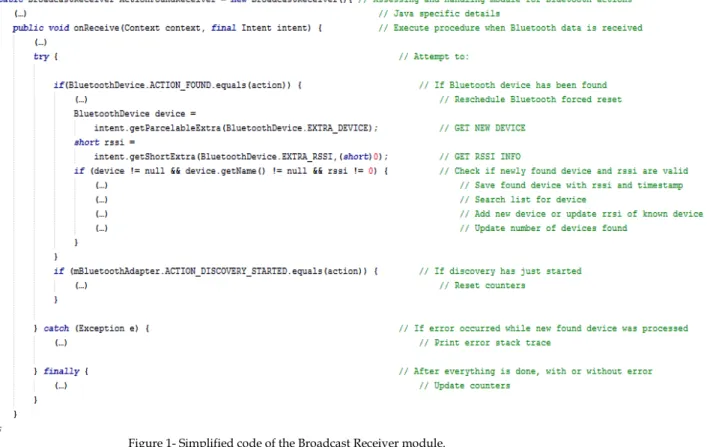
to each discovered Bluetooth device, including the RSSI measurement. This is done on a BroadcastReceiver, a listener Class which is in charge of handling Bluetooth broadcasts. The code snippet that follows demonstrates how the RSSI data is obtained (in a simplified manner).
Figure 1- Simplified code of the Broadcast Receiver module.
As observable, the code was reduced for easier comprehension, although the most important lines are still present. At the right, there is an explanation on what the code is doing/processing. The code which allows for the capture of the RSSI values has its comments written in capital letters.
Every 3 seconds, the data collected is stored into the phone’s local database as a text file, following the CSV format (Comma-Separated Values). This was done to ensure that the files would be easily exported to Microsoft’s Excel program, for later on processing and analyzing.
The application had also a simple user interface presenting the phones it was tracking in the nearby area. This user interface was exclusively used by the researchers, since children had no access to the phones, and therefore is not considered relevant to be shown here.
Although the measurement of RSSI is supported since Android version 2.0 (Bluetooth Device, s.d.), which was released on November 2009 (Android 2.0, Release 1, s.d.), there hasn’t been many studies or projects around the obtainment of correlation values between signal strength and actual distance. The following section describes how we obtained a trustable interval that would allow us to infer one from the other.
II.2.2.2.Measurement Testing
testing took 4 minutes for each position, which would result in 20 samples or so (enough number of samples to make a mean viable).
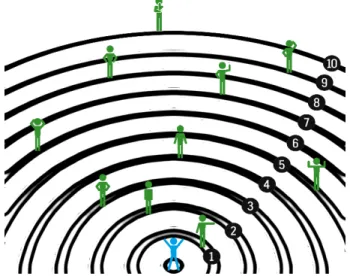
In order to perceive how distance (in meters) would translate to RSSI measurements, tests were made within a 10 meter range. Rotation was also taken into account, 4 specific positions for each 1-meter length, determined by the angle at which the test subject would be positioned comparatively to subject 0.
Figure 2 - Subject disposition scheme for testing.
The procedure occurred in the following way: with the purpose of recreating an environment that would be closer to a real one, it was requested for subjects to wear jeans and set their devices in their left front pocket. They were also asked to keep the screen facing them, in order to achieve a better signal strength. Subject 0’s position was considered as the initial point, and was the only one measuring all others. The test subjects were then positioned 1 by 1, from 1 to 10 meters, separately.
For each 1-meter mark, 4 distinct angles were measured (0, 90, 180 and 270 degrees). The intent behind these rotations was to understand if the angles would have any influence, and if so, its impact on the receiving signals. The triangulation was made through one android Smartphone (assigned to subject 0) and Nokia phones.
The results for the previously explained test can be found further down on the “Findings” topic, as well as the data interpretation and defined threshold values.
II.2.2.3.Questionnaires
All the data collected from the questionnaires has been anonymized, respecting the school’s privacy policy and protecting the identity of the children. We will henceforth denominate 2nd year classes from 2A to 2C, and 3rd year classes from 3A to 3C.
Interpersonal Competence Scale
The Interpersonal Competence Scale (Cairns, 1995) is an important asset to this project because of its brief, useful and assertive measuring method for social development of children by adults, in this case the teachers, and its set of succinct rating scales, which helps us how to better understand each student and their social behavior. This is possible through the assembling of information on basic social and cognitive domains, which can then provide strong assessments of present behaviors and reliable predictions of future social adjustment.
The ICS is composed of 18 topics, consisting of three major subcategories: Aggressiveness (AGG), which measures arguing, having problems in school and getting into fights; Popularity (POP), quantifying popularity with boys, with girls, and number of friends; and Academic Achievement (ACA), which describes the level of spelling and math of the student.
Secondary factors include Social Affiliation (AFF), which measures the stability in interpersonal relationships involving frequent interaction and positive sentiment (smile, friendly), "Olympian" quantities (OLY), which measures children´s capacities towards sports, victories and appearance, Internalizing Problems (INT), which rates the level of sadness, worrying and shyness, and Interpersonal Competence Scale Scores (ICSS), which sums up all the previously referred to categories (with the exception of the internalizing problems category).
These factors are measured in a Lambert’s 7-point scale. In the AGG and INT categories, a low score is a positive factor and a high score a negative one. It is important to point out that these scores follow the opposite pattern of all of the remaining topics (i.e. high scores are positive factors).
Diversity Checklist
The Diversity Checklist is focused on gathering specific and detailed information, reported by the teacher, related to social surroundings, socio-economic factors and learning barriers that are crucial to children’s social behavior and their social development. It also collects information on ethnicity and above average skills. This data, in conjunction with all the other questionnaires, can help to better understand different behavioral patterns adopted by children, and whether they are related to any socio-economic problems or learning disabilities.
This study consists of 8 items, subdivided into 4 categories. The first category is learning barriers, divided into 2 topics: learning disabilities, which accounts for reading/writing difficulties and diagnosed learning disorders; and special educational needs, such as autism, physical/mental disabilities and chronic diseases. The second category encompasses low socio-economic levels, determining whether the child is a part of a multi-problem household or shows signs of poverty, and poor social conditions, identifying if the child rejects or is rejected by his/her colleagues, or exhibits signs of loneliness. The third category focuses on multicultural factors, such as ethnicity, skin color or whether they are emigrants. The fourth and final category approaches above average intelligence/gifted children.
Loneliness Scale
On the Loneliness Scale (Asher, Hymel, & Renshaw, 1984), it is essential to identify and understand children’s difficulties in their peer relationships. In addition to external data information such as the ICS and its rating by teachers through behavioral observations and cognitive domains, it is also substantial to support these assessment procedures with children’s self-reports and their degree of satisfaction with their peer relationships. This study was developed to measure loneliness and social dissatisfaction through a 16-item self-report, which was found to be internally reliable.
The main focus of these 16-items study are children’s feelings of loneliness (e.g. "I feel lonely."), feelings of social adequacy/inadequacy (e.g. "I get along with other children."), and subjective approximation of social status (e.g., " I have many friends."). The remaining 8 items focus on children's hobbies or favorite activities (e.g., "I like arts"; "I watch TV often"). These 8 items were included in the study so that children would feel more comfortable about indicating their attitudes concerning the various topics.
In total, children answered to 24 topics, which were measured on a five-point scale identifying the veracity of each statement about themselves (i.e., It is always true to me, It is often true to me, It is sometimes true to me, It is almost never true to me, It is never true to me). The possible summed score from the LS ranges from a minimum of 16 to a maximum of 80. We sub-divided these into 5 different categories: always social (< 24), social most of the time (> 24 and < 40), sometimes social (> 40 and < 56), almost never social (> 56 and < 72) and never social (> 72).
Peer Nomination Inventory
The Peer Nomination Inventory (PNI) serves an important role in understanding what kind of behaviors children observe in their classroom. We attempt with this children’s self-report of aggressive behavior to better understand the relationships between children, determining observed physical, disruptive and retaliatory behaviors, among other metrics that seemed relevant.
The PNI consists of 7 questions, covering 3 themes: Peer characterization – determining different types of personalities among the children’s colleagues, focusing on bullies, victims and leaders; Likeability and aversion – identification of the most and least preferred colleagues; Deviated behavior – recognition of digressed behavioral patterns, specifically relational aggression and social withdrawal.
All questions allowed the child to nominate a maximum of 3 classroom colleagues who they thought were fitting, but prohibited the child from nominating herself. This prevented self-victimization by the children, but could also hide potentially relevant feelings of loneliness (withdrawal evaluation) and/or exclusion (victim identification).
II.2.3.Constraints / Problems
Also, since the deployment had to be done while the children were playing outside, adverse weather conditions made it impossible to measure anything on the 17th of June. Rain
prevented the children from being free to play wherever they wanted, with whoever they wanted, and therefore measuring anything on those conditions would be inaccurate.
Likewise, due to a musical parade, it was not possible to measure anything on the 21st of
June. All of these lead to a delay on our predicted schedule, and made it impossible for us to measure the 8 classes we had defined at first.
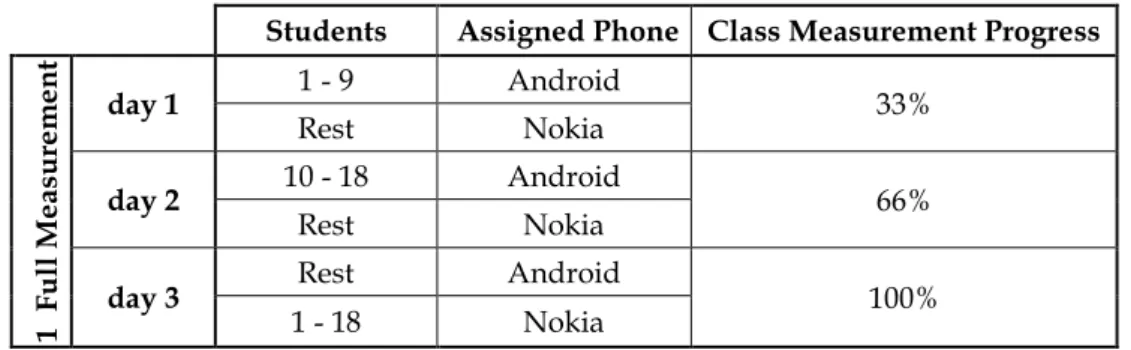
Another problem we encountered was that the material at hand wasn’t enough to measure everyone at the same time. The application developed targeted Android mobiles, and unfortunately, there weren’t enough to measure everyone at the same time. This constraint was worked around by rotating the phones, handing out 9 androids at each rotation, while the rest would get a Nokia phone.
Students Assigned Phone Class Measurement Progress
1 F u ll M e a su re m e n t
day 1 1 - 9 Android 33%
Rest Nokia
day 2 10 - 18 Android 66%
Rest Nokia
day 3 Rest Android 100%
1 - 18 Nokia
Table 2 - Schematic of the phone rotations.
The Nokia phones weren’t able to collect data, but were able to transmit their Bluetooth signal, which was then captured by the Android smartphones. As illustrated in the above schematic, a total of 3 rotations per class was enough to successfully collect RSSI readings from everyone, since 9 Android devices rotated 3 times amounted to 27 children measured (maximum number of children per class was 26). It should be taken into account that this is not an ideal situation, as there could have been a lot more data retrieval if there were enough Androids for the whole class.
II.2.4.Method
The school had 2 different schedules, morning classes (1st and 2nd years) and afternoon
classes (3rd and 4th years). Since there were only 2 reliable recesses, 1 for each schedule, we were
able to collect measurements twice a day, 1 class in the morning and 1 class in the afternoon. A total of 3 days were necessary to complete the RSSI measurement for each class (see previous section for Android rotation explanation).
On the first day of each class, we arrived at the classroom 20 minutes prior to the recess to fully explain what we were doing, and lay out some ground rules, such as “don’t try to open nor take off the pouches”. After that, each child got a phone assigned and strapped-on by us, allowing us to keep track of who had which.
On the third day, we arrived at each classroom 20 minutes prior to recess, delivering the PNI questionnaire and handing out the phones for the last time. We also delivered both ICS and DC questionnaires to the teacher, collecting them on the last day of school, to ensure there was no pressure on filling them, while also being non-intrusive.
We retrieved all the phones at the end of each recess, on the main hall. During the retrieval, each child and phone was confirmed, to ensure no children were swapping pouches.
II.3. F
INDINGS
II.3.1.Questionnaire Analysis
II.3.1.1.ICS
The following table summarizes the data collected from the ICS questionnaires regarding class 2A, identifying both highest and lowest students’ ICS scores, as well as the average score for each category. Since both highest and lowest scores are shown, those that are considered to be negative have a colored background (ex: high aggressiveness).
Categories Low ICS Scores High ICS Scores Average Score
Aggressiveness • Students: 1, 10, 11, 19, 24 (1.0) • Students: 9, 13 (7.0)
• Student 25 (6.0) 3.3
Academic
Achievement • Students 4, 13 (1.8) • Students 1, 6, 15, 19, 20, 26 (7.0) 4.9
Popularity • Student 24 (1.0)
• Student 21 (1.5)
• Student 1, 19 (7.0)
• Student 17 (6.0) 3.9
Social
Affiliation • Student 13 (1.8) • Students 6, 10, 19, 20 (7.0) 4.5 “Olympian”
Quantities
• Student 13 (3.0)
• Student 8 (3.5)
• Student 17 (7.0)
• Student 6 (6.0) 4.7
Internalizing
Problems • Students 9, 25 (2.0) • Student 19 (6.0) 3.8 Summed ICS
Scores • Student 13 (1.9) • Students 1, 19 (6.6) 4.6 Table 3 - ICS Results for class 2A
*Numbers in between parenthesis are the scores obtained ** Orange cells are negative factors
We can observe through the previous table that student 13, specifically, has been quoted in most categories negatively. High aggressiveness (7.0), low academic achievement (1.8), low social affiliation (1.8) and low “Olympian” quantities (3.0) translate into the lowest summed ICS score of class (1.9).
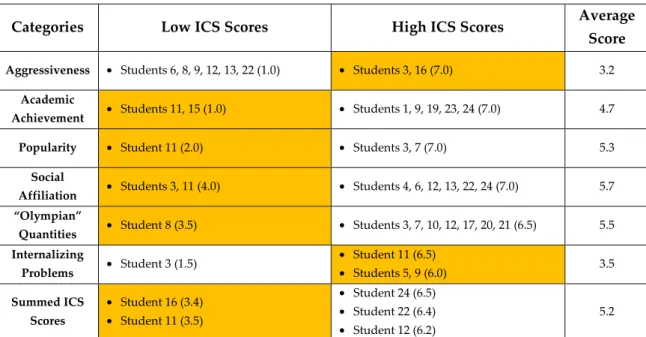
Categories Low ICS Scores High ICS Scores Average Score
Aggressiveness • Students 6, 8, 9, 12, 13, 22 (1.0) • Students 3, 16 (7.0) 3.2
Academic
Achievement • Students 11, 15 (1.0) • Students 1, 9, 19, 23, 24 (7.0) 4.7
Popularity • Student 11 (2.0) • Students 3, 7 (7.0) 5.3
Social
Affiliation • Students 3, 11 (4.0) • Students 4, 6, 12, 13, 22, 24 (7.0) 5.7 “Olympian”
Quantities • Student 8 (3.5) • Students 3, 7, 10, 12, 17, 20, 21 (6.5) 5.5 Internalizing
Problems • Student 3 (1.5)
• Student 11 (6.5)
• Students 5, 9 (6.0) 3.5
Summed ICS Scores
• Student 16 (3.4)
• Student 11 (3.5)
• Student 24 (6.5)
• Student 22 (6.4)
• Student 12 (6.2)
5.2
Table 4 - ICS Results for class 2B
*Numbers in between parenthesis are the scores obtained ** Orange cells are negative factors
In class 2B, student 3 is highly quoted in popularity (7.0) and Olympian quantities (6.5), but also quoted as highly aggressive (7.0). This can be interpreted that, in spite of his high aggressiveness level, the main reason towards his high popularity is his high “Olympian” quantities rating. Although this student is low rated in social affiliation (4.0), this is an intermediate value, thus not relevant. Also, he is considered to be the happiest child of his class (INT=1.5).
Student 11 is one of the lowest rated of this class. His minimally rated academic achievement (1.0), low popularity (2.0), and highest class rating for internalizing problems (6.5), translate into a low summed ICS score (3.5). Based on these values, this student could be seen as the most troubled/anxious child in his class.
On a general note, it should be emphasized that this class has high average social affiliation and “Olympian” quantities (5.7 and 5.5, respectively).
Categories Low ICS Scores High ICS Scores Average Score
Aggressiveness • Students 1, 25 (1.0)
• Students 3, 8 (1.5)
• Student 4 (5.0)
• Students 22, 26 (4.5) 2.6
Academic
Achievement • Student 8 (1.0) • Students 3, 13, 24 (7.0) 5.0
Popularity • Student 8 (4.0) • Students 13, 24 (7.0)
• Students 3, 7 (6.5) 5.3
Social
Affiliation • Students 17, 22, 23, 26 (4.8) • Students 3, 7, 9, 16, 20, 24, 25 (7.0) 6.0 “Olympian”
Quantities • Students 1, 8, 25 (4.5)
• Student 13 (6.5)
• Students 3, 19, 24 (6.0) 5.2
Internalizing Problems
• Student 2 ( 2.5)
• Student 26 (3.0) • Students 10, 23, 25 (5.0) 4.0
Summed ICS
Scores • Student 22 (4.1)
• Student 3 (6.6)
• Students 13, 24 (6.5) 5.4
*Numbers in between parenthesis are the scores obtained ** Orange cells are negative factors
3 distinct situations are noticeable in the previous table. Students 3, 13 and 24 stand out positively as the highest quoted in 5 categories. These 3 students share the highest scores for academic achievement (6.6, 6.5 and 6.5, respectively), popularity (6.5, 7.0, 7.0), “Olympic” quantities (6.0, 6.5, 6.0), and summed ICS scores (6.6, 6.5, 6.5). They diverge on aggressiveness, with student 3 as the only one minimally quoted (1.5), and social affiliation, in which only students 3 and 24 stood out (7.0).
The second situation refers to student 8. Although he’s not minimally or highly quoted in summed ICS scores, he´s minimally quoted in 4 out of 7 categories: aggressiveness (1.5), academic achievement (1.0), popularity (4.0) and “Olympian” quantities (4.5).
On a general note, it should be emphasized that this is an averagely non-aggressive class (2.6), with a high average on popularity (5.3), social affiliation (6.0), “Olympian” quantities (5.2) and summed ICS scores (5.4).
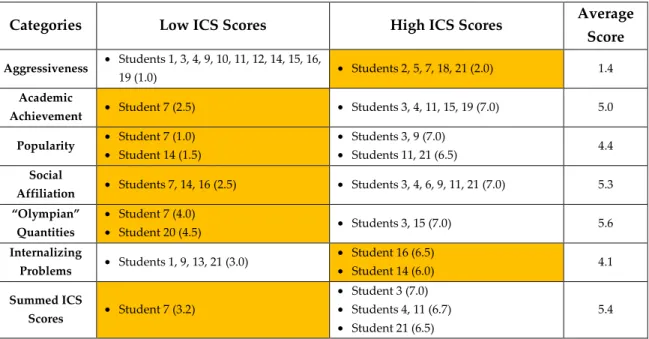
Categories Low ICS Scores High ICS Scores Average Score
Aggressiveness • Students 1, 3, 4, 9, 10, 11, 12, 14, 15, 16,
19 (1.0) • Students 2, 5, 7, 18, 21 (2.0) 1.4
Academic
Achievement • Student 7 (2.5) • Students 3, 4, 11, 15, 19 (7.0) 5.0
Popularity • Student 7 (1.0)
• Student 14 (1.5)
• Students 3, 9 (7.0)
• Students 11, 21 (6.5) 4.4
Social
Affiliation • Students 7, 14, 16 (2.5) • Students 3, 4, 6, 9, 11, 21 (7.0) 5.3 “Olympian”
Quantities
• Student 7 (4.0)
• Student 20 (4.5) • Students 3, 15 (7.0) 5.6
Internalizing
Problems • Students 1, 9, 13, 21 (3.0)
• Student 16 (6.5)
• Student 14 (6.0) 4.1
Summed ICS
Scores • Student 7 (3.2)
• Student 3 (7.0)
• Students 4, 11 (6.7)
• Student 21 (6.5)
5.4
Table 6 - ICS Results for class 3A
*Numbers in between parenthesis are the scores obtained ** Orange cells are negative factors
Observing the beforehand table, specifically the aggressiveness levels, we concluded that aggressiveness shouldn’t be taken into account when analyzing this class. This is due to the highest score for aggressiveness being 2.0, while the lowest score is 1.0. The distance between these is so narrow that there is no real distinction between minimally or maximally rated students.
The other 2 students are identified in the opposite situation of the previously mentioned. Student 7, who is minimally quoted in 5 out of 6 categories: academic achievement (2.5), popularity (1.0), social affiliation (2.5), “Olympic” quantities (4.0), and summed ICS scores (3.2); and student 14, whose low popularity (1.5) and social affiliation levels (2.5) could reflect or be a reflection itself of his high score in internalizing problems (6.0).
On a general note, class 3A has the lowest average scores regarding aggressiveness (1.4) and a high average on both “Olympian” quantities (5.6) and summed ICS scores (5.4).
Categories Low ICS Scores High ICS Scores Average Score
Aggressiveness • Students 1, 4, 8, 9, 13, 14, 15, 17, 22 (2.3)
• Students 16, 21 (6.3)
• Student 7 (6.0) 3.7
Academic
Achievement • Students 2, 16, 23 (2.0) • Students 1, 15, 22 (6.0) 4.3
Popularity • Students 9, 21 (3.7) • Students 1, 2, 6, 10, 11, 12, 18 (6.3) 5.2
Social
Affiliation • Student 21 (4.0)
• Students 1, 2, 6, 8, 9, 10, 12, 13, 15, 16,
17 (6.0) 5.5
“Olympian”
Quantities • Student 8 (4.7) • Students 1, 11, 12, 18 (7.0) 6.0 Internalizing
Problems • Student 21 (1.0) • Students 4, 8, 22 (4.3) 2.9 Summed ICS
Scores
• Student 21 (3.8)
• Student 16, 23 (3.9) • Student 1 (6.2) 5.0
Table 7 - ICS Results for class 3B
*Numbers in between parenthesis are the scores obtained ** Orange cells are negative factors
As observable on the previous table, student 1 should be highlighted, with the highest summed ICS score of this class (6.2). Highly quoted in academic achievement (6.0), popularity (6.3), and social affiliation (6.0), maximally quoted in “Olympian” quantities (7.0), and quoted low in aggressiveness (2.3).
Relative to student 21, it is possible to observe two peculiar situations. Although he’s the lowest quoted child in his class for summed ICS scores (3.8), popularity (3.7) and social affiliation (4.0), these are all intermediate values (scale goes from 1 to 7), and therefore, student 21 could be considered a median student. Also, he’s quoted as one the most aggressive students of his class (6.3), and yet one of the happiest (INT score = 1.0).
In a different perspective, student 16 is also relevant due to the contrast of his values relating his high aggressiveness (6.3) and high social affiliation (6.0). In other words, despite his high aggressiveness level, he’s deemed by his teacher as often smiley and friendly. Adding his low academic achievement (2.0) to the previous categories, the overall value is reflected (or reflects) in one of the lowest summed ICS scores (3.9) of his class. It should be taken into account that, even though it is one of the lowest SICS scores for this class, it is still an intermediate value.
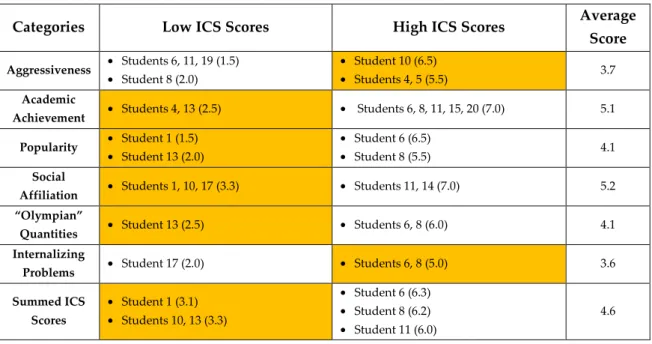
Categories Low ICS Scores High ICS Scores Average Score
Aggressiveness • Students 6, 11, 19 (1.5)
• Student 8 (2.0)
• Student 10 (6.5)
• Students 4, 5 (5.5) 3.7
Academic
Achievement • Students 4, 13 (2.5) • Students 6, 8, 11, 15, 20 (7.0) 5.1
Popularity • Student 1 (1.5)
• Student 13 (2.0)
• Student 6 (6.5)
• Student 8 (5.5) 4.1
Social
Affiliation • Students 1, 10, 17 (3.3) • Students 11, 14 (7.0) 5.2 “Olympian”
Quantities • Student 13 (2.5) • Students 6, 8 (6.0) 4.1 Internalizing
Problems • Student 17 (2.0) • Students 6, 8 (5.0) 3.6
Summed ICS Scores
• Student 1 (3.1)
• Students 10, 13 (3.3)
• Student 6 (6.3)
• Student 8 (6.2)
• Student 11 (6.0)
4.6
Table 8 - ICS Results for class 3C
*Numbers in between parenthesis are the scores obtained ** Orange cells are negative factors
In class 3C, it is possible to observe that students 6 and 8 follow the same pattern, standing out in 6 out of 7 categories. Although they’re both identified as the most shy, worried and concerned students of their class (INT=6.0), they are non-aggressive (1.5 and 2.0, respectively), maximally rated in academic achievements (7.0), and the highest quoted students in popularity (6.5, 5.5), “Olympian” quantities (6.0) and summed ICS Scores (6.3, 6.2).
Student 11 also classifies as one of the highest rated in summed ISC scores (6.0), maximally rated academically (7.0) and minimally rated on aggressiveness (1.5), diverging from the previous 2 students in both popularity and “Olympian” quantities, but standing out as one of the most social students of his class (AFF=7.0).
Lastly, student 13 stands out negatively. He is rated as one of the lowest in summed ICS scores (3.3), academic achievement (1.5) and popularity (2.0), and the only student in his class negatively rated in “Olympian” quantities (2.5).
II.3.1.2.DC
Each diversity factor was assigned a value of 1, in which the diversity factor scores consist of the sum of all factors. It is more important for our research to understand the result of summed scores, instead of each student’s particular conditions.