Metabolic acidosis and its association with nutritional status
in hemodialysis
Authors
Claudia Maria Costa de Oliveira 1,2
Caroline Lustosa da Costa Vidal 1
Eurinice Fontenele Cristino 1 Francisco Marto Leal Pinheiro Jr 2 Marcos Kubrusly 1,2
1 UniChristus.
2 Universidade Federal do Ceará.
Submitted on: 04/07/2015. Approved on: 07/08/2015.
Correspondence to: Claudia Maria Costa de Oliveira. Centro Universitário UniChristus e Universidade Federal do Ceará. Rua Jacinto Botelho, nº 500, apt 500, Fortaleza, Ceará, Brasil. CEP: 60.810-050
I
NTRODUCTIONChronic metabolic acidosis is a frequent problem in CKD patients, especially in more advanced-stage patients. It has a variable prevalence in dialysis patients1,
being detected in a considerable number of patients, despite good dialysis adequacy ratio.2
Metabolic acidosis results in nutritional changes due to an increase in protein catabolism and oxidation of branched-chain amino acids, resulting in a negative nitrogen balance;1,3 reduction
in protein synthesis; systemic inflammation and reduction of leptin concentration.4
Other consequences of metabolic acidosis involve the loss of bone mass due to a release of calcium phosphate from the bone into the circulation, that helps in buffering acidosis, but also results in deterio-ration of hyperphosphatemia; faster progression of renal failure; multiple endocrine disorders such as glycemia, hyperinsulinemia, hyper-glucagonemia, GH and catechol-amines elevation; increased levels of cytokines and B2-microglobulin; hypertriglyceridemia; hypotension; malaise and increased mortality.5
The protein-energy malnutrition contributes to morbidity and mortality in hemodialysis and it
Introduction: Metabolic acidosis is a common problem in dialysis patients and plays an important role in the pathogenesis of protein-energy malnutrition in these patients. Objectives: To assess the prevalence of metabolic acidosis in hemodialysis and search their association with nutritional status. Methods: A cross-sectional study was performed in hemodialysis patients at a single center. Nutritional status was assessed by anthropometric, biochemical and multifrequency bioelectrical impedance analysis. Metabolic acidosis was defined as serum bicarbonate (BIC) < 22 mEq/L and patients were divided into 3 groups according to BIC (< 15.15 to 21.9 and ≥ 22). The association between BIC and continuous variables was investigated using the Kruskal Wallis test. The linear correlation between BIC and the variables of the study was also tested. Results: We studied 95 patients, 59% male, mean age 52.3 years. The prevalence of metabolic acidosis was 94.7%. BMI, interdialytic weight gain and PTH were significantly different among the 3 groups of BIC. The BIC was negatively correlated with urea, phosphorus and interdialytic weight gain. There was no significant correlation with albumin, phase angle and lean body mass index. Conclusion:
The prevalence of metabolic acidosis was high in this population, and a lower BIC correlated with higher levels of urea, PTH, phosphorus, interdialytic weight gain and lower BMI. The evaluation of acid-basic status should be routinely implemented in dialysis patients by considering the negative effects of acidosis on the nutritional status, inflammation and bone disease.
A
BSTRACThas a multifactorial pathophysiology, which may result from the loss of nutrients during dialysis, increased protein catabolism and decreased protein synthesis; reduction of caloric and protein intake, reduction in peripheral insulin resistance that results in acceleration of muscle atrophy and metabolic acidosis.2
Studies with patients in dialysis in our population assessing the prevalence of metabolic acidosis, as well as its association with nutritional status are scarce, thus justifying this study.
M
ETHODSThe study population comprised patients with chronic renal failure undergoing hemodialysis in a single dialysis center in the city of Fortaleza-CE.
The study protocol was approved by the Ethics in Research Committee of the UniChristus University Center, under number 071/2012.
The study has a cross-sectional design, including patients over 18 years of age in dialysis for more than 3 months, which could be submitted to the direct measurement of weight and height, had no contraindication to performing multifrequency bioelectrical impedance analysis, who had an arteriovenous fistula as vascular access for dialysis and who signed the consent form to participate in the study.
Patients were submitted to blood collection on the arterial side of the arteriovenous fistula in the pre-dialysis period. The blood collected was placed in an iced container and sent immediately for analysis. Blood gas analysis is not routinely performed in hemodialysis clinics. Metabolic acidosis was defined as a serum bicarbonate < 22 mEq/l.
Nutritional status assessment was performed using anthropometric, biochemical and bioelectrical impedance analysis.
The anthropometric index used was the body mass index (BMI), calculated using height and post-dialysis dry weight. Patients with BMI < 23 kg/m2 were considered
malnourished.6
The biochemical indicator of nutritional status was evaluated by measuring pre-dialysis serum albumin. The sample was collected on the day of blood collection for monthly assessment at the clinic, with the patient fasting. Albumin dosage was performed by the green bromocresol method.7 Patients
with albumin < 4 g/dl were considered malnourished.6
Other laboratory variables collected in monthly follow up at the clinic were recorded to assess association with serum bicarbonate, such as hemoglobin, urea, creatinine, potassium, phosphorus and PTH.
Kt/V was obtained from the computer software that uses the Daugirdas equation and urea kinetics for calculations.8 Patients with
Kt/V below 1.2 had an inadequate dialyses. The bioelectrical impedance analysis was performed immediately before the start of dialysis, using the BCM (Body Composition Monitor) from Fresenius Medical Care. A multifrequency electrical current (ranging between 5 to 1000 kHz) was applied to the patient through distal electrodes, and voltage drop was detected in the proximal electrodes, thus generating the impedance. The data obtained was entered into the BCM software from Fresenius Medical Care and indirectly we calculated lean body mass, fat mass, body cell mass and lean mass index (lean mass in kg divided by height in squared meters). The phase angle considered was the one recorded in the 50 Hz electric current. Patients with phase angle below 5 degrees were considered malnourished, according to Barbosa-Silva et al.9
were collected in the same month of this evaluation. The demographic characteristics and data related to the dialysis treatment (including the monthly average of interdialytic weight gain) were obtained from the medical records of the patients in the clinic.
STATISTICALANALYSIS
Continuous variables were expressed as mean ± standard deviation and categorical varia-bles as percentages.
The patients were divided into 3 groups according to serum bicarbonate (BIC) levels (< 15, 15 to 21.9 and ≥ 22mEq/L). The association between BIC and continuous variables was studied using the Kruskal Wallis test. A p value < 0.05 was considered statistically significant.
Statistical tests were performed to assess the linear correlation between the various parameters studied in the diagnosis of nutritional status and the presence of metabolic acidosis, measured by serum bicarbonate. The Pearson test was used to assess the linear correlation between the variables studied. The data was recorded in a 5.0 Microsoft Excel spreadsheet and then transferred to SPSS version 20.0, in which the statistical analysis was performed.
R
ESULTSThe study population comprised 95 patients, 56 males (59%) with a mean age of 52.3 years (± 14.4). The primary renal disease was indeterminate in 42.1% of the cases, hypertensive renal disease in 16.8% and diabetic nephropathy in 16.8%. The median time on dialysis was 109.7 months. The frequency of dialysis treatment was 3 times/ week in 85% of the cases, and the dialysis bicarbonate solution was 38 mEq/L, and all the patients were submitted to dialysis with a high flow polysulphone capillary. The average interdialytic weight gain was 3.82 kg (± 1.27).
The characteristics of the anthropometric,
on Table 1 and the blood gas data is shown on Table 2.
TABLE 1 ANTHROPOMETRIC, LABORATORIALAND BIE CHARACTERISTICSOFTHESTUDYPOPULATION
Mean ± Standard Deviation (SD)
Weight 63.14 ± 5.08 Kg
BMI 24.61 ± 4.82 Kg/m2
Urea 124.89 ± 32.80 mg/dl
Creatinine 10.35 ± 2.62 mg/dl Phosphorus 4.90 ± 1.16 mg/dl
Albumin 3.96 ± 0.28 g/dl
Hemoglobin 12.54 ± 1.81 g/dl
PTH 593.47 ± 517.08 ng/ml
KTv 1.47 ± 0.28
Phase Angle 4.88 ± 0.98 degrees
Lean mass index 12.59 ± 3.03
BMI: Body Mass Index.
TABLE 2 ANTHROPOMETRIC, LABORATORIALAND BIE CHARACTERISTICSOFTHESTUDYPOPULATION
Mean ± Standard Deviation (SD)
pH 7.29 ± 0.06
HCO3 17.32 ± 2.35
CO2 18.42 ± 2.42
PCO2 36.05 ± 5.41
BE -8.21 ± 2.89
EB: Excess Base.
The prevalence of metabolic acidosis according to the BIC was 94.7%, and 10.5% of patients had HCO3- less than 15 mEq/L and 84.2% between 15 and 21.9 mEq/L.
The prevalence of malnutrition according to BMI, albumin and the phase angle was 38.9%, 44.2% and 56.8%, respectively.
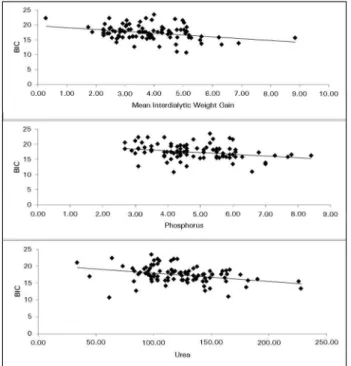
The Linear correlation tests between serum bicarbonate (BIC) and the study variables showed a significant negative correlation with urea (r = -0.344; p = 0.001), phosphorus (r = -0.297; p = 0.003) and interdialytic weight gain (r = -0.319; p
= 0.002) (Figure 1).
Figure 1. Linear correlation between serum bicarbonate and the study variables.
BMI, interdialytic weight gain and PTH were significantly different between the three BIC groups (p = 0.026, 0.016 and 0.028 respectively). There was a trend towards a significant difference for creatinine (p = 0.05).
D
ISCUSSIONThe prevalence of metabolic acidosis in dialysis in the literature has been widely variable. In this study, the prevalence of metabolic acidosis in dialysis patients was very high (94.7%), although the bicarbonate concentration in the dialysis solution was 38 mEq/L. In another Brazilian study, Santos et al.2 also found a high prevalence
of metabolic acidosis (90%) in hemodialysis patients with adequate Kt/V using the same cut-off point (BIC < 22 mEq/L). In the study by Lin et al.10 using a cutoff point of 21 mEq/L
for bicarbonate, 17% of the patients were pre-dialysis acidotic. According to Kim & Han11 1/3
to 1/2 of hemodialysis patients had pre-dialysis bicarbonate levels < 22 mEq/L with bicarbonate concentration in the dialysis solution between 33-38 mEq/L. Wu et al.,12 evaluated 56,386
hemodialysis patients and found that 49% had pre-dialysis bicarbonate < 22 mEq/L. Vashistha
et al.,13 studied 10,400 patients on hemodialysis,
and found that 40% were acidotic in pre-dialysis (BIC < 22 mEq/L). According to the K/DOQI (2002) guidelines,14 serum bicarbonate should be
measured once a month in hemodialysis patients and their pre-dialysis levels should be maintained equal to or higher than 22 mEq/L.
Metabolic acidosis has deleterious effects in patients with chronic kidney disease such as renal osteodystrophy, inflammation and compromised nutritional status.15
The prevalence of malnutrition in hemodialysis varies between 25 and 80%16,17 and is associated
with increased morbidity and mortality. Periodic monitoring of nutritional status should be part of the follow-up of patients on dialysis, being fundamental to prevent, diagnose and treat protein-calorie malnutrition. The identification and early treatment of nutritional deficit may reduce the risk of infections and other complications, as well as the mortality of these patients.18 Studies have indicated that a major
cause of malnutrition in these patients is systemic acidosis.19,20
The effect of metabolic acidosis on the nutritional status and survival of dialysis patients is a controversial issue. Some studies show that mild to moderate metabolic acidosis indicate a higher intake of protein, improved nutritional status and better survival.10,21,22 Other authors
believe that metabolic acidosis promotes, through endogenous protein catabolism and inflammation, the induction of protein-energy malnutrition, leading to a worse outcome.20-27
Upon assessing hemodialysis patients, Bommer et al.,28 found a strong association
TABLE 3 ASSESSMENTOFSTUDYVARIABLESACCORDINGTOSERUMBICARBONATEGROUP
HCO3 < 15 HCO3 15-21.9 HCO3 ≥ 22
p
Mean (± SD) Mean (± SD) Mean (± SD)
Age (years) 50.4 (± 13.2) 52.73 (± 14.03) 49.20 (± 19.85) 0.927 Time in dialysis (months) 203.34 (± 175.87) 159.29 (± 142.90) 91.08 (± 89.14) 0.312
Weight (kg) 56.50 (± 10.27) 64.53 (± 15.60) 54.20 (± 7.36) 0.098
BMI (kg/m2) 21.74 (± 2.81) 25.16 (± 4.95) 21.58 (± 2.52) 0.026
Interdialytic weight gain 4.93 (± 1.28) 3.73 (± 1.15) 3.05 (± 1.74) 0.016
Urea (mg/dL) 140.00 (± 47.40) 121.43 (± 31.13) 101.00 (± 22.78) 0.127 Creatinine (mg/dL) 9.33 (± 2.81) 10.68 (± 2.52) 7.36 (± 3.22) 0.050
Albumin (g/dl) 3.81 (± 0.30) 3.98 (± 0.26) 4.10 (± 0.31) 0.135
Phosphorus (mg/dL) 5.10 (± 1.41) 4.81 (± 1.18) 4.32 (± 1.22) 0.544
PTH (ng/ml) 583.41 (± 545.05) 621.91 (± 520.75) 158.58 (± 77.89) 0.028 Kt/V 1.63 (± 0.29) 1.43 (± 0.32) 1.46 (± 0.26) 0.275
Phase angle (degrees) 4.47 (± 1.05) 4.9 (± 0.97) 4.61 (± 1.07) 0.288
Lean mass index 11.35 (± 1.99) 12.67 (± 3.06) 14.10 (± 4.19) 0.344
BMI has low sensitivity in detecting malnutrition in patients with chronic kidney disease on hemodialysis due to fluid retention, which is common in these patients. In an attempt to minimize interpretation errors, BMI is calculated from the dry weight. The literature has described the BMI cut-off points for malnutrition in CKD ranging from 18.5 to 25 kg/m2.16,17,29-32 Currently, it is recommended
that patients on HD must keep their BMI above 23 kg/m2,6,33 reinforcing the concept that BMI
in CKD must be above the levels recommended by the World Health Organization,34 since these
patients are subject to greater risk of infectious complications or periods of increased metabolic demand, and that an additional energy reserve can bring a positive impact on morbidity and mortality.
However, the best assessment of body fluid volume is made by bioimpedance.2 It is also
important to assess lean mass and fat mass indexes obtained by bioelectrical impedance. Despite the limitations of BMI, in this study we found a significant difference in mean BMI between the three bicarbonate group, with higher BMI values in moderately acidotic patient and lower in those very acidotic or BIC > 22 mEq/L. BMI correlated negatively with bicarbonate in the study carried
et al.(120 patients).10 It is possible that a high
protein intake resulting in a higher acid load may have overcome the deleterious effects of acidosis on protein catabolism. On the other hand, Dumler et al.,35 evaluated 124 dialysis patients,
and detected no difference in BMI between acidotic patients (BIC < 18) and those non-acidotic, as there was no significant correlation between pre-dialysis BIC and BMI in the study carried out by Wu et al.12
The concentration of serum albumin is one of the most sensitive indices of malnutrition in hemodialysis patients36,37 and there is evidence
that metabolic acidosis contributed to the low level of serum albumin.20,25,38,39 Hypoalbuminemia
is a strong predictor of mortality in dialysis patients.21 Two epidemiologic studies with large
numbers of patients found significant inverse correlations between pre-dialysis bicarbonate and serum albumin.22,40 Similarly, Lin et al.10
found that serum albumin tended to be greater in acidotic hemodialysis patients. It is known that higher intake of protein increases the synthesis of albumin, while moderate chronic metabolic acidosis may contribute to increase hypoalbuminemia by increasing protein catabolism and decreasing albumin synthesis.3,4,38
for the reduction due to metabolic acidosis;10
however, we could not assess this in the present study, since we did not know the amount of protein ingested by the patient.
However, in a previous study with 47 patients, the authors found a direct correlation between albumin and serum bicarbonate. A bicarbonate concentration lower than 22 mEq/L (seen in 17 patients) was correlated with a lower concentration of serum albumin when compared with patients with bicarbonate greater than 22 mEq/L.41 In this study, albumin values were lower
in the more acidotic patients, although there was no statistically significant difference between the 3 BIC groups.
Urea is directly related to protein intake and/or endogenous protein breakdown. In hemodialysis patients, low serum urea levels are dependent on residual kidney function and dialysis intensity and, moreover, have a direct correlation with the mortality rate.21
Chauveau et al.22 analyzed the pre-dialysis
plasma bicarbonate, correlating it with urea and found a strong negative correlation between these variables. Moran et al.42 also reported an
inversely proportional decrease in urea with the increase in the plasma concentration of bicarbonate in hemodialysis patients. Uribarri
et al.43 found a significant inverse relationship
between bicarbonate below 21 mEq/L and higher levels of pre-dialysis creatinine and urea. This negative correlation between urea and serum bicarbonate was also found in this study (r = 0.344; p = 0.001), although the correlation with creatinine has shown only a trend towards significance (lower creatinine values in the group without metabolic acidosis).
Regarding phosphorus, Gao et al.44 found an
inverse association between serum bicarbonate and phosphorus in 50 hemodialysis patients. Wu
et al.12 also found that serum phosphate showed
a significant inverse correlation with serum bicarbonate, indicating that hyperphosphatemic patients under maintenance dialysis tend to have a lower level of serum bicarbonate. In this study, phosphorus had a negative correlation
with bicarbonate. One hypothesis to explain this inverse correlation between bicarbonate and phosphorus would be a higher protein intake, which can lead to hyperphosphatemia and acidosis, but as a limitation of our study, we did not evaluate the amount of protein ingested by each patient, which makes it difficult to state this hypothesis. In the DOPPS (Dialysis Outcomes Study Practice Pattern) study, they reported this same inverse correlation between bicarbonate and phosphorus, believed to be due to a higher intake of protein by patients.28
Our study found a negative correlation between serum bicarbonate and interdialytic weight gain, which may only translate that patients who gained more weight were those who also had higher protein intake and therefore had a higher degree of metabolic acidosis, which can not be confirmed by non-evaluation of protein intake by dietary questionnaires in this study. In a prospective US study,45 there was no significant
difference between groups for serum albumin and interdialytic weight gain in patients with or without daily replacement of oral sodium bicarbonate. A criticism of this study was the fact that the authors included patients who were minimally acidotic and who had nearly normal levels of albumin.
A rapid correction of metabolic acidosis attenuates PTH circulating activity in CRF and can emphasize the importance of maintaining normal acid-base homeostasis, particularly in the presence of secondary hyperparathyroidism.46 Metabolic
acidosis contributes to renal osteodystrophy and together with hyperphosphatemia, hypocalcemia and altered vitamin D metabolism, it may result in elevated levels of PTH and metastatic calcifications. However, the impact of metabolic acidosis correction in PTH levels and calcium-phosphorus metabolism is still controversial. Movilli et al.47 showed that metabolic acidosis
in PTH with metabolic acidosis correction in 36 patients on dialysis. On the other hand, in the prospective evaluation of 48 patients for 4 months, the correction of metabolic acidosis was associated with decreases in serum calcium and higher PTH levels. This may be an undesirable effect because it can worsen secondary hyperparathyroidism.48 In the present study,
we found that PTH was significantly different between the three groups, having the lowest BIC correlated with the highest PTH values.
The body composition assessed by BCM, is a valid tool in nutritional assessment, besides estimating the hydration status. In the future, it may turn out to be a gold standard in nutritional assessment.49 In a previous study, the assessment
of nutritional status by BCM correlated well with other clinical and laboratory measures of nutrition and inflamation.50 In addition, the lean
body mass index of less than 10% of normal was significantly associated with mortality in the assessment of 748 patients on hemodialysis,51 as
well as smaller amounts of albumin and BMI. In this study, the lean mass index had significant correlation with creatinine (r = 0.276,
p = 0.006) and albumin (r = 0.264, p = 0.008), but did not correlate with BMI and bicarbonate (data not shown in the results). Although in the most acidotic patients we found less lean body mass indexes, this difference was not significant from a statistical point of view. The association between nutritional status assessed by the lean body mass index and bicarbonate was not evaluated in previous studies.
This study had some limitations, one being the fact that the acid-base assessment was based on only one monthly assessment of gases to set the metabolic state of the patient. Protein intake in food was also not evaluated, making it impossible to assess the correlation between protein intake, nutritional parameters and acid-base status. Other limitations were the small sample size and the lack of nutritional assessment through other anthropometric parameters, such as measures of arm circumference and arm
of post-dialysis metabolic acidosis status, emphasizing the degree of acidosis correction with dialysis.
However, advantages of this study are the fact that there are few studies assessing the prevalence of metabolic acidosis and its association with nutritional parameters in our country. Blood gas evaluation on monthly control is not a routine of dialysis clinics in Brazil, since it involves a costly examination not paid by the Public Healthcare System and that is not a requirement of the National Health Surveillance Agency through Board Resolution - RDC 154, of June 25, 2004.52 establishing technical regulations for the
operation of dialysis services in Brazil.
The authors believe that the importance of metabolic acidosis has been underestimated in hemodialysis and suggested that periodic monitoring of acid-base status should be implemented regularly in dialysis patients, in order to maintain a pre-dialysis bicarbonate > 22 mEq/L, even when this is necessary, besides controlling protein intake of these patients, the addition of bicarbonate in the interdialytic interval. Recent studies have emphasized the importance of bicarbonate in the mortality of patients with chronic kidney disease.53,54 Better
understanding the interaction between metabolic acidosis and nutritional status may modify the behavior of these patients and may result in improvements in morbidity and mortality thereof.
C
ONCLUSIONSR
EFERENCES1. Lugon JR. Diálise: Efeitos adversos da acidose metabólica crô-nica em hemodialisados. J Bras Nefrol 1997;19:95-7.
2. Santos EMC, Petribú MMV, Gueiros APS, Gueiros JEB, Cabral PC, Campos ACS, et al. Efeito benéfico da correção da acidose metabólica no estado nutricional de pacientes em hemodiálise. J Bras Nefrol 2009;31:244-51. DOI: http://dx.doi.org/10.1590/ S0101-28002009000400002
3. Mafra D, Burini RC. Efeitos da correção da acidose metabólica com bicarbonato de sódio sobre o catabolismo proteico na in-suficiência renal crônica. Rev Nutr 2001;14:53-9.
4. Leal VO, Leite Júnior M, Mafra D. Acidose metabólica na doença renal crônica: abordagem nutricional. Rev Nutr 2008;21:93-103. DOI:http://dx.doi.org/10.1590/S1415-52732008000100010
5. Riella MC, Pachaly MA. Metabolismo ácido-básico. In: Riella MC. Princípios de nefrologia e distúrbios hidroeletrolíticos. Rio de Janeiro: Guanabara Koogan; 2003.
6. Fouque D, Kalantar-Zadeh K, Kopple J, Cano N, Chauveau P, Cuppari L, et al. A proposed nomenclature and diagnostic criteria for protein-energy wasting in acute and chronic kid-ney disease. Kidkid-ney Int 2008;73:391-8. DOI: http://dx.doi. org/10.1038/sj.ki.5002585
7. Tietz NW. Fundamentals of Clinical Chemistry. Analysis, me-thods, pathophysiology and interpretation. Philadelphia: W. B. Saunders; 1987. p.328-30.
8. Daugirdas JT. Simplified equations for monitoring Kt/V, PCRn, eKt/V, and ePCRn. Adv Ren Replace Ther 1995;2:295-304. 9. Barbosa-Silva MC, Barros AJ, Post CL, Waitzberg DL,
Heymsfield SB. Can bioelectrical impedance analysis identify malnutrition in preoperative nutrition assessment? Nutrition 2003;19:422-6.
10. Lin SH, Lin YF, Chin HM, Wu CC. Must metabolic acidosis be associated with malnutrition in haemodialysed patients? Ne-phrol Dial Transplant 2002;17: 2006-10.
11. Kim HJ, Han SW. Metabolic acidosis in maintenance hemo-dialysis patients: clinical impact and intervention. Electrolyte Blood Press 2007;5:42-6. DOI: http://dx.doi.org/10.5049/ EBP.2007.5.1.42
12. Wu DY, Shinaberger CS, Regidor DL, McAllister CJ, Kopple JD, Kalantar-Zadeh K. Association between serum bicarbona-te and death in hemodialysis patients: is it betbicarbona-ter to be acido-tic or alkaloacido-tic? Clin J Am Soc Nephrol 2006;1:70-8. PMID: 17699193
13. Vashistha T, Kalantar-Zadeh K, Molnar MZ, Torlén K, Mehrotra R. Dialysis modality and correction of uremic metabolic acidosis: relationship with all-cause and cause--specific mortality. Clin J Am Soc Nephrol 2013;8:254-64. DOI:http://dx.doi.org/10.2215/CJN.05780612
14. National Kidney Foundation. K/DOQI clinical practice gui-delines for chronic kidney disease: evaluation, classification, and stratification. Am J Kid Dis 2002;39:S1-266.
15. Marques FO, Libório AB, Daher EF. Effect of chloride dialysate concentration on metabolic acidosis in main-tenance hemodialysis patients. Braz J Med Biol Res 2010;43:996-1000. DOI: http://dx.doi.org/10.1590/S0100--879X2010007500094
16. Aparicio M, Cano N, Chauveau P, Azar R, Canaud B, Flory A, et al. Nutritional status of haemodialysis patients: a Fren-ch national cooperative study. FrenFren-ch Study Group for Nu-trition in Dialysis. Nephrol Dial Transplant 1999;14:1679-86. DOI:http://dx.doi.org/10.1093/ndt/14.7.1679
17. Stenvinkel P, Heimbürger O, Paultre F, Diczfalusy U, Wang T, Berglund L, et al. Strong association between malnutri-tion, inflammamalnutri-tion, and atherosclerosis in chronic renal failure. Kidney Int 1999;55:1899-911. PMID: 10231453 DOI:http://dx.doi.org/10.1046/j.1523-1755.1999.00422.x 18. Oliveira CMC, Kubrusly M, Mota RS, Silva CAB, Oliveira VN.
Desnutrição na insuficiência renal crônica: qual o melhor méto-do diagnóstico na prática clínica? J Bras Nefrol 2010;32:57-70.
19. Mitch WE. Influence of metabolic acidosis on nutrition. Am J Kidney Dis 1997;29:46-8. DOI: http://dx.doi.org/10.1016/ S0272-6386(97)90115-3
20. Movilli E, Zani R, Carli O, Sangalli L, Pola A, Camerini C, et al. Correction of metabolic acidosis increases serum albumin concentrations and decreases kinetically evalua-ted protein intake in haemodialysis patients: a prospective study. Nephrol Dial Transplant 1998;13:1719-22. PMID: 9681718 DOI: http://dx.doi.org/10.1093/ndt/13.7.1719 21. Lowrie EG, Lew NL. Death risk in hemodialysis patients:
the predictive value of commonly measured variables and an evaluation of death rate differences between facilities. Am J Kidney Dis 1990;15:458-82. DOI: http://dx.doi. org/10.1016/S0272-6386(12)70364-5
22. Chauveau P, Fouque D, Combe C, Laville M, Canaud B, Azar R, et al. Acidosis and nutritional status in hemo-dialyzed patients. French Study Group for Nutrition in Dialysis. Semin Dial 2000;13:241-6. DOI: http://dx.doi. org/10.1046/j.1525-139x.2000.00066.x
23. Jenkins D, Burton PR, Bennett SE, Baker F, Walls J. The metabolic consequences of the correction of acidosis in uraemia. Nephrol Dial Transplant 1989;4:92-5. PMID: 2540459
24. Bergström J. Metabolic acidosis and nutrition in dialy-sis patients. Blood Purif 1995;13:361-7. PMID: 8821201 DOI:http://dx.doi.org/10.1159/000170222
25. Mitch WE. Uremic acidosis and protein metabolism. Curr Opin Nephrol Hypertens 1995;4:488-92. DOI:http://dx.doi. org/10.1097/00041552-199511000-00005
26. Graham KA, Reaich D, Channon SM, Downie S, Goodship TH. Correction of acidosis in hemodialysis decreases whole--body protein degradation. J Am Soc Nephrol 1997;8:632-7. 27. Mitch WE. Insights into the abnormalities of chronic
re-nal disease attributed to malnutrition. J Am Soc Nephrol 2002;13:S22-7.
28. Bommer J, Locatelli F, Satayathum S, Keen ML, Goodkin DA, Saito A, et al. Association of pre-dialysis serum bicarbonate le-vels with risk of mortality and hospitalization in the Dialysis Outcomes and Practice Patterns Study (DOPPS). Am J Kidney Dis 2004;44:661-71. DOI:http://dx.doi.org/10.1016/S0272-6386(04)00936-9
29. Beddhu S, Papaas LM, Ramkumar N, Samore MH. Malnu-trition and atherosclerosis in dialysis patients. J Am Soc Ne-phrol 2004;15:733-43. DOI: http://dx.doi.org/10.1097/01. ASN.0000113319.57131.28
30. Port FK, Ashby VB, Dhingra RK, Roys EC, Wolfe RA. Dialysis dose and body mass index are strongly associated with survival in hemodialysis patients. J Am Soc Nephrol 2002;13:1061-6.
31. Dwyer JT, Larive B, Leung J, Rocco MV, Greene T, Burrowes J, et al.; HEMO Study Group. Are nutritional status indica-tors associated with mortality in the Hemodialysis (HEMO) Study? Kidney Int 2005;68:1766-76.
32. Vannini FD, Antunes AA, Caramori JC, Martin LC, Barretti P. Associations between nutritional markers and inflammation in hemodialysis patients. Int Urol Nephrol 2009;41:1003-9. DOI: http://dx.doi.org/10.1007/s11255-009-9563-8
33. Fouque D, Vennegoor M, ter Wee P, Wanner C, Basci A, Canaud B, et al. EBPG guideline on nutrition. Nephrol Dial Transplant 2007;22:ii45-87. DOI: http://dx.doi.org/10.1093/ ndt/gfm020
34. World Health Organization. Technical Report Series, 854. Physical status: the use and interpretation of anthropometry. Geneva: WHO; 1995. p.375-409.
35. Dumler F, Falla P, Butler R, Wagner C, Francisco K. Impact of dialysis modality and acidosis on nutritional status. ASAIO J 1999;45:413-7. DOI: http://dx.doi.org/10.1097/00002480-199909000-00009
37. Movilli E, Mombelloni S, Gaggiotti M, Maiorca R. Effect of age on protein catabolic rate, morbidity, and mortality in uremic patients with adequate dialysis. Nephrol Dial Transplant 1993;8:735-9. 38. Ballmer PE, McNurlan MA, Hulter HN, Anderson SE,
Garli-ck PJ, Krapf R. Chronic metabolic acidosis decrease synthesis and induced negative nitrogen balance in humans. J Clin Invest 1995;95:39-45. DOI: http://dx.doi.org/10.1172/JCI117668 39. Bailey JL, Wang X, England BK, Price SR, Ding X, Mitch WE.
The acidosis of chronic renal failure activates muscle proteolysis in rats by augmenting transcription of genes encoding proteins of the ATP-dependent ubiquitin-proteasome pathway. J Clin Invest 1996;97:1447-53. DOI: http://dx.doi.org/10.1172/JCI118566 40. Leavey SF, Strawderman RL, Young EW, Saran R, Roys E,
Ago-doa LY, et al. Cross-sectional and longitudinal predictors of se-rum albumin in hemodialysis patients. Kidney Int 2000;58:2119-28. PMID: 11044233 DOI: http://dx.doi.org/10.1111/j.1523-1755.2000.00385.x
41. Soleymanian T, Ghods A. The deleterious effect of metabolic aci-dosis on nutritional status of hemodialysis patients. Saudi J Kidney Dis Transpl 2011;22:1149-54.
42. Moran J, Schmidt B, Blumenstein M, Gurland H. Reduction of urea generation rate by ameliorating acidosis in hemodialysis [abs-tract]. Proc ERA-EDTA 1993;150.
43. Uribarri J, Levin NW, Delmez J, Depner TA, Ornt D, Owen W, et al. Association of acidosis and nutritional parameters in hemodialy-sis patients. Am J Kidney Dis 1999;34:493-9. PMID: 10469860 DOI: http://dx.doi.org/10.1016/S0272-6386(99)70077-6 44. Gao H, Lew SQ, Bosch JP. Moderate metabolic acidosis and its
effects on serum parameters in hemodialysis patients. Nephron 2000;86:135-8. DOI: http://dx.doi.org/10.1159/000045731 45. Brady JP, Hasbargen JA. Correction of metabolic acidosis and its
effect on albumin in chronic hemodialysis patients. Am J Kidney Dis 1998;31:35-40. DOI: http://dx.doi.org/10.1053/ajkd.1998. v31.pm9428449
46. Lu KC, Shieh SD, Li BL, Chu P, Jan SY, Lin YF. Rapid correction of metabolic acidosis in chronic renal failure: effect on parathyroid hormone activity. Nephron 1994;67:419-24. PMID: 7969674 DOI: http://dx.doi.org/10.1159/000188015
47. Movilli E, Zani R, Carli O, Sangalli L, Pola A, Camerini C, et al. Direct effect of the correction of acidosis on plasma parathyroid hormone concentrations, calcium and phospha-te in hemodialysis patients: a prospective study. Nephron 2001;87:257-62. PMID: 11287761DOI: http://dx.doi. org/10.1159/000045923
48. Bales AM, Moysés RM, dos Reis LM, Graciolli FG, Hung J, Martins Castro MC, et al. Correction of metabolic acidosis in hemodialysis: consequences on serum leptin and mineral metabolism. Int Urol Nephrol 2015;47:177-82. DOI: http:// dx.doi.org/10.1007/s11255-014-0844-5
49. Toigo G, Aparicio M, Attman PO, Cano N, Cianciaruso B, Engel B, et al. Expert Working Group report on nutrition in adult patients with renal insufficiency (part 1 of 2). Clin Nutr 2000;19:197-207. DOI: http://dx.doi.org/10.1054/ clnu.1999.0130
50. Marcelli D, Grassmann A, Bayh I, Scatizzi L, Marelli C, Etter M, et al. Association of changes in lean and fat mass and pa-tient clinical and laboratory parameters. Nephrol Dial Trans-plant 2013;28:i490-i491.
51. Rosenberger J, Kissova V, Majernikova M, Straussova Z, Bol-dizsar J. Body composition monitor assessing malnutrition in the hemodialysis population independently predicts mortality. J Ren Nutr 2014;24:172-6. DOI: http://dx.doi.org/10.1053/j. jrn.2014.01.002
52. Resolução da Diretoria Colegiada - RDC No 154 de 25 de junho de 2004 [Acesso 29 Mar 2015]. Disponível em: http:// www.samu.fortaleza.ce.gov.br/legislacao/Dialise_ANVISA_ RDC_154.pdf
53. John Gennari F. Very low and high predialysis serum bicarbo-nate levels are risk factors for mortality: what are the Appro-priate Interventions? Semin Dial 2010;23:253-7.