ORIGINAL ARTICLE
Active Surveillance of Renal Masses: An Analysis of Growth
Kinetics and Clinical Outcomes Stratified by Radiological
Characteristics at Diagnosis
_______________________________________________
Ryan Dorin, Max Jackson, Antonio Cusano, Peter Haddock, Halil Kiziloz, Anoop Meraney, Steven
Shichman
Hartford Hospital healthcare Group – Urology, USA
ABSTRACT
ARTICLE
INFO
______________________________________________________________ ______________________
AIMS: To determine the growth rate of renal masses (RMs) under active surveillance (AS), and to describe the clinical outcome of AS patients.
Materials and Methods: We conducted a retrospective review of an AS database to ob-tain demographics, radiological and pathologic characteristics and RM size of patients. RMs were followed at 6-12 month intervals for ≥1 year with computed tomography (CT), magnetic resonance imaging (MRI), or renal ultrasound. Kaplan-Meier analysis determined the annual likelihood of intervention. RMs were divided into 3 radiogra-phic subcategories (solid, cystic, and angiomyolipoma). A linear regression model de-termined RM growth rates.
Results: 131 RMs in 114 patients were included. Median age, Charlson Comorbidity Index score and mean follow-up were 69.1 years, 4.0 and 4.2±2.6 years, respectively. Maximal tumor diameter (MTD) at diagnosis was 2.1±1.3 cm. 49 RMs exhibited negative or zero net growth. Mean MTD growth rate for all RMs was 0.72±3.2 (95% CI: 0.16-1.28) mm/ year. When stratified by MTD at diagnosis, mean RM growth rates were 0.84, 0.84, 0.44, 0.74 and 0.71 mm/year for RMs <1 cm, 1-<2cm, 2-<3cm, 3-<4cm and ≥4cm, respective-ly (p<0.01). The 5 and 10-year freedom from intervention rates were 93.1% and 88.5%, respectively. There was a single case of suspected metastases, but no deaths related to kidney cancer.
Conclusions: RMs under AS grew slowly, and had a low incidence of requiring surgical intervention and progression. Solid enhancing masses grew slowly, and were more likely to trigger intervention. AS should be considered for selected patients with small RMs.
Key words: Watchful Waiting; Chronotherapy;
Angiomyolipoma; Kinetics
Int Braz J Urol. 2014; 40: 627-36
_____________________
Submitted for publication: September 23, 2013
_____________________
Accepted after revision: March 13, 2014
INTRODUCTION
The use of high resolution cross-sectional imaging has resulted in the detection of an increa-sing number of small, incidental renal masses (RMs), a significant proportion of which are subsequently found to be benign on pathologic examination (1).
Recent studies have highlighted the benefit of renal preservation in patients undergoing treatment
for renal cell carcinoma (RCC) and have demons-trated that RMs typically exhibit slow growth rates and a low incidence of metastatic spread (2,3). These findings suggest that active surveillance (AS) of RM patients may be a viable management strategy, par-ticularly for those patients at greater risk for perio-perative complications or chronic kidney disease (4).
Although AS is gaining acceptance as a RM management strategy, standardized protocols Vol. 40 (5): 627-636, September - October, 2014
628
are lacking, and clinicians may feel compelled to-wards surgical intervention owing to uncertainty over growth potential and the risk of disease pro-gression. We examined our institutional experien-ce with AS of RMs to characterize their growth and risk of progression, and attempted to risk stratify RMs based on radiologic characteristics at time of diagnosis. It was our objective to utilize these data to optimize active surveillance protocols, with the aim of minimizing the morbidity experienced by patients incidentally diagnosed with RMs.MATERIALS AND METHODS
The study was approved by the Hartford Hospital Institutional Review Board. Data from 114 patients, with a total of 131 RMs, who un-derwent active surveillance (AS) of a RM between January 2002 and June 2011, were retrieved from our IRB-approved renal mass active surveillance database. Patient demographics and clinical, ra-diologic, and pathologic RM characteristics were tabulated. Patients were diagnosed either inci-dentally or upon clinical presentation using ul-trasonography (US), computerized tomography (CT) or magnetic resonance imaging (MRI). Patient follow-up occurred at 6-12 month intervals using CT, MRI or US. Key factors that influenced under-taking a RM biopsy included (i) growth rate, (ii) the worsening of a suspicious feature on imaging while on AS (i.e. more enhancement or more de-finitive solid component), (iii) patient preference due to emotional distress/concern and (iv) signifi-cant patient comorbidities which would favor AS in the presence of low grade renal cell carcinoma (RCC). However, the decision to biopsy was made at the discretion of the treating physician follo-wing patient consultation.
An attending radiologist and urologist reviewed all images to determine RM size, appe-arance, contrast accumulation and fat content. Simple cystic lesions and cystic lesions with thin septations or walls without contrast enhancement (Bosniak Type I and II) were excluded. There were no prospectively established selection criteria for the patients undergoing AS.
In our institution, RMs are selected for AS based on tumor and patient characteristics,
inclu-ding each patient’s desire to undergo intervention. In general, solid RMs <3cm in diameter are consi-dered appropriate for AS, as well as angiomyoli-pomas (AML) <4cm in diameter. Larger tumors are also considered for AS in cases of severe patient comorbidity, solitary kidney, or the presence of Bosniak IIF cysts. Prior to entering the AS pro-gram, patients are counseled regarding the impact of comorbidities, age, the risk of surgery, a desire to undergo surgery, and RM size and appearance. All patients are counseled that in the event that their RM showed significant growth on follow-up, surgical intervention might be considered. Only patients who were followed for >12 months and had ≥2 imaging procedures on follow-up were in-cluded in the analysis.
The maximal tumor diameter (MTD) of RMs on imaging was determined, and recorded at time of diagnosis and on each follow-up visit. Specifically, a linear regression model was utilized to construct a “line of best fit” for the growth of each individual mass, and the growth rate was calculated from its slope. The average growth rate of each radiographic RM subgroup was calculated as the mean value of their growth rate slopes. Kaplan-Meier analysis was used to estimate the annual likelihood of requiring intervention. Statistical tests including (i) t-test, (ii) Mann-Whitney U test, (iii) ANOVA, and (iv) Kruskal--Wallis test were used depending on the assumption of homogeneity of the variances. Comparison be-tween the mean RM growth rates of the solid, cystic and AML groups (tests i and ii) and between RMs stratified according to their initial size (tests iii and iv) were performed. The growth rate of RMs with a positive net growth on follow-up, and histopatho-logically proven to be RCC, was also calculated. All statistical analyses were performed using SPSS v17.0 (Chicago, IL).
RESULTS
IBJU| ACTIVE SURVEILLANCE OF RENAL MASSES: CLINICAL OUTCOMES STRATIFIED BY RADIOLOGICAL
mean and median number of follow-up studies was 5.9±2.6 and 6.0, respectively (range 2-17). Patient demographics and RM characteristics are summarized in Table-1. At diagnosis, the mean maximal tumor diameter (MTD) was 2.1±1.3cm
(solid: 1.9, 0.7-4; cystic: 2.84±2.1, 0.9-9.2; AML: 1.63±1.16, 0.4-4.6cm). At the most recent patient follow-up visit, the mean MTD was 2.36±1.63cm (solid: 2.18±1.0, 0.3-5.3; cystic 3.13±2.8cm, 0.6-11; AML 2.04±1.08, 0.4-3.9cm).
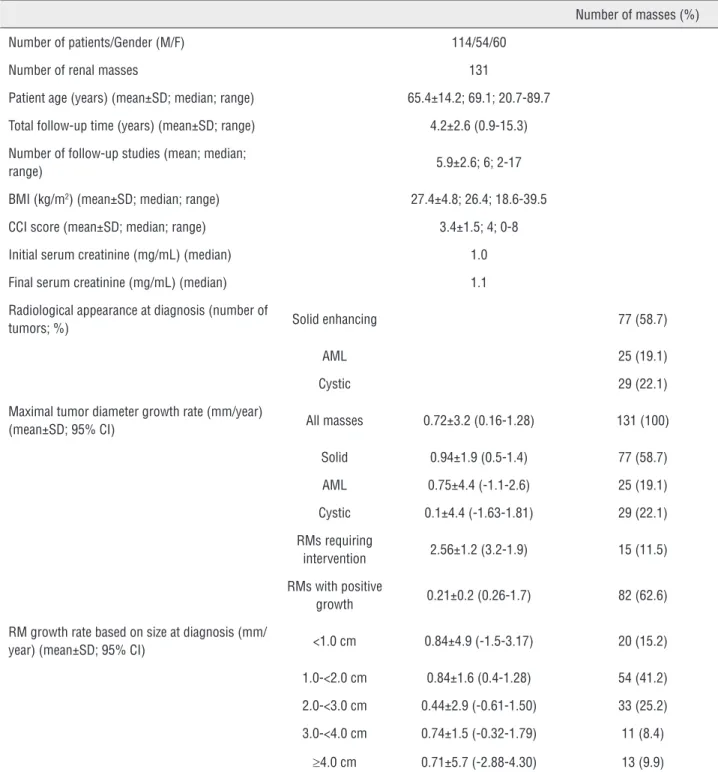
Table 1 - Demographics and clinical data of patients and RMs (data shown as mean ± SD where appropriate).
Number of masses (%)
Number of patients/Gender (M/F) 114/54/60
Number of renal masses 131
Patient age (years) (mean±SD; median; range) 65.4±14.2; 69.1; 20.7-89.7
Total follow-up time (years) (mean±SD; range) 4.2±2.6 (0.9-15.3)
Number of follow-up studies (mean; median;
range) 5.9±2.6; 6; 2-17
BMI (kg/m2) (mean±SD; median; range) 27.4±4.8; 26.4; 18.6-39.5
CCI score (mean±SD; median; range) 3.4±1.5; 4; 0-8
Initial serum creatinine (mg/mL) (median) 1.0
Final serum creatinine (mg/mL) (median) 1.1
Radiological appearance at diagnosis (number of
tumors; %) Solid enhancing 77 (58.7)
AML 25 (19.1)
Cystic 29 (22.1)
Maximal tumor diameter growth rate (mm/year)
(mean±SD; 95% CI) All masses 0.72±3.2 (0.16-1.28) 131 (100)
Solid 0.94±1.9 (0.5-1.4) 77 (58.7)
AML 0.75±4.4 (-1.1-2.6) 25 (19.1)
Cystic 0.1±4.4 (-1.63-1.81) 29 (22.1)
RMs requiring
intervention 2.56±1.2 (3.2-1.9) 15 (11.5)
RMs with positive
growth 0.21±0.2 (0.26-1.7) 82 (62.6)
RM growth rate based on size at diagnosis (mm/
year) (mean±SD; 95% CI) <1.0 cm 0.84±4.9 (-1.5-3.17) 20 (15.2)
1.0-<2.0 cm 0.84±1.6 (0.4-1.28) 54 (41.2)
2.0-<3.0 cm 0.44±2.9 (-0.61-1.50) 33 (25.2)
3.0-<4.0 cm 0.74±1.5 (-0.32-1.79) 11 (8.4)
630
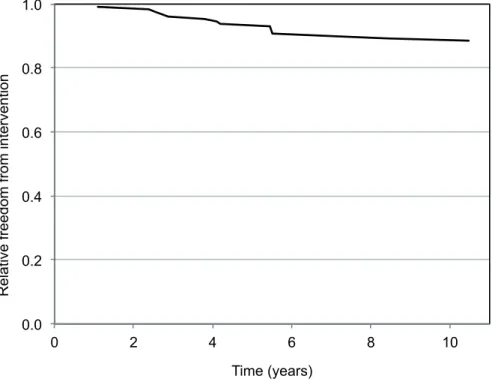
Mean MTD growth rate for all RMs was 0.72±3.2 (95% CI: 0.16-1.28) mm/year (solid: 0.94±1.9 (95% CI: 0.5-1.4) mm/year; cystic: 0.1±4.4 (95% CI: -1.63-1.81) mm/year; AML: 0.75±4.4 (95% CI: -1.1-2.6) mm/year; p<0.01 for all pairwi-se comparisons). The growth curves of RMs under surveillance are plotted in Figure-2. When stratified by MTD at diagnosis, mean RM growth rates were 0.84±4.9 (95% CI: -1.5-3.17), 0.84±1.6 (95% CI: 0.4-1.28), 0.44±2.9 (95% CI: -0.61-1.5), 0.74±1.5 (95% CI: -0.32-1.79) and 0.71±5.7 (95% CI: -2.88-4.3) mm/ year for RMs <1cm, 1-<2cm, 2-<3cm, 3-<4cm and ≥4 cm at diagnosis, respectively (p<0.01; Figure-3). 82 RMs (62.6 %) exhibited positive net growth, while 49 (37.4 %) exhibited negative or zero net growth during AS (solid masses: 25/77, 32.5 %; AMLs: 7/25, 28 % and cystic masses: 17/29, 58.6 %).Therapeutic intervention was performed on 15 RMs initially under AS. Of these, 13 of the mas-ses were solid enhancing masmas-ses and two were an-giomyolipomas. (Table-2). Interventions performed on these masses included 7 partial nephrectomies, 6 cryoablations, and one selective embolization for AML, at a mean time from diagnosis of 4.77±2.48 years (median: 4.2 years; 1.1-10.48) and at a mean tumor size of 2.83±0.63cm (2-3.8cm) (Table-2). The mean MTD growth rate of RMs eventually under-going surgical intervention was 2.57±1.2 mm/year. Indications for interventions were mass growth to a MTD >3cm in 5 RMs. The remaining RM underwent cryoablation due to patient anxiety in a mass mea-suring <2cm with minimal growth. The overall 5 and 10-year freedom from intervention rates were 93.1% and 88.5 %, respectively (Figure-4).
A
C
B
D
IBJU| ACTIVE SURVEILLANCE OF RENAL MASSES: CLINICAL OUTCOMES STRATIFIED BY RADIOLOGICAL
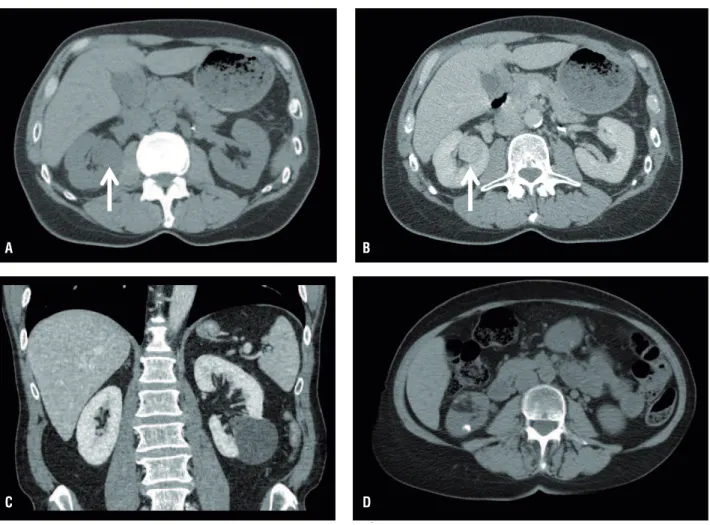
Figure 2 - A: Time dependent changes in maximal renal mass diameter for all renal masses. B: Time dependent changes in maximal renal mass diameter stratified by tumor type.
Figure 3 - Renal mass growth rates (mm/year) stratified according to A: maximal tumor diameter at diagnosis and B: tumor type (data shown as mean±95% CI, median, 1st and 3rd quartiles).
!#"
#!$
! %%$")&$& *$
' "$ &$&!"%%
! %%$")&$& *$
' "$&*#
% " *% !&$(!
A
A
B
632
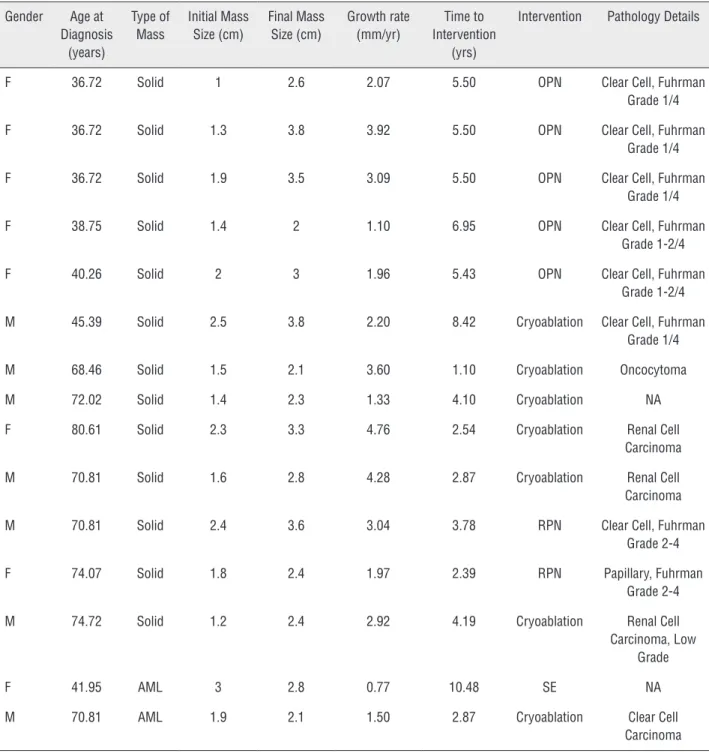
There were no confirmed deaths from kid-ney cancer. However, there was a single case of unconfirmed metastatic spread in an elderly male patient with significant comorbidities, who was diagnosed with a 3.6cm solid RM in the upper pole of the right kidney. Follow-up imaging at 12Table 2 - Renal masses under AS which progressed to surgical intervention.
Gender Age at Diagnosis
(years)
Type of Mass
Initial Mass Size (cm)
Final Mass Size (cm)
Growth rate (mm/yr)
Time to Intervention
(yrs)
Intervention Pathology Details
F 36.72 Solid 1 2.6 2.07 5.50 OPN Clear Cell, Fuhrman
Grade 1/4
F 36.72 Solid 1.3 3.8 3.92 5.50 OPN Clear Cell, Fuhrman
Grade 1/4
F 36.72 Solid 1.9 3.5 3.09 5.50 OPN Clear Cell, Fuhrman
Grade 1/4
F 38.75 Solid 1.4 2 1.10 6.95 OPN Clear Cell, Fuhrman
Grade 1-2/4
F 40.26 Solid 2 3 1.96 5.43 OPN Clear Cell, Fuhrman
Grade 1-2/4
M 45.39 Solid 2.5 3.8 2.20 8.42 Cryoablation Clear Cell, Fuhrman Grade 1/4
M 68.46 Solid 1.5 2.1 3.60 1.10 Cryoablation Oncocytoma
M 72.02 Solid 1.4 2.3 1.33 4.10 Cryoablation NA
F 80.61 Solid 2.3 3.3 4.76 2.54 Cryoablation Renal Cell
Carcinoma
M 70.81 Solid 1.6 2.8 4.28 2.87 Cryoablation Renal Cell
Carcinoma
M 70.81 Solid 2.4 3.6 3.04 3.78 RPN Clear Cell, Fuhrman
Grade 2-4
F 74.07 Solid 1.8 2.4 1.97 2.39 RPN Papillary, Fuhrman
Grade 2-4
M 74.72 Solid 1.2 2.4 2.92 4.19 Cryoablation Renal Cell
Carcinoma, Low Grade
F 41.95 AML 3 2.8 0.77 10.48 SE NA
M 70.81 AML 1.9 2.1 1.50 2.87 Cryoablation Clear Cell
Carcinoma
OPN: open partial nephrectomy; RPN: robotic partial nephrectomy; RCC: renal cell carcinoma; SE: selective embolization; NA: not available
IBJU| ACTIVE SURVEILLANCE OF RENAL MASSES: CLINICAL OUTCOMES STRATIFIED BY RADIOLOGICAL
Figure 4 - Kaplan-Meier curve describing the annual likelihood of a renal mass requiring intervention.
DISCUSSION
In the present study, we characterized the natural history of RMs under active surveillance and delineated which lesions may be most ap-propriate to manage under AS. These data may ultimately aid in the refinement of AS inclusion and termination criteria, and help manage risks associated with AS clinical management strate-gies.
Our data illustrate that RM growth rates under AS were lower than reported in previous studies. There were also clear differences in the MTD growth rate when RMs were stratified based upon their radiologic appearance at diagnosis. While the growth rate of AML lesions was the most rapid, they are clinically benign. AMLs are often managed with AS and subsequent inter-vention is commonly reserved until tumor size exceeds 4 cm, due to increased risk of bleeding and local symptoms (10). As such, understanding the average growth rate of AMLs is useful for patient counseling. Furthermore, the epithelioid
variant of AMLs can behave aggressively, fur-ther illustrating the importance of monitoring these lesions (11).
In contrast, complex cystic lesions sho-wed essentially zero growth over the time course of the study period, while solid masses showed an intermediate, yet slow rate of growth. The-se solid lesions, however, were the most likely to progress to intervention during AS, with the subset of RMs requiring intervention showing a much higher than average MTD growth rate (Figure-1). Pathology from masses undergoing intervention uniformly demonstrated low-grade (1,2) renal cell carcinoma, which carries a low risk of metastasis (12).
surveillan-634
ce of larger masses with subsequent growth may result in the inability to perform nephron-spa-ring surgery.The slow rate of RM growth in this study may be related to its non-randomized nature, as fast growing RMs may have undergone surgery prior to 1 year under AS and, therefore, did not meet the study inclusion criteria. A separate contri-buting factor to the slow rates of growth may have been the use of regression analysis rather than sim-ple arithmetic calculation to determine growth ra-tes. Previous studies using regression analysis have reported significantly slower growth rates (appro-ximately 1mm/year) as opposed to appro(appro-ximately 3 mm/year using arithmetic methodology (12). We feel that regression provides a more accurate pre-diction for renal mass growth over an extended pe-riod of time, as it controls for outlier measurements
which may skew growth curves constructed from relatively short follow-up intervals.
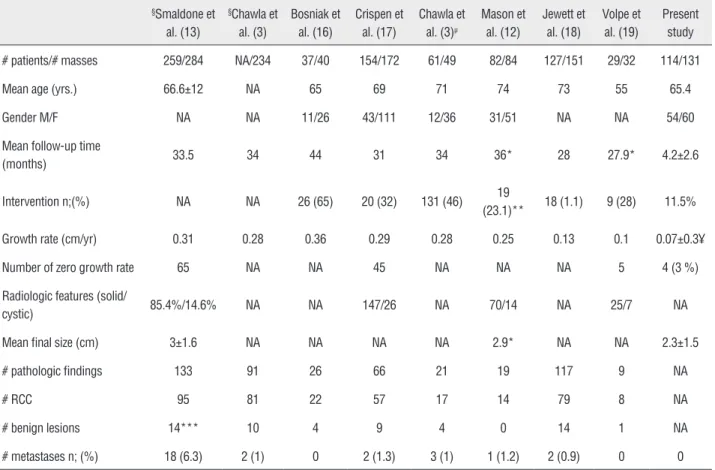
Previous studies have examined RM gro-wth rates, and investigated potential risk factors for growth and metastases, with the majority re-porting rates of metastasis approximating 1% (Ta-ble-3). Smaldone et al. compared tumor growth kinetics, follow-up time and patient age at diag-nosis in renal masses that progressed to metasta-tic disease but were not monitored under AS (13). They demonstrated that the mean and median age at diagnosis, initial and final MTD and initial and final tumor volume were higher in patients who progressed to metastatic disease. Chawla et al. also described predictors of tumor growth in a subset of their systematic meta-analysis. However, they could not identify a significant correlation betwe-en mass size at presbetwe-entation and growth rate (3).
Table 3 - Renal mass surveillance studies and meta-analyses.
§Smaldone et
al. (13)
§Chawla et
al. (3)
Bosniak et al. (16)
Crispen et al. (17)
Chawla et al. (3)µ
Mason et al. (12)
Jewett et al. (18)
Volpe et al. (19)
Present study
# patients/# masses 259/284 NA/234 37/40 154/172 61/49 82/84 127/151 29/32 114/131
Mean age (yrs.) 66.6±12 NA 65 69 71 74 73 55 65.4
Gender M/F NA NA 11/26 43/111 12/36 31/51 NA NA 54/60
Mean follow-up time
(months) 33.5 34 44 31 34 36* 28 27.9* 4.2±2.6
Intervention n;(%) NA NA 26 (65) 20 (32) 131 (46) 19
(23.1)** 18 (1.1) 9 (28) 11.5%
Growth rate (cm/yr) 0.31 0.28 0.36 0.29 0.28 0.25 0.13 0.1 0.07±0.3¥
Number of zero growth rate 65 NA NA 45 NA NA NA 5 4 (3 %)
Radiologic features (solid/
cystic) 85.4%/14.6% NA NA 147/26 NA 70/14 NA 25/7 NA
Mean final size (cm) 3±1.6 NA NA NA NA 2.9* NA NA 2.3±1.5
# pathologic findings 133 91 26 66 21 19 117 9 NA
# RCC 95 81 22 57 17 14 79 8 NA
# benign lesions 14*** 10 4 9 4 0 14 1 NA
# metastases n; (%) 18 (6.3) 2 (1) 0 2 (1.3) 3 (1) 1 (1.2) 2 (0.9) 0 0
IBJU| ACTIVE SURVEILLANCE OF RENAL MASSES: CLINICAL OUTCOMES STRATIFIED BY RADIOLOGICAL
Importantly, mean growth rate of pathologically proven benign lesions (mostly oncocytomas) and RCC variants did not differ statistically.
The strengths of our study include a rela-tively large single center sample size and follow--up interval, and the inclusion of a number of RMs >4cm in size. In addition, the stratification of RMs based on radiologic appearance enabled us to discern the low progression rate of cystic masses. Limitations of the present study include a lack of randomization and subsequent selection bias of patients on AS. The average patient age and CCI scores were relatively high in our cohort and so our findings may not be externally valid to younger and healthier cohorts of RM patients. Our findings may also not be directly applicable to patients with a genetic predisposition to aggressive renal cell car-cinoma variants such as hereditary leiomyomatosis and renal cell carcinoma (HLRCC) and succinate dehydrogenase mutation associated kidney cancer (14). An additional potential limitation was our re-liance on radiological characteristics to identify po-tentially malignant lesions, rather than pathology data from RM biopsies. While biopsies were perfor-med on only a small number of patients, improved biopsy yield has led to a recent shift to obtaining biopsies when clinically indicated.
Patient follow-up procedures consisted of a variety of CT, MRI and US imaging. Although we routinely use US when feasible, based upon RM visibility and patient body habitus, and the majority of our patients were imaged at 6 mon-th intervals, we did not prospectively employ a standardized protocol for follow-up imaging. A prospective study utilizing a single cross-sectional imaging modality over a standardized follow-up interval would be ideal, but perhaps not feasible due to costs, variability in renal function and con-cerns over radiation exposure. Additionally, the favorable clinical outcomes demonstrated in the present study indicate that this may be the pre-ferred imaging modality in terms of cost and sa-fety for AS protocols. Furthermore, RM size using US correlated well with size on CT or MRI in our patients, and in a previous study as well (15). As such, improved AS strategies may ultimately re-duce the number of imaging studies required and decrease patient exposure to radiation.
Our retrospective analysis may aid in the refinement of a risk stratification protocol for pa-tients under RM active surveillance, possibly in conjunction with renal mass biopsy and genomic testing to identify higher risk RMs. An improved AS treatment paradigm should promote the goal of nephron sparing by avoiding intervention in masses with a low risk of progression. Patients with low risk RMs may also be followed at longer intervals, resulting in fewer office visits.
CONCLUSIONS
Our data from the active surveillance of RMs over a >3 year median follow-up period demonstrate a low rate of tumor growth, with complex cystic masses exhibiting nearly zero net growth. Solid masses exhibited the highest gro-wth rate, and were also the most likely to trigger surgical intervention. A nephron sparing approa-ch for the management of incidental RMs should routinely include AS as an option in appropria-tely selected patients. Future studies are needed to delineate which RMs are most suitable for AS, particularly in younger patients.
ABBREVIATIONS
RM = Renal mass
AML = Angiomyolipoma
AS = Active surveillance
US = Ultrasonography
CT = Computerized tomography
MRI = Magnetic resonance imaging RCC = Renal cell carcinoma
CCI = Charlson comorbidity index
HLRCC = Hereditary Leiomyomatosis and Renal
Cell Cancer
CONFLICT OF INTEREST
None declared.
REFERENCES
636
2. Chiu Y, Chiu AW: Renal preservation therapy for renal cell carcinoma. Int J Surg Oncol. 2012; 2012: 123596.
3. Chawla SN, Crispen PL, Hanlon AL, Greenberg RE, Chen DY, Uzzo RG: The natural history of observed enhancing renal masses: meta-analysis and review of the world literature. J Urol. 2006; 175: 425-31.
4. Volpe A, Cadeddu JA, Cestari A, Gill IS, Jewett MA, Joniau S, et al.: Contemporary management of small renal masses. Eur Urol. 2011; 60: 501-15.
5. Cairns P: Renal cell carcinoma. Cancer Biomark. 2010; 9: 461-73
6. Mues AC, Landman J: Small renal masses: current concepts regarding the natural history and reflections on the American Urological Association guidelines. Curr Opin Urol. 2010; 20: 105-10.
7. AUA clinical guidelines: guideline for management of the clinical stage 1 renal mass. 2009. pp. 1-76.
8. Thomas AA, Campbell SC: Small renal masses: toward more rational treatment. Cleve Clin J Med. 2011; 78: 539-47. 9. Hollingsworth JM, Miller DC, Daignault S, Hollenbeck BK:
Five-year survival after surgical treatment for kidney cancer: a population-based competing risk analysis. Cancer. 2007; 109: 1763-8.
10. Sooriakumaran P, Gibbs P, Coughlin G, Attard V, Elmslie F, Kingswood C, et al.: Angiomyolipomata: challenges, solutions, and future prospects based on over 100 cases treated. BJU Int. 2010; 105: 101-6.
11. Thompson RH, Hill JR, Babayev Y, Cronin A, Kaag M, Kundu S, et al.: Metastatic renal cell carcinoma risk according to tumor size. J Urol. 2009; 182: 41-5.
12. Mason RJ, Abdolell M, Trottier G, Pringle C, Lawen JG, Bell DG, et al.: Growth kinetics of renal masses: analysis of a prospective cohort of patients undergoing active surveillance. Eur Urol. 2011; 59: 863-7.
13. Smaldone MC, Kutikov A, Egleston BL, Canter DJ, Viterbo R, Chen DY, et al.: Small renal masses progressing to metastases under active surveillance: a systematic review and pooled analysis. Cancer. 2012; 118: 997-1006.
14. Ricketts CJ, Shuch B, Vocke CD, Metwalli AR, Bratslavsky G, Middelton L.: Succinate dehydrogenase kidney cancer: an aggressive example of the Warburg effect in cancer. J Urol. 2012; 188: 2063-71.
15. Mucksavage P, Ramchandani P, Malkowicz SB, Guzzo TJ: Is ultrasound imaging inferior to computed tomography or magnetic resonance imaging in evaluating renal mass size? Urology. 2012; 79: 28-31.
16. Bosniak MA, Birnbaum BA, Krinsky GA, Waisman J: Small renal parenchymal neoplasms: further observations on growth. Radiology. 1995; 197: 589-97.
17. Crispen PL, Viterbo R, Boorjian SA, Greenberg RE, Chen DY, Uzzo RG: Natural history, growth kinetics, and outcomes of untreated clinically localized renal tumors under active surveillance. Cancer. 2009; 115: 2844-52.
18. Jewett MA, Mattar K, Basiuk J, Morash CG, Pautler SE, Siemens DR, et al.: Active surveillance of small renal masses: progression patterns of early stage kidney cancer. Eur Urol. 2011; 60: 39-44.
19. Volpe A, Cadeddu JA, Cestari A, Gill IS, Jewett MA, Joniau S, et al.: Contemporary management of small renal masses. Eur Urol. 2011; 60: 501-15.
_______________________ Correspondence address: Peter Haddock, MD Hartford Hospital healthcare Group - Urology 85 Seymour Street Hartford Connecticut 06106, United